
Streaming live events and managing event data only became a walk in the park when tools such as Redpanda entered the market. In fact, it was built with the sole purpose of eliminating the complexities common to Apache Kafka, improving performance, and making the architecture more safe and resilient.
However, the infamous Kafka alternative is not immune to anomalies. Hence, monitoring Redpanda is essential for developers to detect issues early, resolve them quickly, prevent downtime, and improve the overall data streaming experience.
In this article, we will dive into the importance of Redpanda monitoring, highlight the key metrics to observe, and top 3 Redpanda monitoring tools for 2024.
What is Redpanda?
Redpanda is a modern event streaming platform developed using C++ and built on top of the Raft consensus algorithm. It is protocol and API-compatible with Apache Kafka, and famous for low-latency data streaming—up to 10x lower—due to its patent-pending thread-per-core architecture.
Redpanda has an easy-to-use interface and tools for setting up and monitoring event streaming pipelines. It is used by developers as a cost-effective drop-in replacement for Kafka, for use cases like stream processing, real-time analytics, and event-driven architectures.
Why is monitoring Redpanda important?
Monitoring Redpanda helps you get actionable insights that empower you to effectively manage and optimize your Redpanda cluster.
Here are some top reasons why monitoring Redpanda is important:
Capacity planning
Monitoring helps you track resource usage, data growth, and cluster health trends. This information is valuable for capacity planning to ensure that your Redpanda cluster can scale to meet future demands.
It involves monitoring key resource metrics such as CPU utilization, memory usage, disk I/O, network traffic, and storage capacity across Redpanda nodes. Assessing the efficiency of the cluster helps you identify potential bottlenecks under different load conditions.
Capacity planning also means tracking data ingestion rates, retention policies, and storage usage patterns. This enables you to estimate how quickly your data volumes are increasing and plan storage expansion accordingly.
By understanding the characteristics of the workloads running on your Redpanda cluster, you can create workload models to simulate different scenarios and predict how changes in workload intensity or data volume impact resource requirements.
Performance optimization
By monitoring key metrics like throughput, latency, and resource utilization, you will easily identify performance bottlenecks and optimize configurations to ensure optimal performance of your Redpanda cluster.
It begins with monitoring key metrics such as message throughput, message latency, request rates, peak traffic periods, data access patterns, disk utilization, memory usage, and cluster health indicators.
Analyzing these metrics helps you pinpoint areas of the system that are limiting performance and take corrective actions. Monitoring also helps in fine-tuning settings related to buffer sizes, replication factors, batch sizes, and other parameters to achieve better throughput, lower latency, and improved resource utilization.
It also makes it easy to assess whether scaling out (adding more nodes) or scaling up (increasing resources on existing nodes) is the best approach to maintain or improve performance levels.
Efficient troubleshooting
Monitoring enables you to detect issues such as node failures, disk errors, or network problems promptly. With this, you’ll quickly troubleshoot and resolve issues before they impact your application. It also helps you minimize downtime and ensure the reliability of your event streaming platform.
As part of monitoring techniques, setting up alerting rules based on predefined thresholds or anomaly detection algorithms gets you notified about potential issues that require immediate attention.
Detailed analysis and correlation of these metrics helps you easily diagnose the root cause of issues and pinpoint where failures are occurring within the Redpanda cluster. Monitoring also facilitates collaborative troubleshooting which involves providing a shared understanding of the system’s state among team members.
This encourages the establishment of standardized troubleshooting playbooks based on common issues and best practices to streamline the troubleshooting process. By documenting known solutions, escalation procedures, and diagnostic steps, you’ll expedite the resolution of recurring problems and improve your system reliability.
Security and compliance
Monitoring helps in identifying security threats, unauthorized access attempts, and compliance violations within your Redpanda cluster. Redpanda supports end-to-end encryption, Kerberos authentication, Kafka-compatible ACLs, cloud IAM roles, Console SSO, and more.
Monitoring access control mechanisms within Redpanda, such as authentication, authorization, and encryption, helps you ensure that only authorized users and applications can interact with the cluster.
Data encryption mechanisms, such as SSL/TLS for data in transit and encryption-at-rest for stored data, helps you safeguard sensitive information within the Redpanda cluster. In furtherance, monitoring audit logs means tracing security incidents, compliance violations, and unauthorized activities within the cluster, helping in forensics, incident response, and compliance audits.
When you monitor security-related metrics, you’ll prevent data breaches, maintain data integrity and meet regulatory compliance.

What metrics should you monitor in Redpanda?
Public metrics
1. Cluster metrics
Cluster metrics are operational data collected from various nodes within the Redpanda cluster. They include information on resource utilization, node health, and other key parameters for optimizing the cluster’s performance.
i. Redpanda_cluster_brokers
This metric indicates the total number of Redpanda brokers currently active in the cluster. Monitoring it helps you ensure the cluster’s health and detect any discrepancies in the expected broker count. You can monitor it by setting a threshold with an alert system to notify you when the threshold is surpassed.
ii. Redpanda_cluster_controller_log_limit_requests_dropped
This metric indicates the number of requests dropped due to hitting the log limit in the Redpanda cluster’s controller. Monitoring this metric helps you understand if there are any issues with log limits affecting request processing.
iii. redpanda_cluster_partition_moving_from_node
This metric tracks the partitions currently moving from one node to another within the Redpanda cluster. It helps you optimize partition movement for better cluster performance. When this gauge shows a value of non-zero, check if partition replicas are being reassigned as expected or unexpectedly. This helps identify if there are any unusual movements of partition replicas.
2. Infrastructure metrics
With the following metrics, you can manage your system infrastructure and optimize its margins to handle peaks in processing, storage, and I/O loads:
i. Redpanda_cpu_busy_seconds_total
This metric measures the total CPU busy time in seconds within the Redpanda infrastructure. You can find out if the CPU is not being used by checking how much of the CPU core is active compared to its total capacity at a specific moment. This helps identify times when the CPU might be idle or not working as expected.
ii. redpanda_io_queue_total_read_ops
This metric denotes the total number of read operations in the I/O queue within Redpanda infrastructure. Monitoring this metric helps you track I/O performance and detect potential read operation bottlenecks.
iii. Redpanda_memory_allocated_memory
This metric indicates the memory allocated in bytes within the Redpanda infrastructure. Monitoring it helps you understand memory usage patterns and optimize memory allocation for efficient cluster operations.
iv. redpanda_memory_available_memory
This metric reflects the amount of available memory within the Redpanda infrastructure. It helps you ensure sufficient memory availability for smooth cluster operation and prevent memory-related issues.
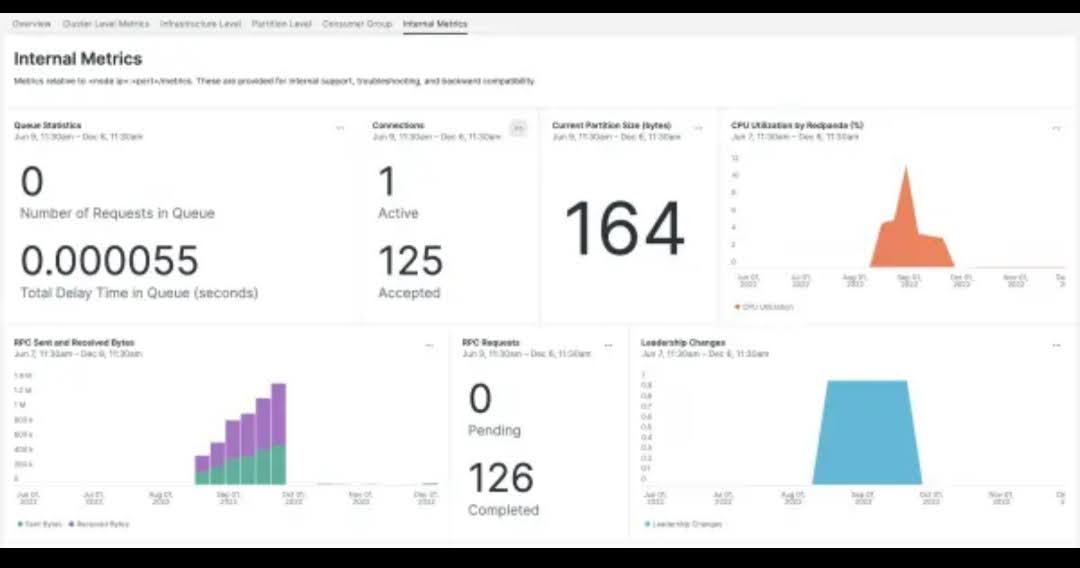
Internal metrics
Internal metrics are more specific to the internal workings and components of the Redpanda cluster. They provide detailed insights into the functioning of the cluster, including low-level details such as partition offsets, schema validation records, application uptime, and other internal parameters.
1. Vectorized_application_uptime
This metric tracks the uptime of the vectorized application within the Redpanda cluster in milliseconds. It provides insights into the application’s availability and reliability.
2. Vectorized_cluster_partition_last_stable_offset
This metric indicates the last stable offset for partitions within the vectorized cluster. It helps in assessing data consistency and partition stability. If this is the last record the cluster has received, it means the cluster is fully updated and ready for maintenance.
3. Vectorized_cluster_partition_schema_id_validation_records_failed
This metric monitors the number of failed schema ID validation records for partitions in the vectorized cluster. This metric helps you identify and resolve schema validation failures for data integrity and consistency.
Top 3 Redpanda Monitoring Tools
Middleware
Middleware is a full-stack cloud observability platform, offering intuitive dashboards for holistic insights and streamlined data analysis for various applications, databases, and platforms, including Redpanda. It automatically collects performance metrics from Redpanda and presents them within a centralized customizable dashboard.
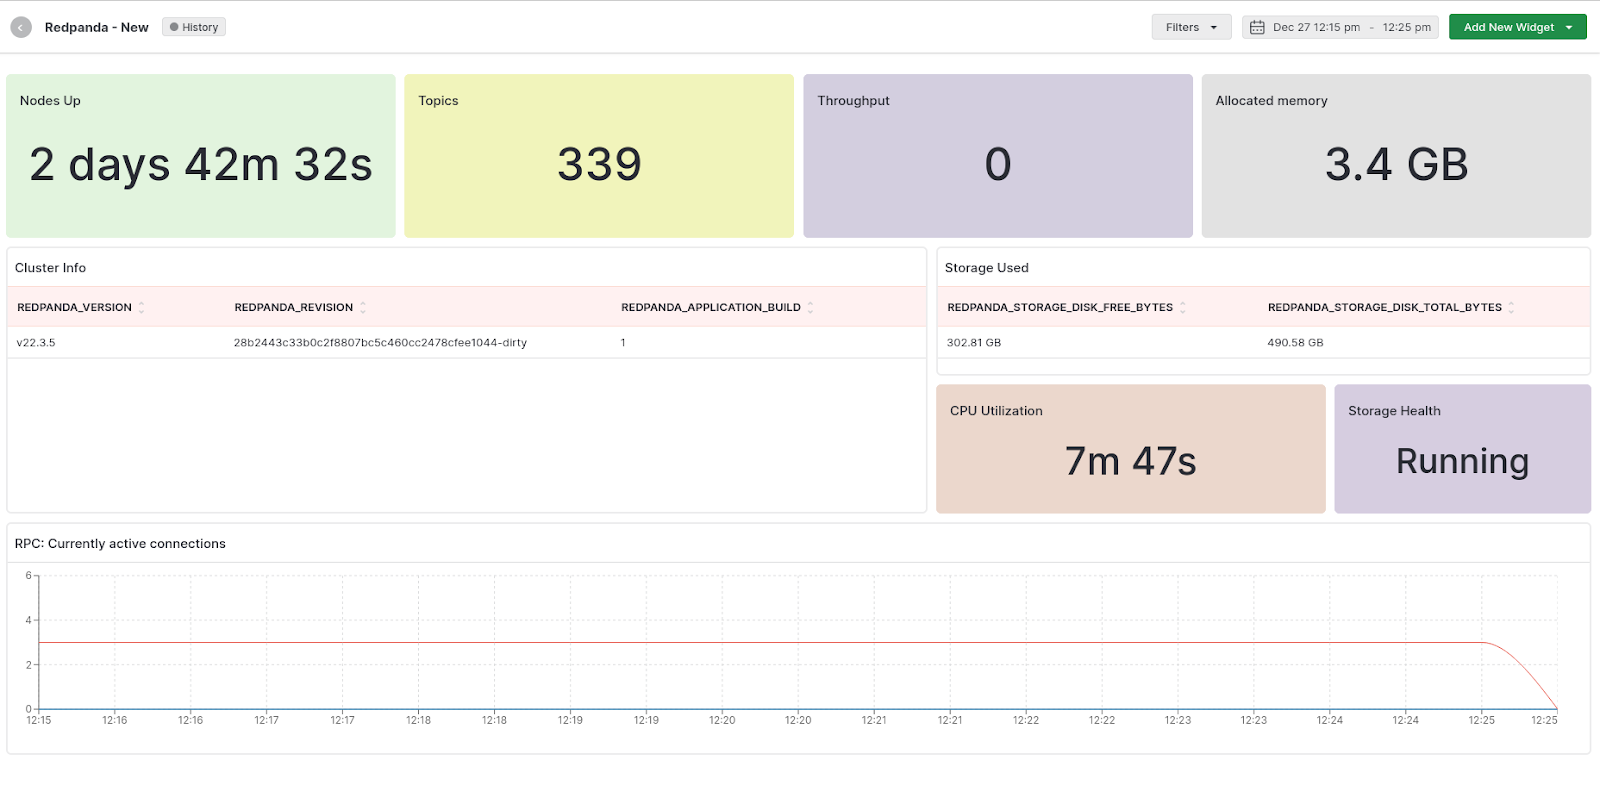
Middleware also offers a bespoke alert system equipped with algorithms for root cause analysis and actionable recommendations. You can configure the alerts to trigger anomaly detection and receive notifications when specific thresholds are exceeded. This proactive approach enables quick identification and resolution of issues across Redpanda clusters.
To monitor Redpanda with Middleware, click here.
Middleware supports all the key Redpanda metrics including but not limited to redpanda_cluster_controller_log_limit_requests_dropped, redpanda_cluster_partition_moving_from_node, redpanda_cluster_partition_node_cancelling_movements, redpanda_cluster_topics, redpanda_cpu_busy_seconds_total, redpanda_memory_allocated_memory, redpanda_rpc_request_errors_total, redpanda_schema_registry_request_errors_total, redpanda_storage_disk_free_bytes.
While offering correlation of metrics for in-depth analysis, Middleware also provides a causation-to-correlation feature that spots when an issue begins and where it ends. Read the Middleware Redpanda integration documentation for more information.
Datadog
Datadog is a monitoring tool for infrastructures and applications. It integrates with several systems, servers, databases and tools, including Redpanda.
Datadog has Redpanda integration and provides the needed Redpanda metrics for a detailed understanding of the streaming platform’s operations. Additionally, Datadog employs anomaly detection and alerting supported by machine learning algorithms to prevent alert fatigue, allowing you to concentrate on critical insights concerning your Redpanda clusters.
New Relic
New Relic provides a comprehensive monitoring of systems and applications, offering full visibility into their clusters and execution environment.
With its alerting system and query language, New Relic equips you with all the necessary tools to manage and monitor Redpanda clusters. It provides in-depth analysis for Redpanda metrics and simple visualization through its dashboard. New Relic seamlessly monitors Redpanda on major cloud providers and environments, including AWS, Azure, and Kubernetes.
Final thoughts
Although Redpanda simplifies—and cheapens—data streaming, monitoring the tool is as important as the data you are streaming. But you can only monitor effectively by using the appropriate monitoring tool.
Middleware is your surest bet at comprehensive Redpanda monitoring. How? See for yourself and try Middleware now.