Kafka’s outstanding availability, durability and scalability has made it a leading streaming and analytics platform for handling massive amounts of real-time data. As a critical tool in the data pipeline, it requires robust monitoring for efficient performance and proactive issue detection.
But Kafka offers only basic command-line monitoring, necessitating third-party monitoring tools that offer seamless metric collection and visualization.
Let’s take a walk through the Kafka architecture, the importance of Kafka monitoring, core metrics to track, and the right tools and best practices for Kafka monitoring.
What is Kafka?
Kafka is an open-source distributed streaming platform written in Java and Scala, and designed for high-throughput and scalable data streaming and processing. It provides a queueing and publish-subscribe system for real-time processing and storage of record streams.
The data is organized into topics, and producers publish messages to these topics. Consumers then subscribe to the topics and consume the messages in real-time. With Kafka, producers can serve large and diverse customers simultaneously.
Kafka handles high-volume data streams and provides low-latency message delivery—performing as many as 2 million writes per second. It also offers fault tolerance by replicating data across multiple brokers (servers) in a Kafka cluster, ensuring data availability even in the event of broker failures.
That is, in the event of a server failure, the other servers in the cluster take over to ensure continuous operation without any loss of data. This makes it suitable for use cases where data needs to be persisted and processed over time, such as event sourcing, log aggregation, real-time analytics and building data pipelines.
Kafka has a rich ecosystem of client libraries and connectors, which makes it easy to integrate with various programming languages and data systems. It also provides several APIs and extensible tools that provide support for Kafka cluster monitoring.
A Simplified Breakdown of the Kafka Architecture
Kafka comprises servers and clients communicating over a TCP network protocol. It functions as a cluster of interconnected servers, with some servers responsible for storing data and others handling the import and export of data as event streams.
Let’s take a look at eight critical components of Kafka and their functions in the table below.
| Components | Description |
| Topics | Topics are categories or streams of records. Kafka organizes data into topics. Every Kafka topic in a cluster has its unique name, e.g. ‘orders’ for a topic that contains data on customer orders for an e-commerce platform. Each topic is split into multiple partitions for parallel processing by spreading the data across multiple brokers. |
| Producers | Producers are apps that publish (or write) messages to Kafka topics. They automatically send messages to specific partitions in the Broker or let Kafka handle the partition assignment based on a partitioning strategy (e.g by using key hashing). |
| Consumers | KafkaController is a service that runs the brokers in a Kafka cluster. The controller is essentially the lead broker and there can be only one leader in a cluster. The controller manages partitions and replicas and stores their state for administrative functions (e.g., partitions reassignment). If a controller fails, another broker in the cluster is elected as leader. |
| Brokers | Brokers are the servers that form a Kafka cluster. They store and replicate Kafka topics received from or pushed by producers for consumers to pull. Each broker manages one or more partitions and handles producer and consumer requests. |
| Partitions | Partitions are the units of parallelism and distribution in Kafka. Each Kafka topic has at least one partition, which is replicated across multiple brokers in the cluster to provide redundancy. The Replicas maintain a leader-follower relationship, where the leader handles all read and write operations while followers replicate the data. If a leader fails, one of the followers automatically becomes the leader. |
| Offsets | KafkaController is a service that runs the brokers in a Kafka cluster. The controller is essentially the lead broker and there can be only one leader in a cluster. The controller manages partitions and replicas, and stores their state for administrative functions (e.g. partitions reassignment). If a controller fails, another broker in the cluster is elected as leader. |
| ZooKeeper | Apache ZooKeeper is an open source server that Kafka uses for cluster management. ZooKeeper keeps track of brokers, cluster membership and topic configurations. It also helps with electing partition leaders and applying producer/consumer throughput quotas. |
| Controller | KafkaController is a service that runs the brokers in a Kafka cluster. The controller is essentially the lead broker, and there can be only one leader in a cluster. The controller manages partitions and replicas and stores their state for administrative functions (e.g. partitions reassignment). If a controller fails, another broker in the cluster is elected as leader. |
Why is Monitoring Kafka Important?
The main reason for monitoring metrics such as message, latency and error rates is predicting issues or proactively detecting and resolving them to abstract potential disruptions or downtimes.
Here are other critical reasons you should monitor Kafka:
Capacity Planning
Monitoring Kafka helps you understand resource utilization patterns, such as data storage requirements, message throughput and consumer lag. These metrics enable you to plan for future capacity needs, scale your Kafka cluster and optimize resource allocation to meet increasing data volumes and processing demands.
Performance Optimization
Monitoring allows you to keep track of key metrics such as CPU usage, network throughput and disk utilization, which enables you to identify performance bottlenecks, optimize resource allocation and ensure optimal Kafka cluster performance.
For instance, monitoring consumer lag, which represents the time lag between message production and consumption, helps you identify slow-performing consumers, optimize consumer group configurations and ensure your consumers keep up with the data flow.
Efficient Troubleshooting
Since Kafka is a distributed multi-layered solution, troubleshooting it can be a hassle without up-to-date monitoring and logs. If a component fails, log and metric patterns can be correlated for quick root cause analysis.
For example, if your logs indicate a pattern of response rate reductions and consumer time-outs simultaneously, you can reasonably predict that there’s a problem with your broker server. The ability to hone down problematic components with monitoring data eases and hastens troubleshooting.
Security and Compliance
Monitoring Kafka helps you detect and respond to security-related events, such as unauthorized access attempts, abnormal traffic patterns or potential data breaches.
This ensures the continued integrity and confidentiality of your data. It also helps with compliance by ensuring adherence to data retention policies, access controls and audit requirements.
What Metrics should you be monitoring in Kafka?
When monitoring Kafka, the following are key metrics to visualize.
Broker Metrics
As the storage for Kafka messages, it is crucial to monitor the Broker. Its metrics include the Kafka system metrics, JVM Garbage Collector metrics, and Host metrics.
Kafka System Metrics
These include metrics such as CPU usage, memory utilization, disk usage, network throughput and request latency. Since these storages and resources may crash when they are full, monitoring them helps identify any resource constraints impacting the broker’s performance. The table below shows Kafka system metrics.
| Metrics | Description |
| under-replicated-partitions | Number of under-replicated partitions across all topics, indicating potential broker unavailability; ideal metric value is zero. |
| isr-shrinks-per-sec/isr-expands-per-sec | Rate of shrinking and expanding in-sync replicas (ISRs) when a broker goes down and recovers; ideal metric is 1 or less. |
| active-controller-count | Number of active brokers serving as the controller. |
| offline-partitions-count | Number of unreadable and unwritable partitions without an active leader, indicating broker unavailability. |
JVM Garbage Collector Metrics
Kafka is built with Java, and monitoring JVM garbage collector metrics helps assess the memory usage and garbage collection efficiency of Kafka brokers. These metrics include GC time, GC count and heap memory usage, which often indicate potential issues with memory management.
Host-Level Metrics
Monitoring host-level metrics, such as CPU utilization, disk I/O and network traffic provides insights into the underlying infrastructure’s performance. Here are four host-level metrics to look out for.
| Host-level metrics | Description |
| Page cache reads ratio | Ratio of reads from cache pages as against ratio of reads from disk; lower values mean slower reads and increased latency. |
| Disk usage | Amount of used vs available disk space, indicative of topic replication factor and broker log retention settings; full disk space will lead to failures. |
| CPU usage | Higher CPU usage—though very rare—suggests potential performance issues. |
| Network bytes sent/received | Amount of incoming and outgoing network traffic; higher usage bytes suggest performance degradation. |
Producer Metrics
Key Kafka producer metrics to look out for include message send rate, request latency and error rate. Monitoring them assists in identifying any issues with message production and delivery.
| Metrics | Description |
| compression-rate-avg | Average compression rate of sent batches, indicating the level of compression achieved on the data being sent; compression reduces network utilization and storage. |
| response-rate | Average number of broker responses received per producer; low response rates translate to delay in getting producer data to the consumer. Low response rates may mean you need to tweak configuration directives on brokers to allow brokers to acknowledge any of the following depending on preconfigured settings, messages have been: i) received, ii) received and committed to disk, iii) received, committed to disk and disk storage confirmed by replicas. |
| request-rate | Average number of requests sent to brokers per producer, indicative of producer and broker performance during traffic spike and decline. |
Consumer Metrics
Important metrics to monitor here include consumer lag, offset commit rate and rebalance time. Monitoring these metrics helps ensure that consumers are processing messages promptly.
| Metrics | Description |
| records-lag | Numerical difference between messages (log offset) sent by the producer consumed by the consumer or (less commonly) between partition leaders and their followers, indicating how far behind the consumer or the followers are in processing records. It may not be much of a problem if consumers process backed-up long-term storage—storage will slow down offset rate. But if consumers consume real-time data, repeatedly high records-lag may be indicative of overload; you may need to provision additional consumers and partitions. |
| records-lag-max | Similar to the above, records-lag-max refers to the maximum record lag observed. A higher value indicates a larger gap and a potentially greater performance issue. |
| bytes-consumed-rate | The average rate at which bytes are consumed per second by each consumer, either for a specific topic or across all topics; sharp drop in bytes rate could be a sign of anomalous/subpar consumer behavior or simply a change in traffic patterns (e.g due to configuration changes or provisioning of more consumers). |
Collect host level, producer level, consumer level and more metrics with Middleware. Get Started Free.
ZooKeeper Metrics
Monitoring ZooKeeper metrics such as connection count, request latency, and outstanding requests helps you to prevent Kafka cluster failures. If the ZooKeeper fails, consumers cannot read messages and clusters cannot function. The following metrics are critical.
| Metrics | Description |
| outstanding-requests | The number of queued requests; high outstanding queues can result in ZooKeeper throttling clients and slowing down performance— indicates ZooKeeper overload. |
| average-latency | The total count of clients that are currently connected to the ZooKeeper; sharp or consistent drops mean some clients (e.g., producers, consumers and brokers) have lost connection and would be unable to function as required. Reconnection, troubleshooting and reconfiguration may be needed to resolve this. |
| number-of-alive-connections | The total count of clients that are currently connected to the ZooKeeper; sharp or consistent drops mean some clients (e.g., producers, consumers and brokers) have lost connection and would be unable to function as required. Reconnection, troubleshooting and reconfiguration may be needed to resolve this. |
How to Monitor Kafka Metrics Using Middleware
Monitoring Kafka with Middleware is easy and 2-3 step process. You first need to sign up for Middleware if you haven’t and then follow this official doc for the next steps.
Kafka Monitoring Best Practices
The following Kafka monitoring best practices enable you to efficiently address performance bottlenecks and resource constraints:
- Track system performance and resource utilization using the metrics highlighted above. Doing this will optimize data flow/consistency, improve coordination between Kafka components, and minimize (or facilitate proactive resolution of) network congestion.
- Perform regular capacity planning operations using metric, log and traffic patterns, particularly those related to throughput, storage and consumer lag trends. This will facilitate accurate futuristic resource provisioning and prevent downtimes induced by resource insufficiency.
- Monitor Kafka logs for quick detection of anomalous activity, root cause, errors and warnings, ensuring the continued availability of your Kafka deployment.
- Leverage monitoring tools that provide built-in dashboards, real-time alerts, comprehensive visualization and historical analysis capabilities. These features will ease Kafka monitoring and troubleshooting. The built-in dashboards should offer customizable features and allow for centralized monitoring for end-to-end visibility.
Top 3 Kafka Monitoring Tools
Middleware
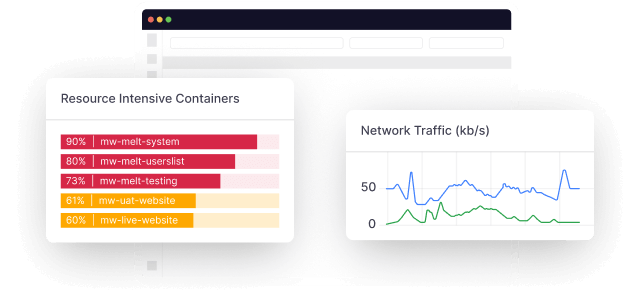
Middleware is a comprehensive, highly interoperable monitoring and management tool for various systems and tools, including Kafka. It has a user-friendly interface for effectively monitoring and troubleshooting systems and apps.
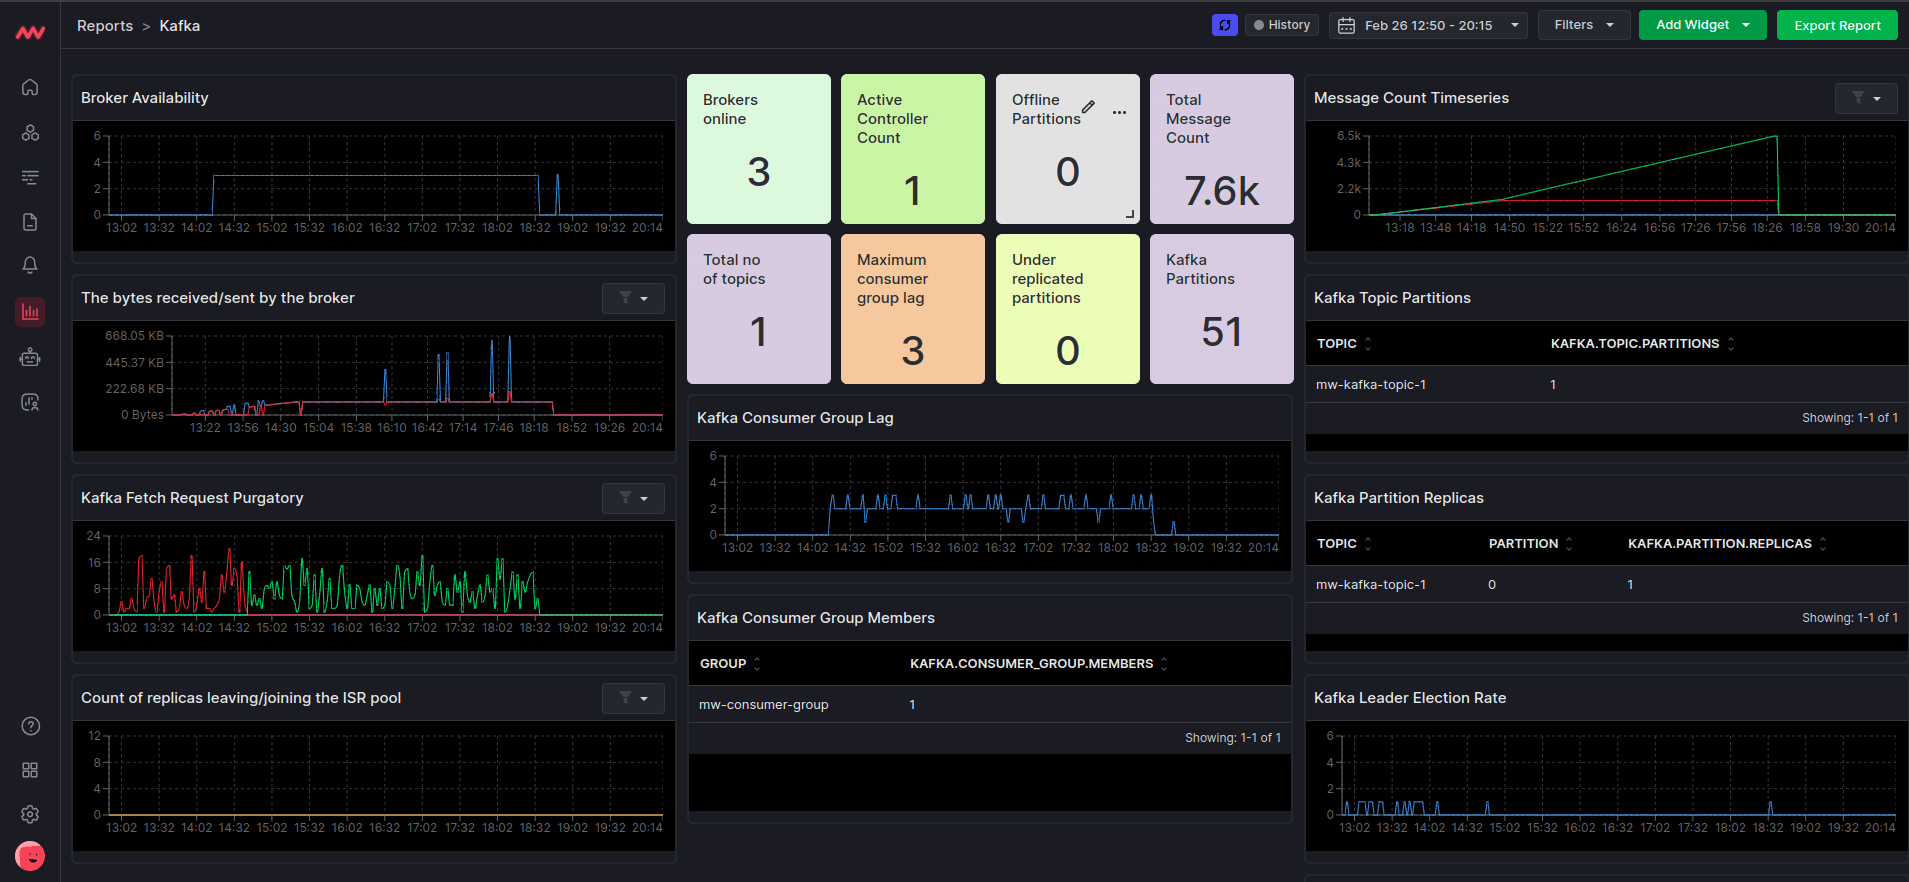
It collects data across multiple sources such as servers, clusters, containers and apps. Middleware’s intuitive dashboard provides insights into all aspects of Kafka performance monitoring, including topic-level metrics, consumer lag, broker performance, replication and consumer group behavior.
It also offers querying and filtering capabilities for Kafka data streams, making it a versatile tool for both monitoring and data exploration.
Start monitoring your Kafka data streams using Middleware.
Datadog
Datadog is a cloud monitoring platform that provides comprehensive monitoring solutions, including infrastructure monitoring, APM and logs.
It supports integration with Kafka, enabling you to track key Kafka metrics, set up alerts based on thresholds and correlate Kafka metrics with other components of your infrastructure.
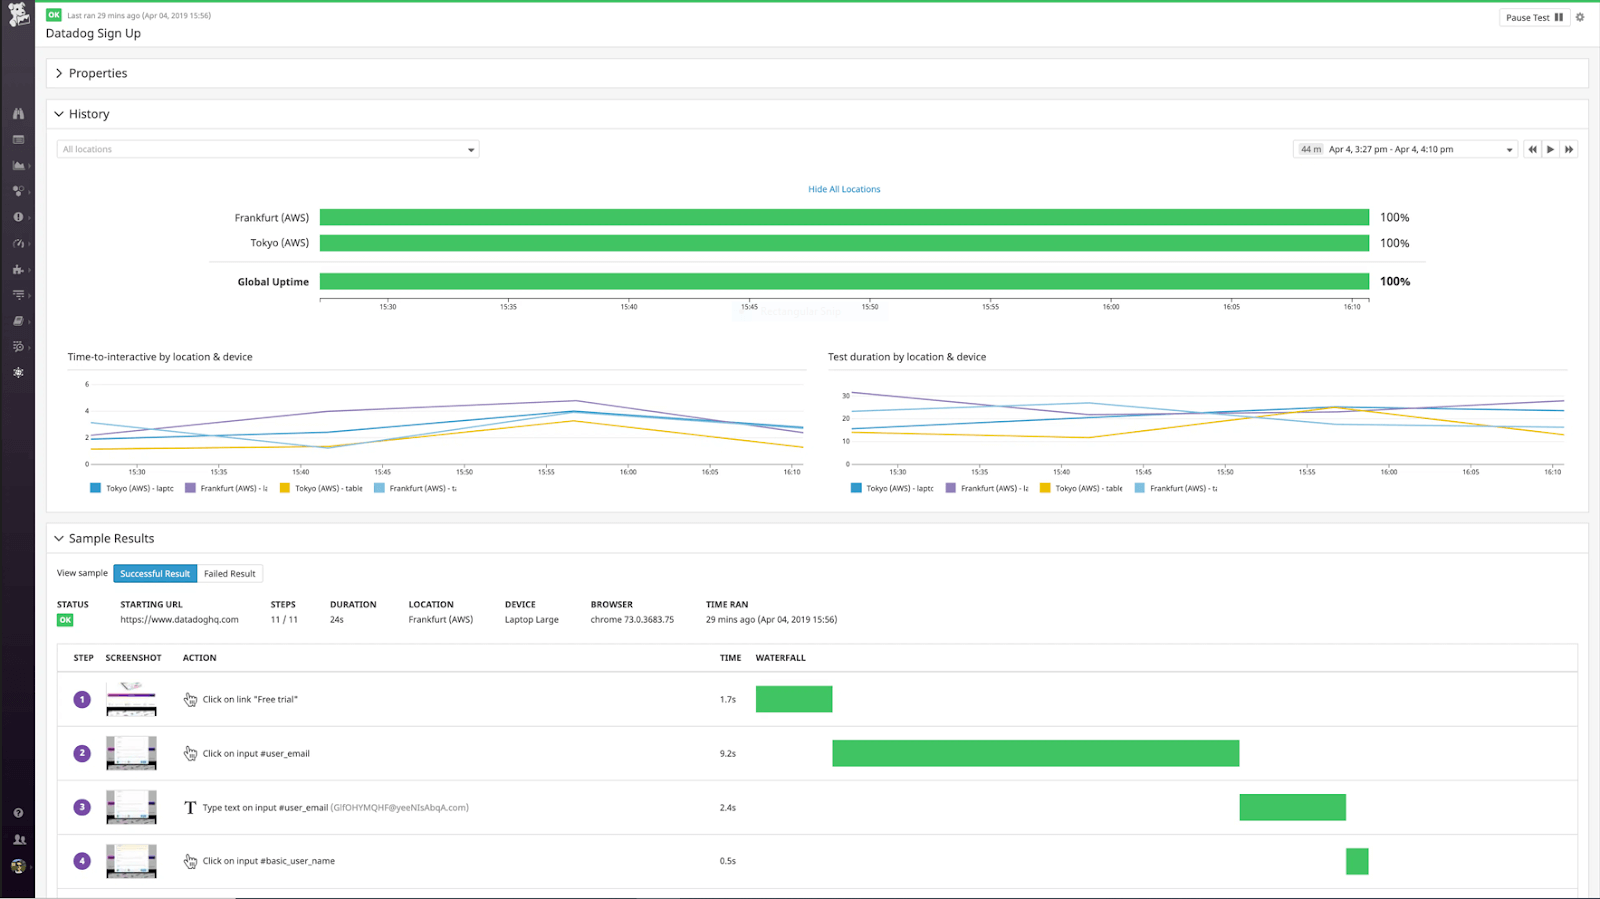
Datadog also provides flexible visualization options through customizable dashboards and supports anomaly detection to identify unusual Kafka behavior.
Prometheus/Grafana and kafka-exporter
Prometheus is an open-source monitoring and alerting toolkit that is used with Grafana, an open-source visualization platform. Kafka-exporter is a custom exporter specifically designed to scrape Kafka metrics and expose them to Prometheus.
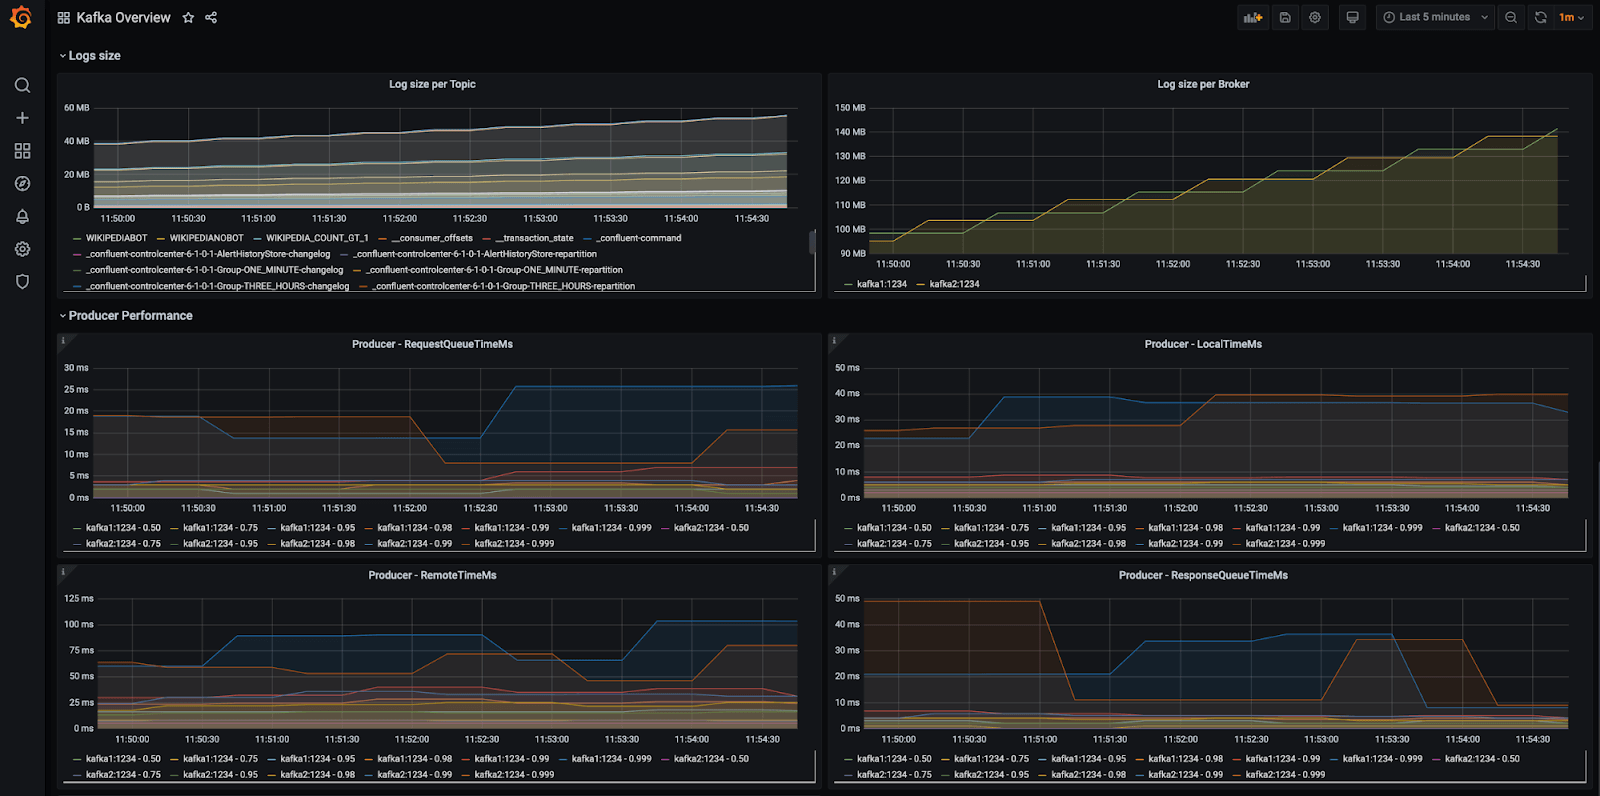
Together, Prometheus, Grafana, and Kafka-exporter provide a flexible and customizable solution for Kafka monitoring. With the help of a kafka-exporter, Prometheus collects metrics from Kafka, stores them in a time-series database, and Grafana displays these metrics on a dashboard.
Conclusion
Monitoring your Kafka environment is not an option or a one-time task. It is an ongoing process that you should continuously improve as your Kafka deployment evolves.
Staying up-to-date with the latest Kafka features and updates, and continuously monitoring your Kafka clusters will ensure its seamless operation and enable you to stay ahead of potential issues. Do this with Middleware’s efficient monitoring solution. Get started now!
FAQ
How do you monitor Kafka?
To monitor Kafka effectively, you have to set up monitoring for the right metrics, including Kafka broker, producer, consumer and ZooKeeper metrics.
Then, collect and analyze metrics related to CPU usage, memory utilization, disk usage, network throughput, request latency, consumer lag and topic details.
What tool is used to monitor Kafka messages?
Some of the various tools that can be used to monitor Kafka messages include Middleware, Datadog and Prometheus/Grafana custom collaboration.