As a software developer, it is critical to optimize and profile applications on AWS infrastructure for better performance and resource utilization. Slow and inefficient applications can have a significant impact on user experience, cost, and operational efficiency. So what you need is fine-tune application performance.

Interestingly, Amazon offers a powerful and easy-to-use solution—Amazon CodeGuru Profiler, a.k.a. AWS profiler, that helps you find and fix inefficiencies in your AWS infrastructure.
Its machine learning-powered analysis detects bottlenecks in your applications in real-time and provides actionable recommendations to improve their performance.
However, while Amazon CodeGuru Profiler is a great profiling solution, Middleware’s Continuous Profiler is a free third-party tool that can provide a better AWS profiling experience.
In this article, we’ll dive into the key features of Amazon CodeGuru Profiler and explore how Middleware’s Continuous Profiler can take your AWS profiling to the next level at no added cost.
What is AWS Profiler?
AWS Profiler is a cloud-based profiling and performance analysis tool from Amazon Web Services (AWS) that enables software developers to monitor and analyze the performance of their applications running on the AWS infrastructure.
AWS Profiler collects runtime performance data from your live applications in the AWS ecosystem and provides recommendations that help you fine-tune your application performance.
It also provides detailed and actionable visualizations of resource usage and performance metrics for specific parts of the code, which allows you to quickly identify weak points, such as memory leaks or inefficient resource usage.
While there are a number of third-party Amazon profilers in the market, Amazon CodeGuru Profiler is the only profiler offered by Amazon.
Amazon CodeGuru Profiler
Amazon CodeGuru Profiler is used interchangeably with AWS Profiler. AWS Profiler was first released as a preview service in 2019 and was later renamed and officially launched as Amazon CodeGuru Profiler in mid-2020 as part of the larger CodeGuru suite of developer tools from AWS.
Amazon CodeGuru is a suite of tools designed to help developers improve code quality, security, and performance. Two of the main components in the Amazon CodeGuru suite are Amazon CodeGuru Reviewer and Amazon CodeGuru Profiler. While CodeGuru Reviewer is for security, CodeGuru Profiler is for code optimization.
By analyzing the performance and efficiency of an application, CodeGuru Profiler provides detailed reports of how AWS resources are being consumed and actionable recommendations on how performance can be improved.
It also provides continuous profiling, and different visualizations of profiling data to help you identify what code is running on the CPU, see how much time is consumed, and suggest ways to reduce CPU utilization.
Also, CodeGuru Profiler requires minimal setup and can integrate with all AWS offerings. To begin profiling, you simply need to add a dependency to the CodeGuru Profiler agent library. Then during your application startup, you kick-start the agent.
What does AWS CodeGuru Profiler do?
With the CodeGuru AWS Profiler, you can simply achieve the following:
1. Troubleshoot latency and CPU utilization issues in your application
CodeGuru Profiler provides detailed information about where your application spends time, which can help in identifying and optimizing slow code areas.
AWS CodeGuru Profiler can also help troubleshoot high CPU utilization issues by identifying what parts of the application are taking up the most CPU resources and suggesting possible optimization strategies.
2. Learn where you could reduce the infrastructure costs of running your application
Developers are often concerned with keeping their infrastructure costs as low as possible without compromising on performance.
CodeGuru Profiler can help you identify application code areas responsible for high resource utilization, including memory, CPU, I/O, and network bandwidth.
3. Identify application performance issues
CodeGuru Profiler provides detailed insights into application performance metrics, including CPU usage, memory consumption, and resource utilization patterns. By identifying performance issues early, developers can make informed decisions about where to focus their optimization efforts.
4. Understand your Application’s Heap Utilization Over Time
Memory leaks and heap fragmentation can cause critical performance issues in applications. AWS CodeGuru Profiler provides detailed heap usage reports, including memory allocation, garbage collection patterns, object retention, allocation rate, and heap snapshots.
5. Support for Multiple Programming Languages
CodeGuru Profiler supports several programming languages, including Java, Python, Ruby, and Go. This makes it a useful tool for developers working in a variety of environments.
Why Middleware’s Continuous Profiler is a better choice
Middleware’s Continuous Profiler is a cloud-based profiler designed to monitor and improve the performance of applications running on all cloud-native environments, including Amazon Web Services (AWS).
It works by continuously collecting real-time performance data from your applications, helping you identify performance bottlenecks and optimize performance.
Middleware’s Continous Profiler offers various profiling categories, which include:
- The memory allocation profiling
- Object allocation profiling
- Memory usage profiling
- Object usage profiling
- And CPU usage profiling.
The following qualities are why Middleware’s Continous Profiler is a better choice:
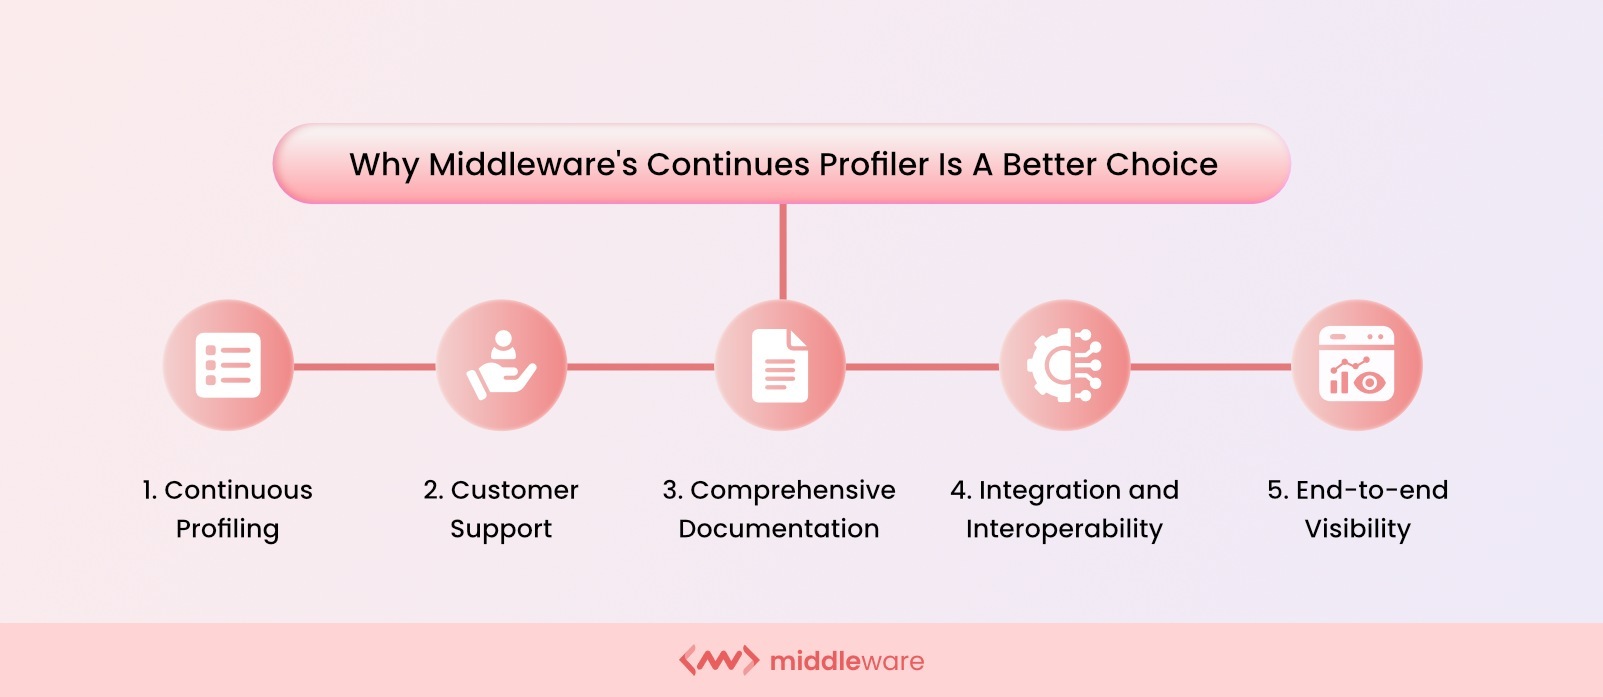
1. Continuous Profiling
Middleware’s Continuous Profiler optimizes your code performance at scale and helps you enhance your user experience during the production, deployment, or any stage of the development process.
It improves MTTR by analyzing and comparing code performance at all points in the process. Middleware’s Continuous Profiler uses a unique profiling technology: instead of periodically sampling runtime activities, it continuously collects performance data.
2. Customer support
Compared to Amazon CodeGuru Profiler, Middleware’s Continous Profiler offers a more personalized approach to support, providing customers with dedicated support engineers who are available to help with any issues that may arise.
3. Comprehensive documentation
Middleware’s Continuous Profiler also provides thorough documentation, user-centric guides, and a wide range of troubleshooting tools for customers to self-diagnose and solve issues quickly.
The support team is highly responsive even after hours, with guaranteed response time and SLAs for every support request.
4. Integration and Interoperability
Middleware’s Continuous Profiler offers a wide range of integration capabilities, making it easy for developers to integrate with other platforms, tools, or workflows in their organization.
This tool currently supports Python and Go and is working to provide support for Java soon. These features set Middleware’s Continous Profiler apart from other AWS profilers in the Amazon landscape.
5. End-to-end visibility
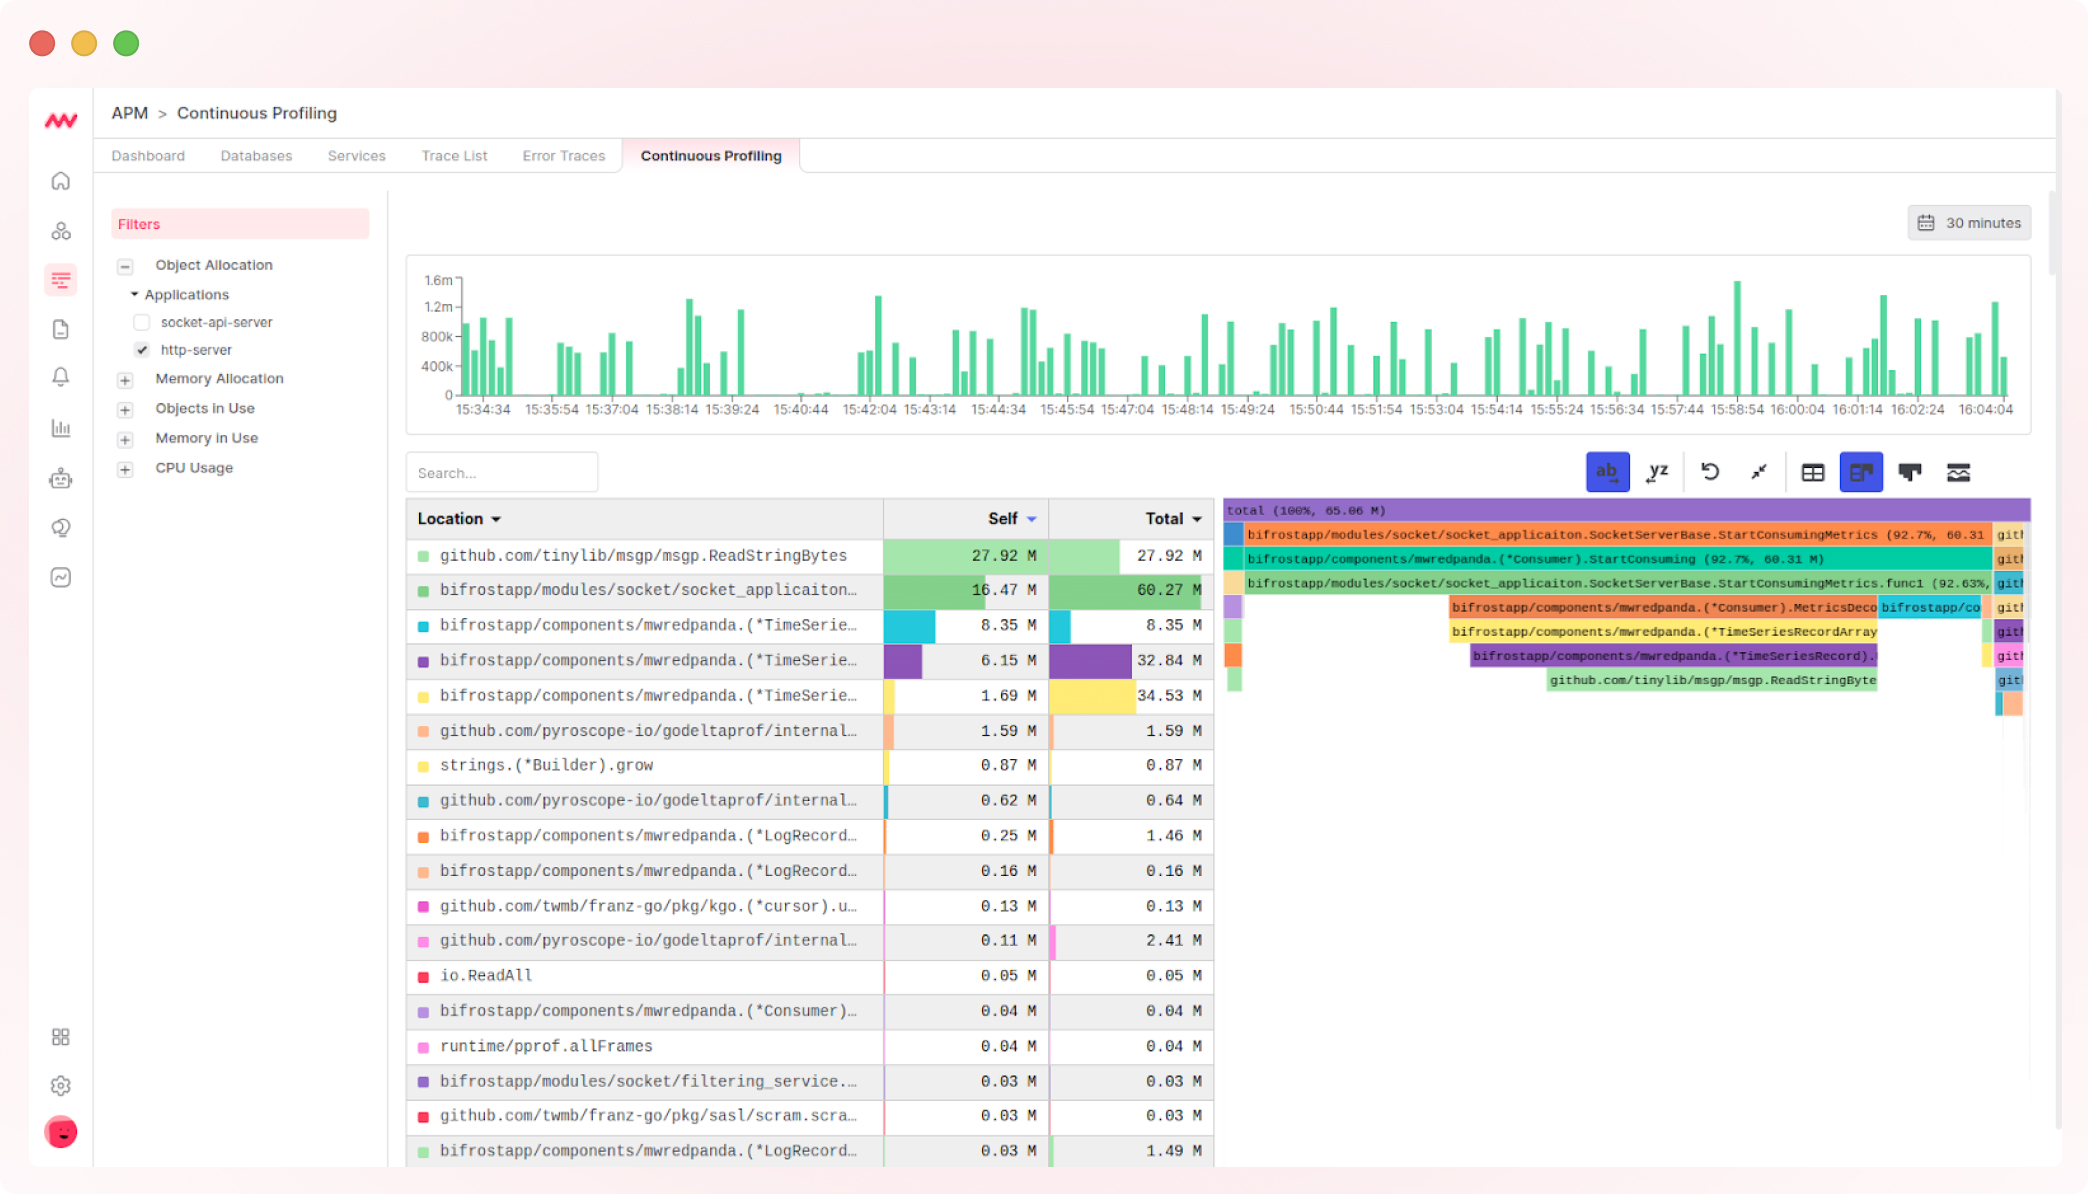
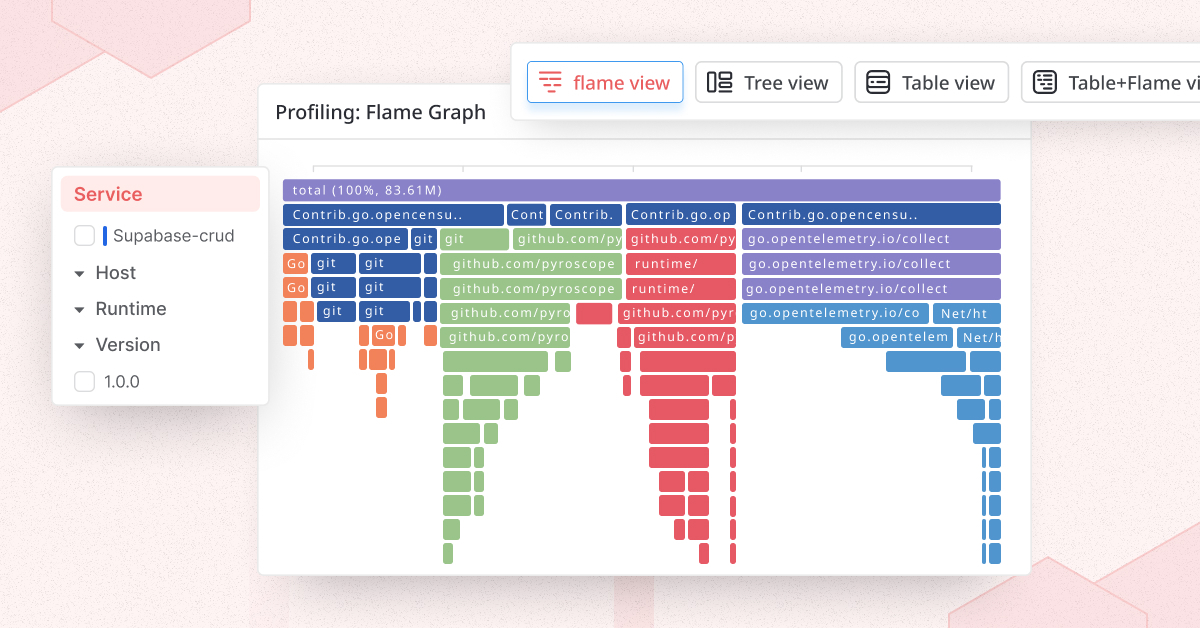
Middleware’s Continous Profiler also provides an inbuilt visualizer that gives end-to-end visibility into your applications. It also offers various viewing options, such as:
- Table View, which presents performance data in a tabular format;
- The FlameGraph View, which represents profiling data in a hierarchical and interactive manner
- The Sandwich View, which provides a comprehensive perspective on both time and space utilization in a software system.
This combines the visual representation of a flame graph with a stacked bar chart.
Profiling groups
A profiling group refers to a collection of applications that are profiled together as a single cohesive unit. The profiler sends application data to a single profiling group; this data is subsequently aggregated and analyzed in combination with data from all other applications within the same group.
Profiling groups provide a convenient way to manage the configuration and rules for profiling multiple applications or resources within a single AWS account and can also be used to isolate profiling measurements between teams, projects, or environments.
Middleware’s Continous Profiler provides this feature for your AWS applications. To manage your profiling groups, navigate to the Profiling groups page in the Middleware’s Continous Profiler console.
Selecting a specific Profiling group allows you to utilize various visualizations to delve into your profiling data and gain valuable insights.
It allows for dynamic profiling groups that can be configured to your exact needs. That is, groups can be created and adjusted according to the specific tiers of the application stack, making it possible to focus on specific problems within each tier.
Also, It supports multi-agent functionality, which eliminates any bottlenecks related to sampling rates.
This improves profiling accuracy and allows businesses to identify key performance metrics that would have gone undetected with limited sample rates.
It also has an architecture that adapts to the growth of a business. It scales with the business and can continue to efficiently profile in real-time without demanding more resources.
How to choose the best tool for Profiling
When it comes to choosing the right profiling tool for your AWS programming project, there are several factors to consider. The following are of utmost importance:
1. Language-supporting sampler
You need to choose the right sampler for your programming language. It is essential to consider the average runtime overhead that it adds to your application and the optimal runtime for your project.
Some profilers may add too much overhead, leading to skewed results, while others may not provide enough information to capture the real performance of your code.
It is, therefore, important to select a profiler that has low overhead and optimal runtime so that the data you collect accurately represents your program’s performance.
2. Data storage options
Different profilers store their data in different ways. Some store data directly in memory, others write to disk, and others may send data to external data stores like databases or cloud storage.
When selecting a profiler, choose one that offers multiple data storage options to capture data from different sources. This allows you to select the best method for your project.
3. Visualization capabilities
Profiling data alone is not always useful if you cannot analyze and understand it. Therefore, in addition to storing profiling data, choosing a profiler that offers easy-to-use reporting and visualization tools is crucial to help you understand the data you have collected.
This can range from pre-built visualizations to custom dashboards that can be used to generate reports and insights from your data to help you improve your project’s performance.
4. Integration with other tools
By integrating with other tools, the profiler provides a more complete and streamlined experience for users. It also helps reduce manual input and errors, saving time and resources.
When choosing a profiling tool, it is important to consider the types of tools you currently use and whether the tool is compatible with them.
This can include tools such as email clients, project management software, accounting software, customer relationship management (CRM) software, and more.
5. Customer support
In the event that your tool experiences any technical issues, you need a reliable support system to help you diagnose and fix the problem quickly so that any negative impact on your application performance is minimized.
A profiling tool provider should be able to respond quickly and provide clear feedback when you encounter any issues with the tool. Look for a provider with a 24/7 support team, especially if you have a global team or an application with high traffic or SLAs.
You also need to have clear communication channels with your support team, including emails, chatbots, phone lines, or support portals. Also, choose a provider with detailed, accurate documentation and a knowledge base that quickly resolves common issues.
Middleware’s Continuous Profiler provides all of these features and functions to help you make the most of your AWS-based applications. Middleware also offers on-premises/self-hosting of data to reduce data storage costs.
We also offer affordable data storage in S3, and our in-built visualizer gives end-to-end visibility into your application. Above all, our highly skilled experts are available to provide technical support.
Conclusion
Amazon CodeGuru Profiler offers valuable tools to help software developers running applications on AWS to identify and fix performance issues in their applications.
However, Middleware’s Continuous Profiler sets itself apart by offering a dynamic and flexible approach to profiling.
With its support for common programming languages, inbuilt visualization capabilities and data storage options, Middleware’s Continous Profiler provides a profiling service that goes beyond the ordinary sampling rates of traditional AWS profilers and other third-party profilers in the market. Learn more and give it a trial today!