
ClickHouse is an open-source database management system that developers query using SQL whenever they need to generate real-time analytical reports. It supports several SQL operations and storage is columnar: data is grouped and stored by column rather than by row.
ClickHouse can run queries on large volumes of data—up to petabytes! A single ClickHouse instance processes about 100 queries per second, and each INSERT query can contain at least 1,000 rows.
The above two factors are one of the reasons that made ClickHouse a household name for data warehousing and analytics.

6 Essential Metrics for ClickHouse Monitoring
ClickHouse metrics are as abundant as the sea, and attempting to track all will overwhelm you with so much information that you could lose track of the essentials. To prevent that, keenly study the metrics that matter most.
ClickHouse Events metrics
ClickHouse Events metrics indicate the query workload, system operations, and other critical events within ClickHouse. They include query counts, query processing times, system errors, and other operational events:
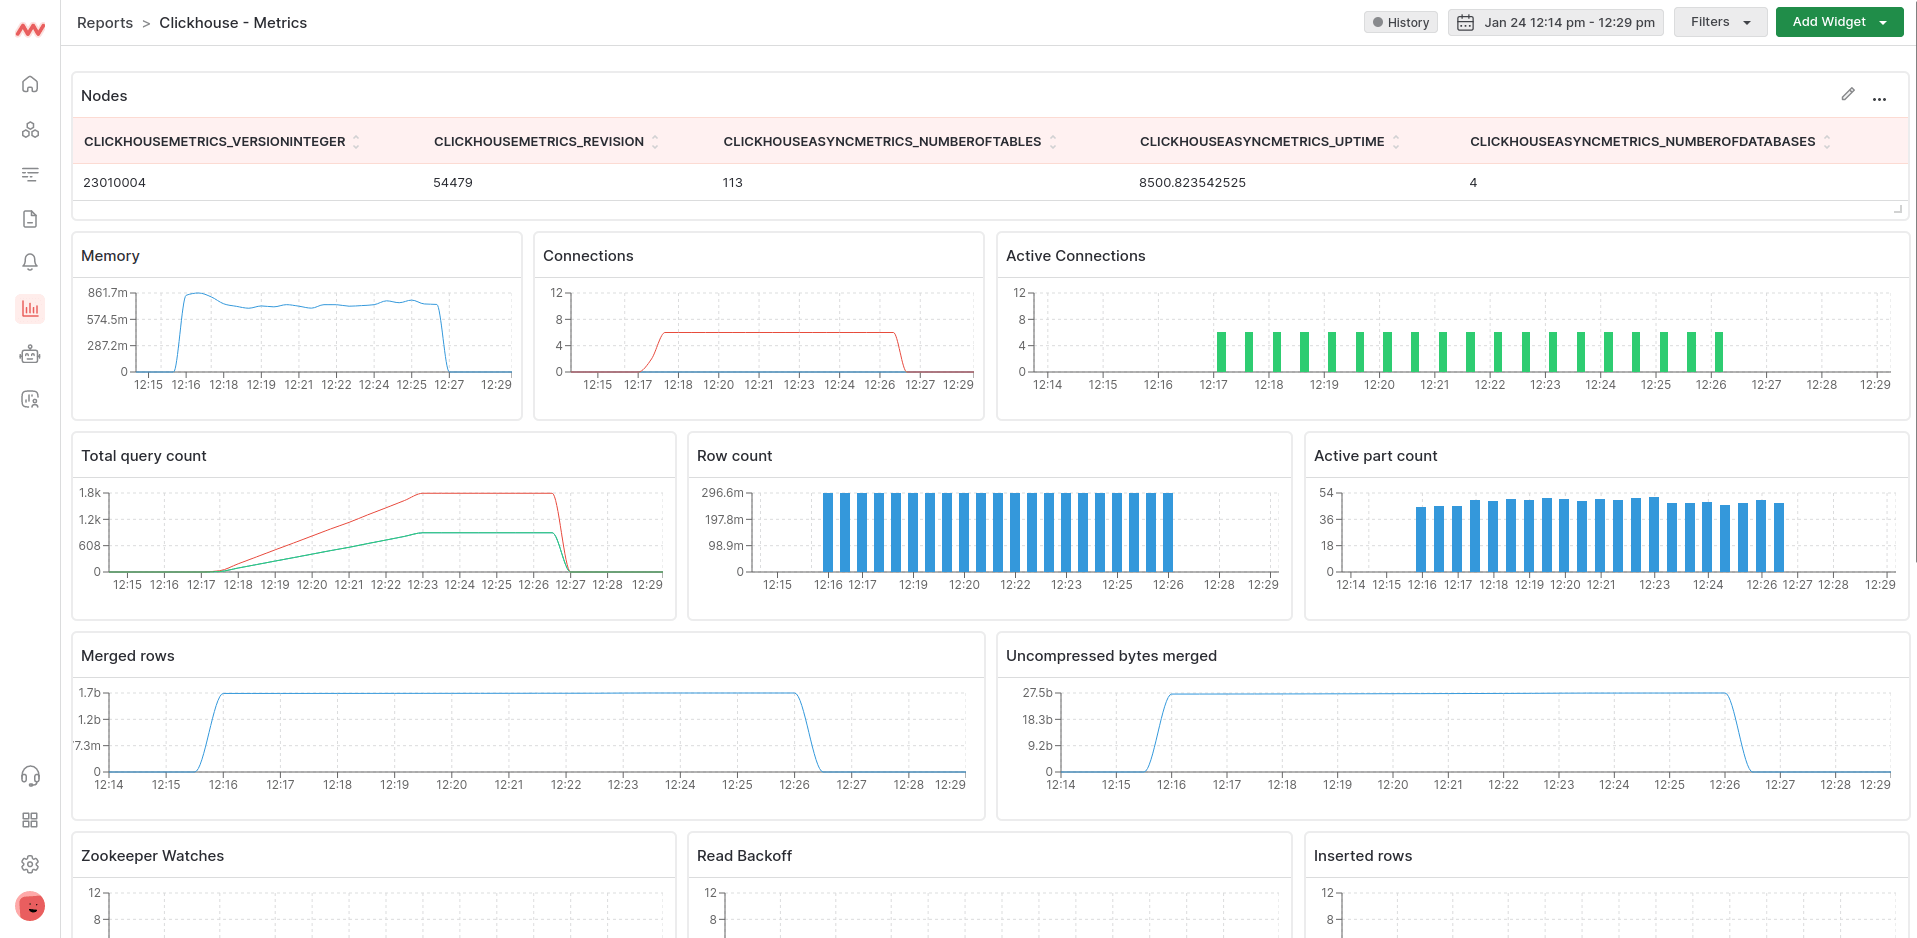
a. Total query count (query.count)
This metric, represented as ClickHouseProfileEvents_Query, measures the number of queries within the ClickHouse system, including those queued to be interpreted or potentially executed. It assesses the overall activity going on within the ClickHouse instances.
However, It does not include queries that failed to parse or were rejected due to various operational limits, such as Abstract Syntax Tree (AST) size limits, quota limits, or limits on the number of simultaneously running queries. It also does not count subqueries. However, it may include internal queries initiated by ClickHouse itself.
Monitoring this metric provides insights into the workload and query execution frequency, which helps in capacity planning and optimizing query performance. It enables you to ensure that the system can handle the query load and manage the resources allocated to it.
b. Query processing threads (queryThread)
ClickHouseMetrics_QueryThread shows the number of query processing threads. That is, the number of concurrent threads dedicated to processing queries within ClickHouse. Monitoring it gives visibility into the concurrency of query processing, insight into the degree of parallelism, and helps you ensure efficient resource utilization and throughput.
c. Stopped or waiting queries (queryPreempted)
ClickHouseMetrics_QueryPreempted displays the number of queries that are stopped and waiting due to the ‘priority’ setting. With this metric, you’ll gain visibility into the status of queries that are being held back and waiting for available resources. It is vital for resource management and query prioritization.
ClickHouse Network Metrics
Since ClickHouse uses a network to transmit information, tracking network metrics is vital in understanding ClickHouse’s performance. The following are crucial ClickHouse network metrics to fetch:
a. TCP Connections
ClickHouseMetrics_TCPConnection showcases the number of connections to the TCP server, for clients with native interface, as well as server-to-server distributed query connections. It also measures the load of your ClickHouse instance. Monitoring TCP connections metric involves tracking the number of active connections between clients or applications and the ClickHouse server at a given time.
Each established connection facilitates data transfer, query execution, and other communication between the client and the ClickHouse server. This metric provides insights into the overall traffic and workload being handled by the server, allowing you to optimize resources and ensure that the server can manage incoming and outgoing connections.
b. HTTP Connections
ClickHouseMetrics_HTTPConnection reflects the number of connections to the HTTP server, and a reflection of load. It helps you track the number of active connections made to ClickHouse through the HTTP interface. The metrics are utilized to understand data ingestion, and interactions with external tools and interfaces that communicate with ClickHouse via HTTP. It helps you gauge the web interface’s usage.
c. Interserver Connections
ClickHouseMetrics_InterserverConnection displays the number of connections from other replicas to fetch parts. The metric facilitates data replication, distributed query execution, and inter-server communication within a ClickHouse cluster. It allows you to evaluate the level of inter-server activity, optimize data transfer between nodes, query processing, and maintain the reliability of the ClickHouse cluster.
What ever key metrics you need for monitoring ClickHouse, we got you covered!
ZooKeeper metrics
ClickHouse uses Apache Zookeeper to store and manage metadata. Monitoring Zookeeper metrics is therefore crucial for understanding the state of your ClickHouse instance. It discloses how your database is using ZooKeeper. Key ZooKeeper metrics to watch out for include the following:
a. ZooKeeper watches
ClickHouseMetrics_ZooKeeperWatch reveals the number of watches, such as event subscriptions or any changes to specific znodes, in ZooKeeper. It allows distributed components to react to changes and maintain synchronization within the cluster. This metric helps you understand the workload on ZooKeeper and ensure its scalability and responsiveness.
b. ZooKeeper wait
ClickHouseProfileEvents_ZooKeeperWaitMicroseconds measures the number of microseconds spent waiting for responses from ZooKeeper after creating a request, summed across all the requesting threads. It also reflects the number of operations that are currently waiting. Monitoring this metric provides crucial insights into the responsiveness of ZooKeeper.
c. ZooKeeper requests
ClickHouseMetrics_ZooKeeperRequest shows the number of requests made to ZooKeeper on the fly, for operations such as reading or writing data, updating znodes, setting watches, and synchronization. Tracking the metric helps you understand the level of activity and the types of operations being performed within the distributed environment. It also offers visibility into the workload and usage patterns.
Asynchronous metrics
This contains the historical values for system.asynchronous_metrics, which are calculated periodically in the background, for example, the amount of RAM in use. Enabled by default, the metrics are saved once per minute.
a. Max active part count
ClickHouseMetrics_PartsActive shows the maximum number of active data parts in ClickHouse partitions, which are used by current and upcoming SELECTs. The active data part is used in a table, but if it becomes inactive, it will be flagged for deletion.
Monitor all key ClickHouse metrics in one place. Middleware.
Data part metrics
Data Part metrics help in tracking the distribution and storage of data within ClickHouse. They include information about the sizes of data parts, the distribution of data across nodes, and other details related to the storage and organization of data within the ClickHouse database.
a. Row count
ClickHouseProfileEvents_MergedRows is the number of rows read for background merges, and shows the number of rows before the merge. Inactive data parts are retained after a merging process. Monitoring this metric offers insights into data merging operations.
Replica status
The Replica Status provides insights into the replication status of data across different nodes within a ClickHouse cluster. It includes information about the synchronization of data replicas, replication lag, and the health of data redundancy within the cluster.
a. Replica queue size
ClickHouseAsyncMetrics_ReplicasMaxQueueSize shows the maximum size of the queue across replicated tables waiting to be performed. This includes the size of operations like merges, and inserting blocks of data, among others. This metric offers insights into replication workload and helps ensure data consistency.
b. Replica queue merges (long gauge)
ClickHouseAsyncMetrics_ReplicasMaxQueueMerges indicates the count of queued merges waiting to be executed. Since merges can take a significant amount of time to complete, this value might remain above zero for an extended period. It helps ensure fault tolerance and high availability within ClickHouse.
Monitoring ClickHouse using Middleware
Middleware is an all-in-one comprehensive observability platform that seamlessly integrates with ClickHouse and eases your big data analytics projects.
It provides you with relevant metrics for monitoring both read and write performance over time. It enables tracking of the INSERT and SELECT query rates per ClickHouse instance, along with the number of rows written per query.
With Middleware, you’ll be able to monitor ClickHouse data in a visualized, end-to-end visibility through pre-built performance charts that display your metrics for swift issue resolution. It combines anomaly detection technology with a threshold-based alert system for timely notifications.
Middleware is the right tool for ClickHouse Monitoring because, in addition to real-time performance metrics, customized dashboards, and alerting system, it enables the aggregation and analysis of ClickHouse metrics for a holistic view of system activities.
Get started with Middleware for your ClickHouse projects.


