
Distributed tracing is a powerful method for monitoring applications that span multiple services and environments, which is common in today’s microservices, containerized, or serverless systems.
In this guide, we’ll explain what distributed tracing is, how it works, why it’s essential for modern DevOps teams, and how tools like Middleware help you trace requests end-to-end with full context.
What is distributed tracing?
Distributed tracing is a method of tracking requests as they move across services and systems in a distributed application. It provides end-to-end visibility into how requests are processed from the frontend to the backend and helps engineers identify performance bottlenecks, errors, and dependencies.
Each request is assigned a unique trace ID, and every step in the journey is recorded as a span, which contains metadata like duration, error codes, and timestamps. These spans are linked together to form a complete trace, which represents the end-to-end path of the request.
Traditional tracing vs. Distributed tracing
As a developer, you may ask, What’s so great about distributed tracing? And how’s it different from traditional tracing? Well, the answer is simple.
Traditional tracing emphasizes monitoring and analyzing the performance of a single system or application. Typically, the focus is on capturing information on a program execution within a single process.
For this, developers instrument their code by including logging statements or deploying profiling tools to gather data about the execution flow, method calls, and resource usage within a particular application. Distributed tracing covers multiple components, applications, and services that work in conjunction to become a distributed system. This broadness makes distributed tracing perfect for modern, microservices-based architectures.
In the case of distributed tracing, developers instrument every service or component involved in a transaction to generate trace data. A trace showcases the end-to-end journey of a particular request across different services, highlighting the timing, dependencies, and interactions between services.
Distributed tracing systems provide a detailed view of how multiple services work in parallel to process a single request.
Key Difference:
| Feature | Traditional Tracing | Distributed Tracing |
| Scope | Single process/monolith | Multiple services/distributed system |
| Focus | Internal execution, code paths | End-to-end request flow, inter-service communication |
| Complexity | Lower (within one application) | Higher (across network boundaries, multiple technologies) |
| Visibility | Siloed, internal | Holistic, across system boundaries |
| Primary Use Case | Debugging monolithic applications, local profiling | Troubleshooting microservices, performance in distributed systems |
How distributed tracing work?
Distributed tracing helps model and convey the relationships between services in your distributed system in terms of its RPCs (remote procedure calls).
To utilize distributed tracing in your software applications and environments, you must add instrumentation to the code to enable requests to be monitored and tracked. Instrumenting your application source code programmatically makes it possible to monitor and track it with trace data.
Distributed tracing follows a systematic process to track requests as they flow through complex, multi-service architectures. Here’s a concise overview of each step in the tracing lifecycle.
- Instrumentation: The Code is instrumented to generate trace data for each request.
- Request Initiation: Each request receives a unique Trace ID.
- Propagation: As the request moves through services, each service creates a span and passes the Trace ID along.
- Data Collection: Spans are collected and sent to a backend for aggregation.
- Analysis: Engineers analyze the trace data to identify bottlenecks, errors, or latency issues.
Tracks requests across your distributed system and analyzes your traces in one place.
Example of distributed tracing in microservices
Imagine an end-user on a question-and-answer platform might trigger an API call from the frontend to the backend when looking to retrieve information about a specific question. That question might have additional information, such as comments, answers, and the respective system users that created them.
These three components, namely comments, answers, and users, could each represent a microservice that gets called subsequently to the initial API call. In the context of distributed tracing, these subsequent calls will be captured as nested child spans of the top-level child span (initiated by the frontend API call to fetch details for a specific question).
For optimal analysis and visualization, an end-to-end platform like Middleware captures all of these activities (spans), along with additional details such as request-response codes, request duration, latency, faults, errors, and other forms of metadata. All of this is recorded and presented in the form of an automatically generated flame graph.
This format gives a detailed birds-eye view of network requests traversing the relevant application environment and enables engineers and operators to easily detect, analyze and prioritize performance issues or errors revealed by the traces.
Here’s how it looks like in Middleware:
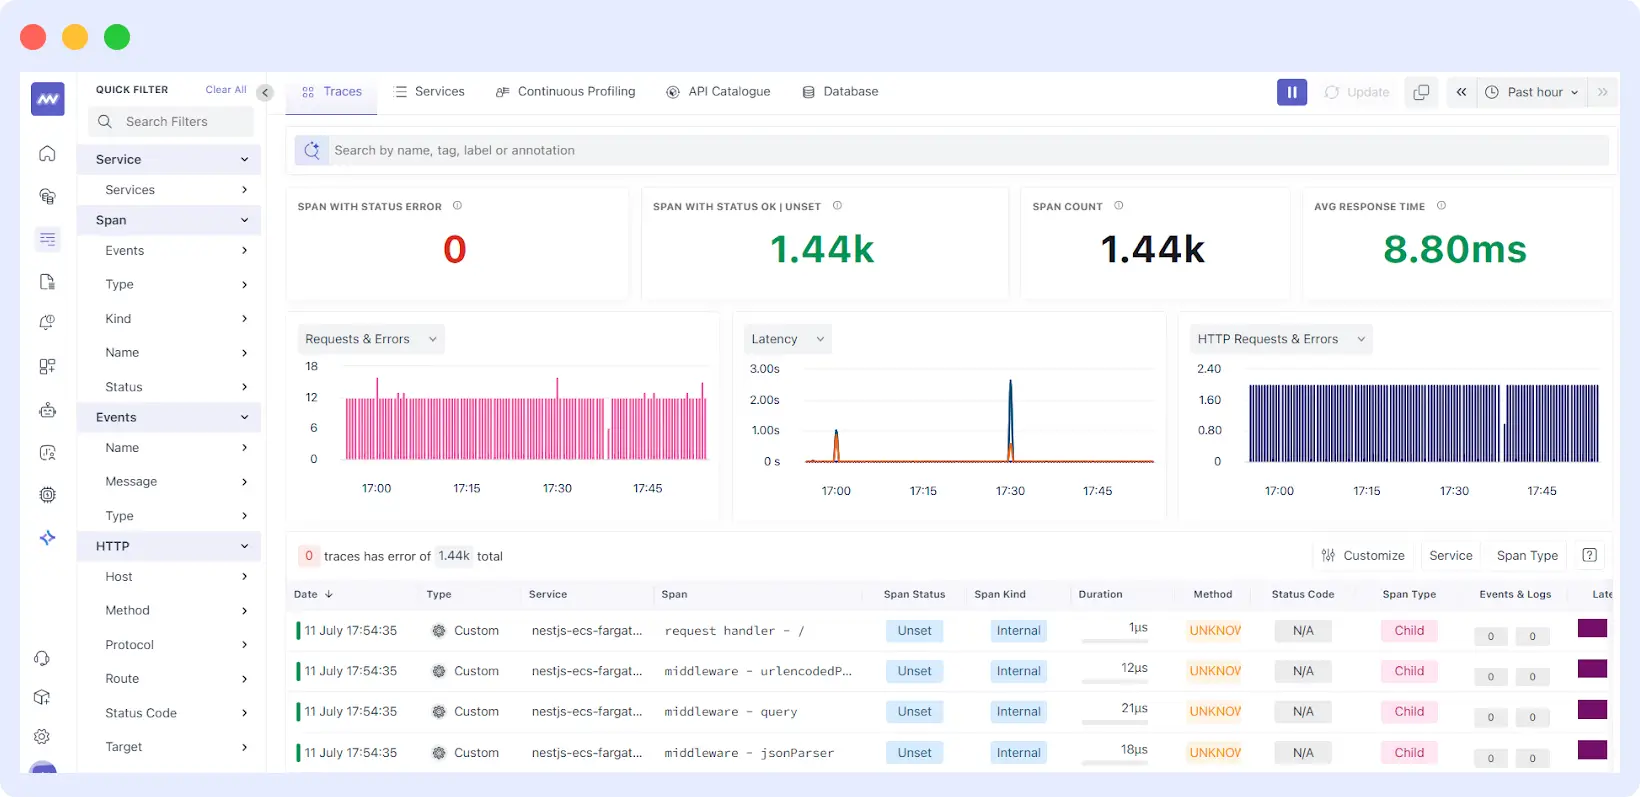
Software teams and other stakeholders can view all the relevant telemetry, data and service-to-service behavior collected across their distributed applications in a consolidated place.
Components of distributed tracing
- Trace ID: A unique identifier assigned to a request as it enters the system, used to group all related operations.
- Spans: Individual units of work within a trace, representing operations or steps taken by the system.
- Span ID: A unique identifier for each span within a trace.
- Annotations: Additional metadata added to spans, such as timestamps, error messages, or custom data.
- Tracing Library/Agent: Tools integrated into the application to capture and report trace data.
- Tracing Backend: A centralized system where trace data is collected, stored, and analyzed.
How distributed tracing is different than logging?
Both distributed tracing and logging are used to capture information on the activities in our application environments so that we can better capture low-level details and the context of the behavior under the hood.
This is especially critical when seeking to resolve various errors, faults, and performance issues. However, tracing and logging accomplish this in different ways.
For starters, logging by itself cannot capture the additional context that distributed tracing provides. Logging provides fine-grained insight into system events related to input, processing, and output. They are time-stamped events. This is especially useful for debugging and auditing. Logs can be emitted at various levels or tiers in your solution.
Logs can be generated from the infrastructure, network, and application layers and will capture a specific event that occurred in your system at a certain point in time. For example, in the context of Kubernetes, you can capture log events for occurrences in your cluster, nodes, and containers.
In contrast, distributed tracing follows the full path of a single request. It does make use of logging by recording events that happen along the path of the request being traced. Distributed tracing provides more context and simplifies the process of analysis and troubleshooting by narrowing down the search scope when issues and errors occur.
In the context of complex distributed systems like microservice architectures, generating logs is essential for the respective components that make up the system. Furthermore, as mentioned above, they provide insight into the various time-stamped events and can prove very useful when troubleshooting.
However, in conjunction with this, software teams should adopt distributed tracing platforms to capture the details of the wider context of their software solutions. Both should be part of your observability strategy to run reliable distributed software systems.
Benefits of distributed tracing
We’ve already covered the main benefits of distributed tracing to some degree. However, in this section, we’ll delve a little bit deeper into more of these benefits.
1. Automation in CI/CD
As DevOps teams rely heavily on automation, they can integrate distributed tracing into CI/CD pipelines. This way, they can identify performance regressions during the development process and address issues before they reach production.
2. Faster MTTR and MTTD
Even the best applications fail from time to time, regardless of how it’s built. But the true measure of success comes from the DevOps teams’ ability to detect issues and resolve them before it hits the bottomline.
Using this method, engineers can reduce the mean time to detect (MTTD) and mean time to resolve (MTTR) by analyzing the traces generated by the broken application, identifying the root cause of the incident, and troubleshooting it immediately.
3. Rollback and Canary Deployments
It’s a common practice in DevOps to deploy changes incrementally, such as using canary deployments. With distributed tracing, they can monitor the performance of new deployments and roll back changes if and when issues are detected.
4. Enhance team productivity
Without any observability, each service and its interaction with other services simply add to the obfuscation of the system as a whole. Distributed tracing is an important piece in observability that provides detailed and consolidated transparency for software teams to quickly trace errors when they occur and with enough context to expedite the remediation of the issues.
As a result, there’s less time dedicated to manually traversing and analyzing the system in an attempt to discover the root causes. Tracing contributes to the optimization of discovering and remediating software incidents, errors, and performance issues. In turn, software teams can be more productive and dedicate more time to enhancing their applications.
5. Improve application health
Over time, the incidents and issues contribute to a bigger backlog of undetected bugs, as well as technical debt from teams taking shortcuts to progress through a long list of issues.
Distributed tracing brings visibility and transparency to an application environment in a way that’s relevant to engineering teams. It serves as a launchpad to quickly and accurately resolve system incidents.
6. Support environment heterogeneity & flexibility
Distributed tracing platforms like Middleware are agnostic to the programming languages and frameworks used in the microservices and the underlying runtime environments.
For example, a request may start from an end-user with an Android-native mobile client, which will then pass through an Amazon API Gateway, followed by a Java-based GraphQL API reaching out to multiple other services in different cloud environments running other languages and frameworks.
The trace from start to finish and the activity in between each upstream service will be captured without disruption, despite the technical differences.
This means software teams using distributed tracing platforms can remain flexible in choosing the technologies best suited for the functions of a specific service and not be locked into a particular language or framework because of the tracing platform.
7. Bring understanding to service relationships
As mentioned in a previous point, distributed tracing provides clarity in relation to the system components and their behavior in relation to other components. When organizations adopt microservices, they typically structure their teams in one of two ways with regard to the services:
- Strong ownership – Each team is responsible for a single service
- Collective ownership – All teams have a shared responsibility over the different services in the software system
Distributed tracing platforms can be especially helpful in companies that follow a strong ownership approach to their services, so that teams can understand the activity flow for each service they don’t have ownership over.
As for collective ownership, distributed tracing can support this strategy from a normal observability approach, but more so for optimal scaling as the distributed system grows.
8. Support compliance with service level agreements (SLAs)
Several organizations have to uphold service level agreements (SLAs) with both internal and external customers or end-users to meet defined performance goals. Using a distributed tracing platform will help consolidate and aggregate data gathered from the different microservices to track performance properly.
Use Middleware to analyze, diagnose & predict issues across your entire stack.
Challenges associated with distributed tracing
Now that you know the benefits of distributed tracing, it’s important to understand the challenges associated with distributed tracing:
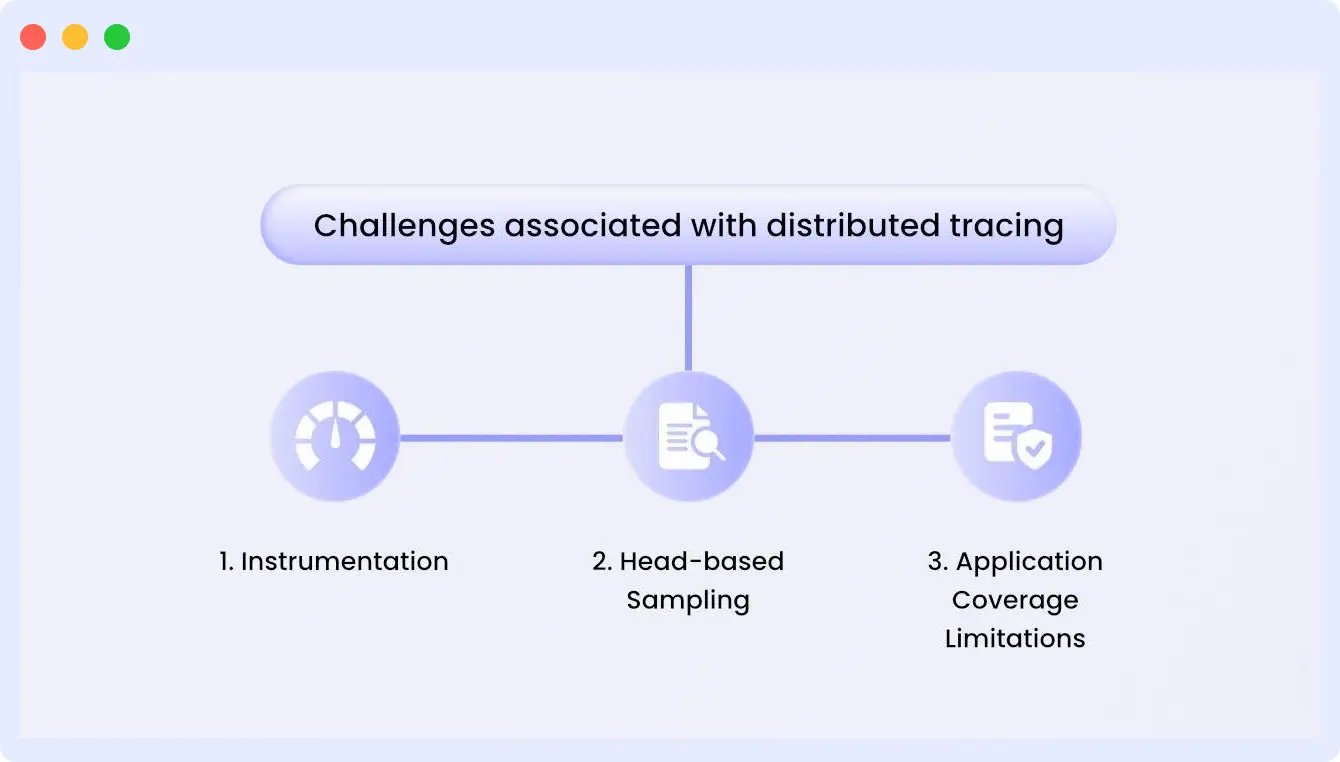
Instrumentation
A number of distributed tracing systems require you to apply changes to the source code of your applications to send trace requests. This manual approach can easily introduce errors and add to maintenance overhead. In addition, if your service is technically diverse, you need to apply the code changes based on the relevant language or framework.
Head-based sampling
Head-based sampling is a sampling decision that gets applied to a trace when it’s first initiated. In this approach, organizations can sometimes fail to capture the important or highly valuable information that they desire.
The opposite of this would be tail-based sampling. In the latter approach, you can capture complete trace information, including additional attributes such as a region or customer details.
Application coverage limitations
As pointed out in the section on how distributed tracing works, a tracing ID is generated and propagated throughout the flow or path of the request. This helps maintain the unique thread of the trace.
However, unless you are using an end-to-end distributed tracing system like Middleware, you can only trace the backend flow of your applications.
This can introduce challenges contrary to the point of tracing because software teams may not know whether errors have their root cause in the frontend (which isn’t covered by some tracing platforms) or the backend.
Open-source distributed tracing standards
With the growing need to support the main areas of observability, namely metrics, traces and logs, there’s an increasing number of open-source approaches to distributed tracing. These approaches include OpenCensus, OpenTelemetry and OpenTracing.
👉 Want to explore the best tools for implementing distributed tracing? Check out our detailed guide on distributed tracing tools.
How can Middleware help with distributed tracing?
Middleware is an AI-based observability platform that allows developers to gain end-to-end visibility into their distributed systems. This distributed tracing tool automatically begins collecting, analyzing, and contextualizing trace data from the user’s first interaction. Meaning, developers can easily monitor frontend and backend traces and correlate them with respective logs to debug the issue faster.
While most of the distributed tracing tools use a legacy-based (OpenTelemetry) approach, Middleware uses eBPF based approach for distributed tracing. This ensures easy configuration, better performance, and reduces resource consumption.
Middleware’s distributed tracing platform can help your business optimize its observability strategy and accomplish system reliability. You’ll be able to follow the network traffic flow and data across your application environments for the entire journey.
With distributed tracing, you can scale application environments with end-to-end visibility, provide clear communication, and improve the error resolution rate.
Sign up on the platform to see it in action!
What components are involved in Distributed Tracing?
Distributed tracing typically involves instrumentation libraries, trace collectors, a backend storage system, and a user interface for visualization. These components work together to track and correlate requests across services.
How is Distributed Tracing different from logging and monitoring?
Logs provide event details, while monitoring provides system-level metrics; however, distributed tracing offers context on how individual requests flow through the system. It complements logs and metrics by showing causal relationships between operations.
What are spans and traces in Distributed Tracing?
Trace represents the whole journey of a single request across services. While span represents a single unit of work (e.g., a function call or database query) within a trace, including timing and metadata.
Does Distributed Tracing impact performance?
Minimal overhead is introduced, especially with optimized tracing tools. Most modern solutions batch and compress trace data before sending it to avoid performance degradation.