Have you ever clicked on a website to watch it load as slow as snail? Or even worse, had the page bounce around jufst when you were about to tap a button? It’s pretty annoying, isn’t it? These are the kinds of problems Core Web Vitals(CWV) tries to measure and make better.
Google introduced CWV as a way to quantify user experience, focusing on three key aspects:
- How fast does the content/graphics load?
- How quickly does the page respond to interactions?
- Does the layout stay stable, or does content shift around unexpectedly?
Why should you care? Because Google does. CWV has an impact on your SEO rankings, which means a slow, unresponsive site might lead to less traffic and fewer conversions. But beyond rankings, these metrics affect real users.
A site that loads without issues and responds quickly keeps visitors interested, and interested users are more likely to convert. So how do you keep track of and how to improve core web vitals metrics?
That’s where Real User Monitoring (RUM) and Synthetic Monitoring come into play.
- Real User Monitoring (RUM) gathers real-time data from actual users, helping you understand performance across different devices, browsers, and locations.
- Synthetic Monitoring runs automated tests in controlled settings, allowing you to catch problems before users face them.
In this article, we’ll explain how these two approaches work, compare tools like Middleware, Datadog, and New Relic, and help you choose to monitor and enhance your Core Web Vitals.
What Are Core Web Vitals?
Core Web Vitals (CWV) are performance metrics that Google has established to gauge user experience on websites. These factors have a direct effect on how people view and use a website.
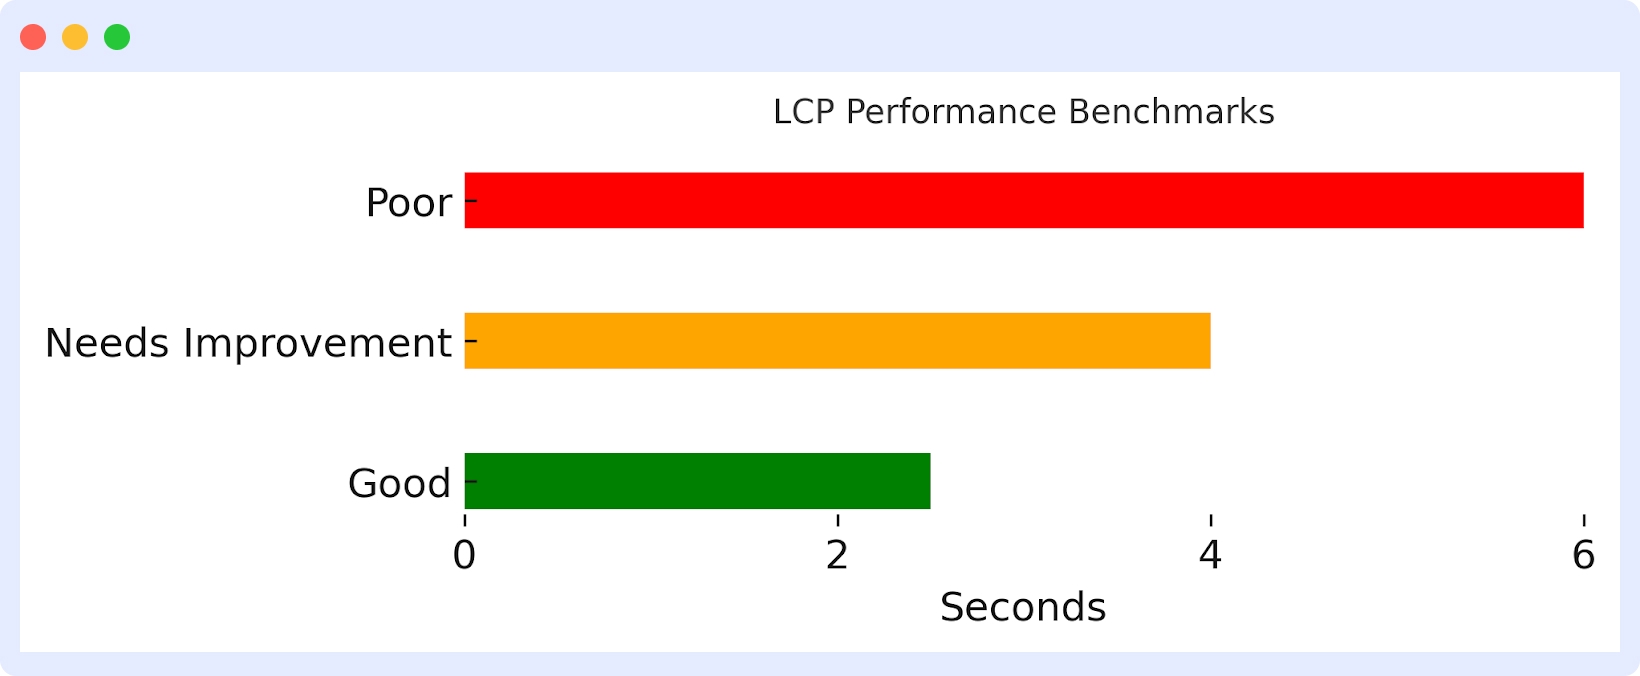
1. Largest Contentful Paint (LCP)
Largest Contentful Paint (LCP) tracks the time it takes for the largest element to be seen on a webpage—like an image, video, or block of text—to render completely. It indicates the amount of time a user sees the page as loaded and available for use and thus is a key performance metric for pages.
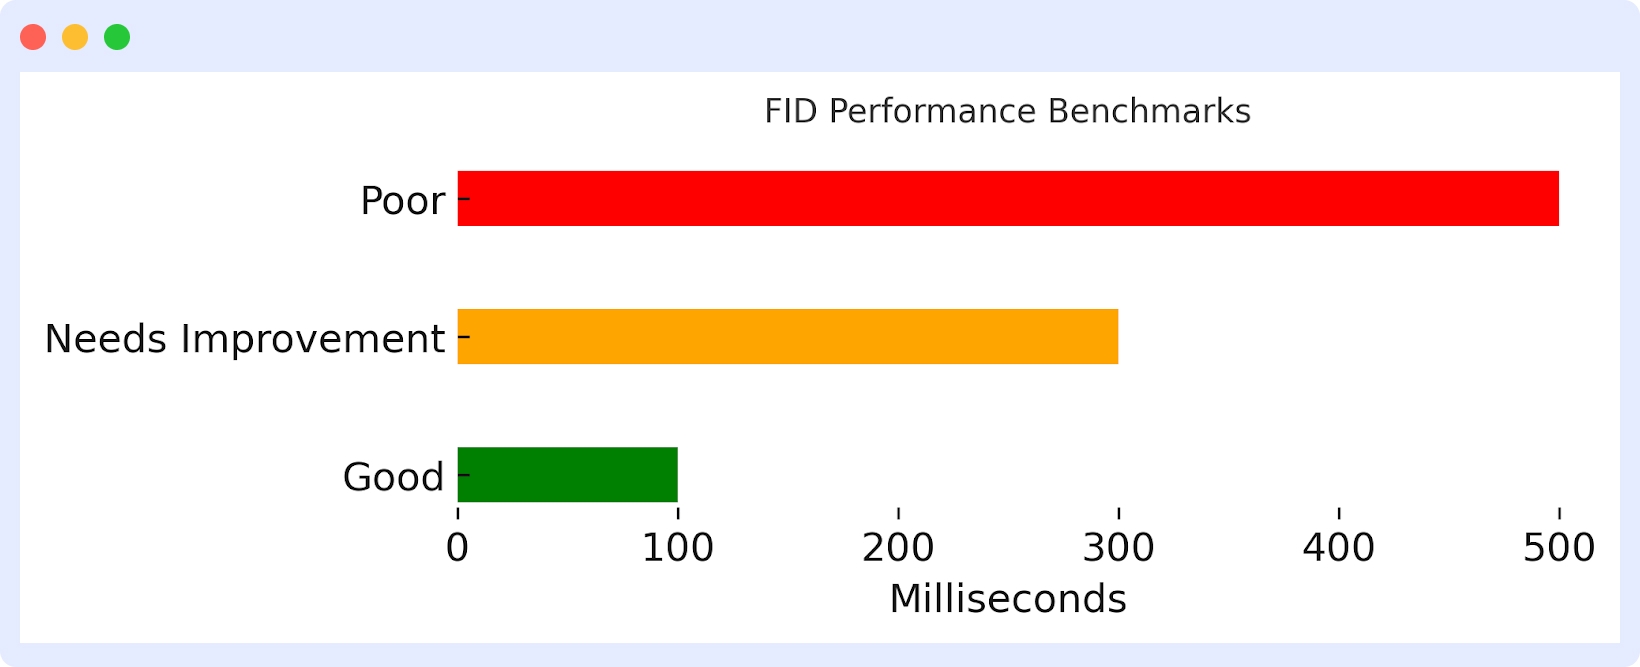
2. First Input Delay (FID)
First Input Delay (FID) calculates the time from the moment a user first interacts with a webpage (e.g., clicking on a button or link) to the time when the browser reacts. It indicates the speed at which a page becomes interactive and responds to user interaction.
In contrast to loading speed measurements such as LCP, FID directly measures interactivity, which makes it essential for user experience on dynamic pages.
3. Cumulative Layout Shift (CLS)
Cumulative Layout Shift (CLS) quantifies the visual stability of a webpage by monitoring website unexpected movement of content while loading. This movement typically happens when images, ads, or other items load asynchronously and result in text or buttons shifting unexpectedly.
How Core Web Vitals Impact User Experience, Performance, and Search Engine Rankings
Core Web Vitals—Largest Contentful Paint, First Input Delay, and Cumulative Layout Shift —are critical to measure the speed, responsiveness, and stability of a website. They have a direct impact on user satisfaction, page performance, and search engine rankings. To ensure optimal performance, it’s essential to monitor Core Web Vitals issues regularly.
Impact on User Experience
- LCP: A slow LCP makes users feel like the page is taking too long to load, leading to frustration and higher bounce rates. Users expect content to appear quickly when they land on a website.
- FID: A high FID results in unresponsive pages, where users click or tap but experience delays before anything happens. This can make a site feel laggy and unreliable.
- CLS: Unexpected layout shifts create a frustrating experience by causing text to move or buttons to jump just as users try to interact with them. This leads to accidental clicks and disrupted browsing.
Impact on Performance
- LCP: A poor LCP score often indicates slow server response times, unoptimized images, or render-blocking resources that delay content from loading.
- FID: Slow FID is usually caused by heavy JavaScript execution, where the browser is too busy processing scripts to respond to user interactions.
- CLS: High CLS scores result from elements loading unpredictably, often due to missing image dimensions, dynamically injected ads, or late-loading web fonts.
Impact on Search Engine Ranking
- LCP: Google prioritizes fast-loading websites, and a slow LCP can negatively impact search rankings by signaling poor user experience.
- FID: Since Google values real-world interactivity, a slow FID can hurt rankings, especially for interactive pages like e-commerce stores and web applications.
- CLS: Unstable page layouts can push a website lower in search results, as Google penalizes sites that provide a frustrating visual experience.
“We experienced frequent performance issues but lacked the tools to measure the extent of the degradation accurately. It was becoming increasingly harder to react to issues or, more importantly, be aware that issues were going to happen before they occurred.”
— Rangaraj Tirumala, Founding Engineer at Hotplate
Real User Monitoring (RUM) for Core Web Vitals
Real User Monitoring (RUM) is a method for monitoring performance that captures real-user behavior in real-time as users browse a site. It gives insights into user experience by capturing performance metrics from various devices, browsers, and network types.
RUM allows companies to monitor these in real-world environments. Let’s look at some of the top use cases RUM can solve:
Identifying Performance Bottlenecks in Real-Time
The performance of a website can differ according to device type, internet speed, and geography. A page may load quickly in one region but experience delays elsewhere due to high server response times or unoptimized media files. How RUM can:
- Tracks LCP scores in various user environments.
- Identify slow-loading elements/graphics such as large images or videos.
- Helps teams optimize assets (e.g., compressing images, using a CDN) to improve load times and engagement.
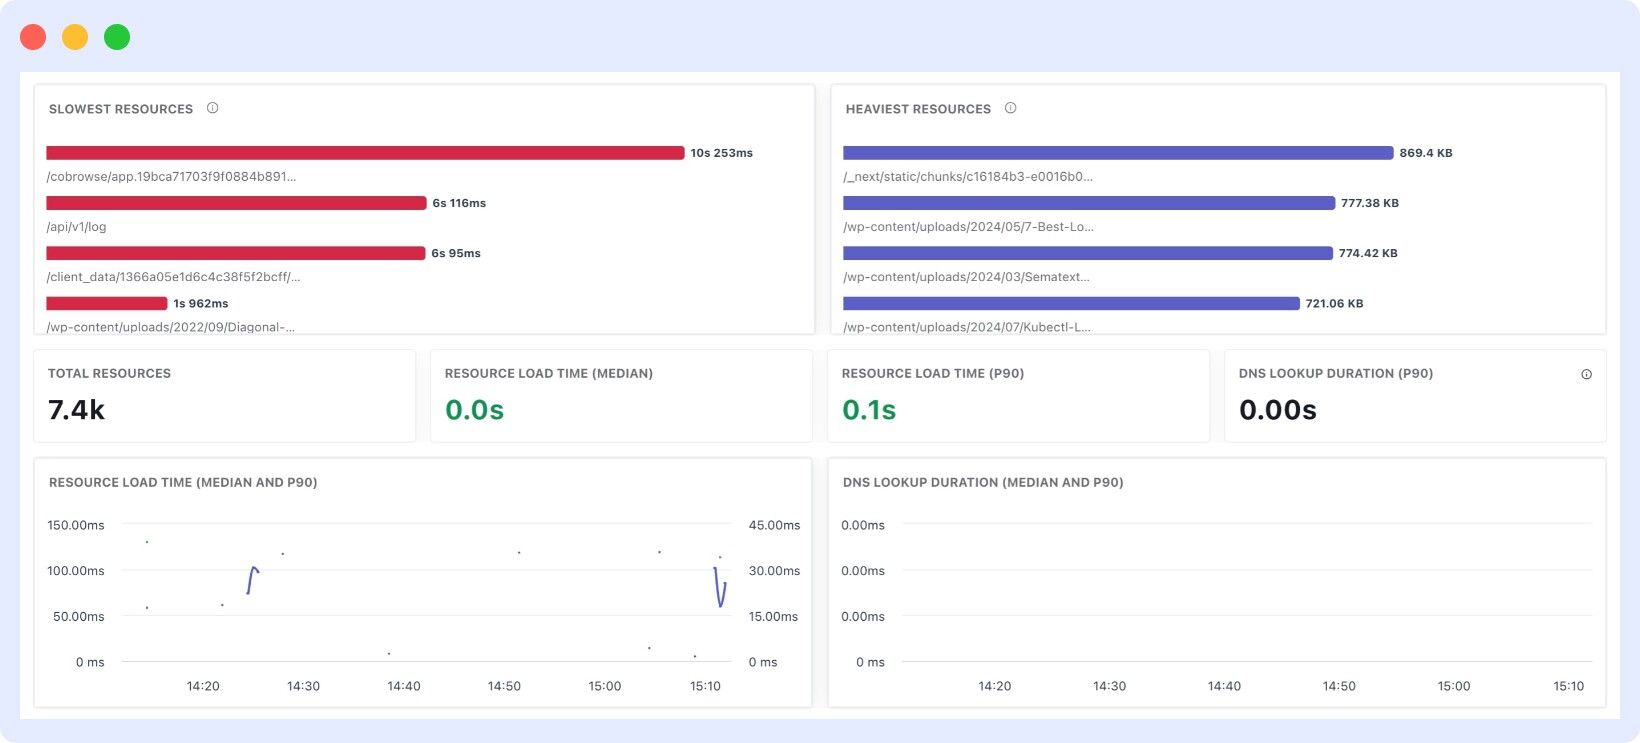
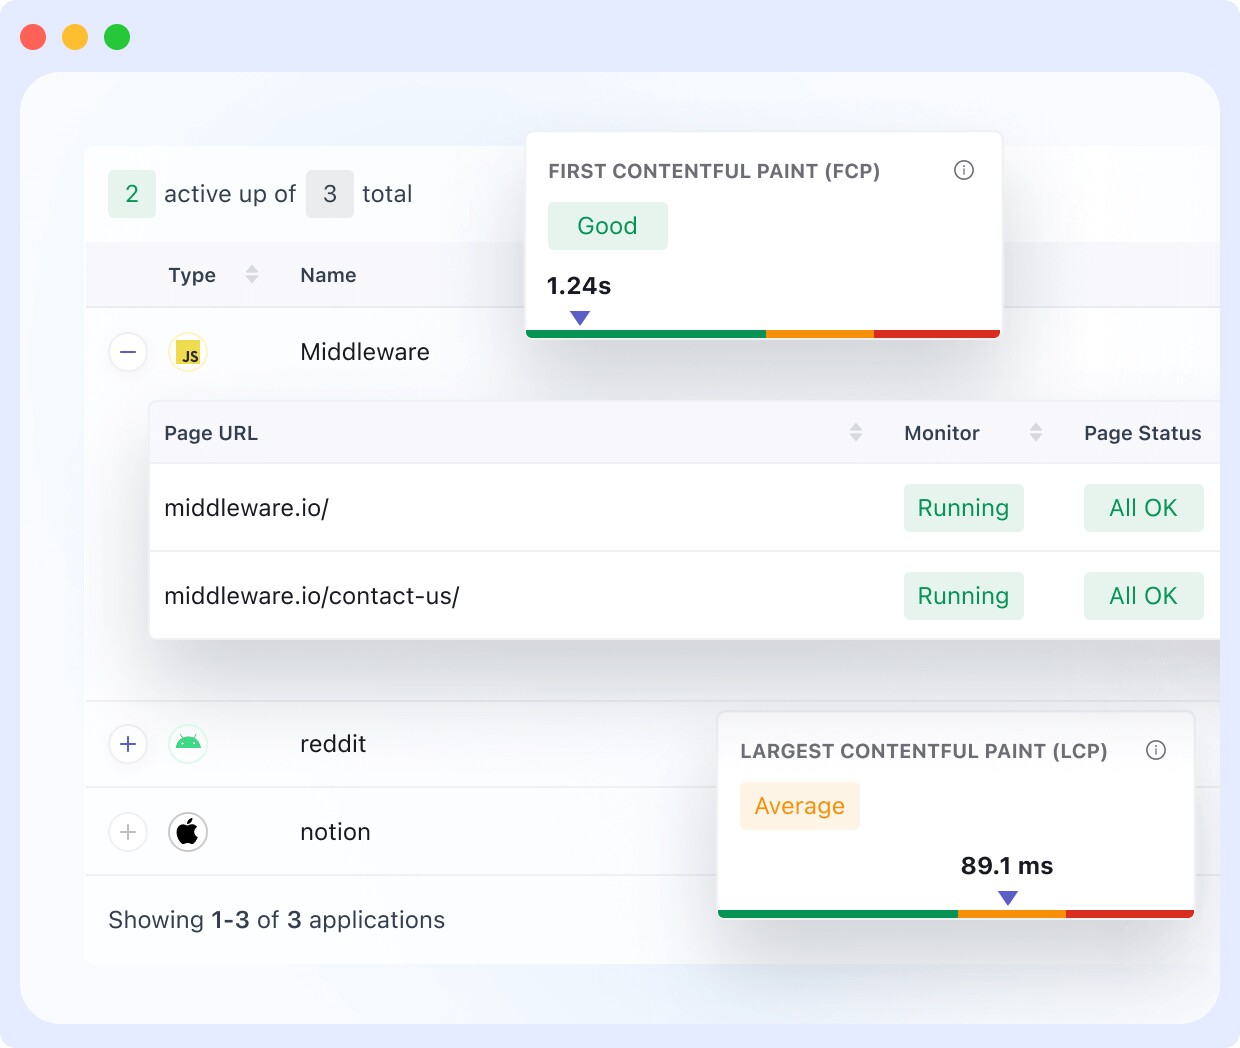
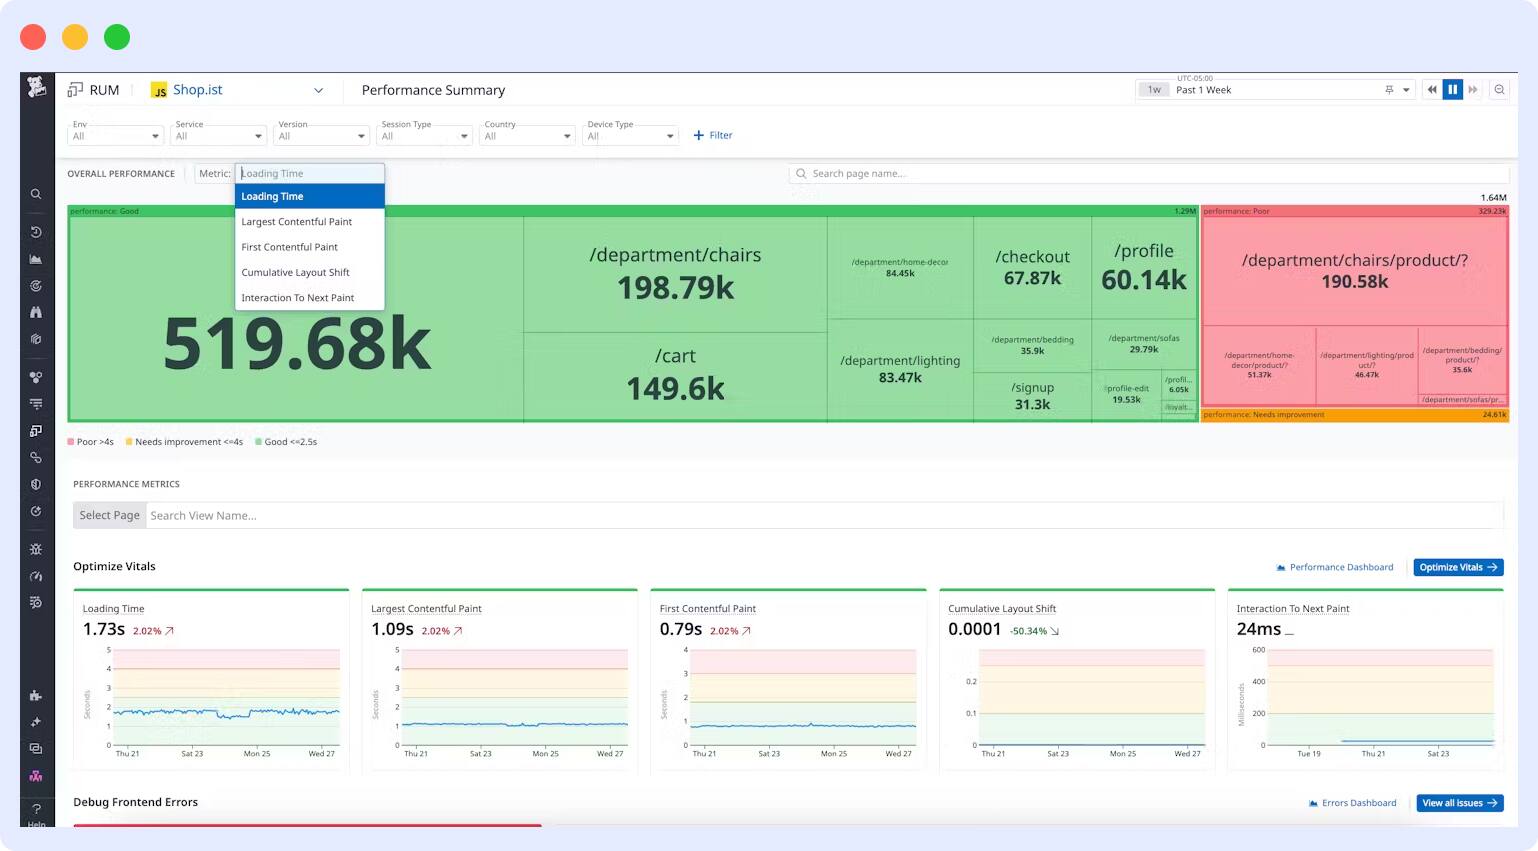
In the above image, you can see how Middleware’s dashboard provides insights into resource performance, displaying the slowest and heaviest resources impacting page load.
It helps teams identify bottlenecks by showing resource load times, DNS lookup durations, and real-time performance trends. This enables proactive optimization before issues affect users.
Identifying Poor Interactivity (FID) because of JavaScript Delays
A page might seem to load completely, yet delays in responding when buttons or links are clicked. High FID scores often result from long-running JavaScript execution, which blocks user interactions. How RUM Helps:
- Monitors FID scores and identifies where user interactions are being delayed.
- Highlights heavy JavaScript tasks causing unresponsive pages.
- Helps developers optimize code by deferring non-essential JavaScript and reducing execution time.
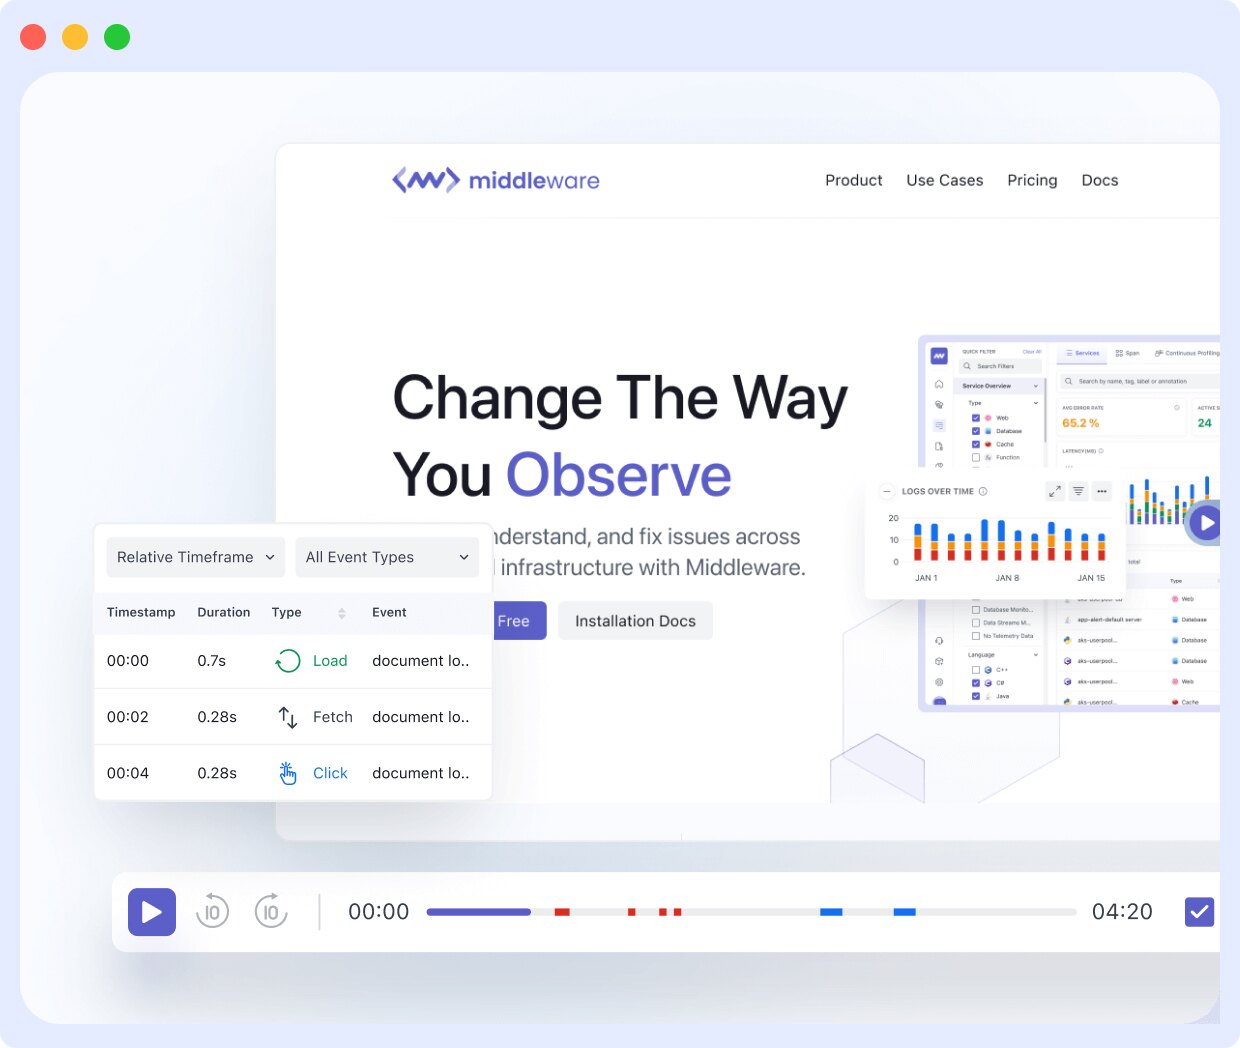
Middleware session replays allow teams to analyze slow interactions, helping identify JavaScript bottlenecks affecting FID. By visually tracing user sessions, teams can pinpoint performance issues in real-time, making it easier to debug and optimize the user experience.
As of today, Middleware’s RUM manages over 1.5 million sessions per month for Hotplate.
“We had an issue where an order’s cart was associated with the wrong event, creating a conflict in our database. Using Middleware’s session replay, we quickly identified that an unchecked front-end component allowed users to create garbage data. This allowed us to resolve the issue quickly.”
Rangaraj Tirumala, Founding Engineer at Hotplate
Fixing Layout Instability (CLS) Affecting Conversions
Unexpected content shifts frustrate users, leading to misclicks and lower conversions. Common causes include images without dimensions, dynamic ads, and injected content that loads after the page is visible. With RUM Helps:
- Tracks CLS scores to identify visual instability.
- Identifies elements that shift unexpectedly during loading.
- Aids teams in correcting problems by specifying image sizes, holding ad space, and employing CSS animations for smooth transitions.
RUM Tools for Core Web Vitals Monitoring
Several platforms provide RUM solutions for monitoring Core Web Vitals. Here are some of the top options:
Middleware
Middleware is a monitoring platform that specializes in complex, multi-tiered applications. It provides dynamic insights into user interactions, facilitating optimal web and mobile application performance.
- Monitors native Android, iOS, and React Native mobile applications
- Track Core Web Vitals in real time to identify performance issues
- Provides session replays for analyzing user interactions
- Links front-end performance with back-end traces for better debugging
Datadog
Datadog Real User Monitoring (RUM) delivers in-depth visibility into web and mobile application performance, enabling real-time tracking of user journeys and experiences to identify and resolve issues efficiently.
- Tracks Core Web Vitals like LCP, FID, and CLS across multiple devices
- Monitor usage patterns, record business-critical user behavior, and enrich user sessions with custom attributes to inform data-driven optimizations.
- Track frontend performance with pre-built, customizable dashboards, streamlined troubleshooting workflows, and real-time alerts to enhance page performance.
New Relic
New Relic is a cloud-based observability platform that provides real-time monitoring for software applications, infrastructure monitoring, and user experiences.
- Uses AI-powered insights to detect and resolve issues
- Provides in-depth analytics on frontend performance
- Supports multi-device and cross-browser monitoring
Synthetic Monitoring for Core Web Vitals
Synthetic Monitoring is a performance testing approach that simulates user interactions in a controlled environment. Unlike Real User Monitoring (RUM), which collects data from actual users, Synthetic Monitoring runs predefined tests on websites from different locations, browsers, and devices.
Synthetic Monitoring helps detect potential performance issues before they affect real users.
Detecting Performance Issues Before They Affect Users
Website performance can degrade due to code changes, third-party scripts, or server issues. It is vital to find problems before they become visible to real users.
- Runs automated tests at scheduled intervals to detect slowdowns.
- Simulates user journeys, such as logging in, adding items to a cart, or completing transactions.
- Helps businesses catch issues caused by recent deployments or external API failures before they impact real visitors.
Benchmarking and Comparing Performance Over Time
Websites evolve with design updates, feature additions, and infrastructure changes. Tracking how these changes impact performance is essential. How Synthetic Monitoring Helps:
- Provides consistent, repeatable performance measurements.
- Assists teams in comparing performance before and after a site update.
- Eliminates real-world inconsistencies like network congestion or device differences, ensuring reliable comparisons.
Testing Performance Across Different Locations and Devices
Users visit sites from multiple regions, devices, and browsers, and performance varies widely depending on these parameters. How Synthetic Monitoring Helps:
- Simulates visits from different geographic locations to measure global performance.
- Checks how websites perform on various browsers (Chrome, Firefox, Safari) and devices (mobile, desktop, tablet).
- Assists businesses in optimizing page speed for international users by detecting regional slowdowns.
Proactive Alerts and Incident Detection
Downtime or performance degradation can lead to lost revenue and frustrated users. Early detection helps teams fix issues before they escalate.
- Provides real-time alerts when Core Web Vitals degrade.
- Helps teams troubleshoot issues before users notice them.
- Simulates high-traffic conditions to test how the site performs under load.
Synthetic Monitoring Tools for Core Web Vitals
Middleware
Middleware’s Synthetic Monitoring replicates real-world traffic to detect performance issues before they affect users. It helps optimize user flows with proactive testing and real-time alerts.
- Monitors API performance and detects downtime
- Provides detailed response time analysis
- Offers end-to-end test suites for comprehensive monitoring
Datadog
Datadog Synthetic Monitoring enables browser-based testing to track Core Web Vitals and simulate user interactions across various locations and devices.
- Identifies performance bottlenecks and optimizes page load times
- Mimics real user behavior for accurate performance analysis
- Ensures a smooth user experience with automated testing
New Relic
New Relic’s Synthetic Monitoring simulates user journeys to measure key Core Web Vitals like LCP, FID, and CLS, ensuring optimal performance.
- Detects issues proactively before they impact real users
- Sends real-time alerts for performance degradation
- Captures and analyzes user interactions for optimization
Comparing RUM and Synthetic Monitoring
When it comes to tracking Core Web Vitals (CWV) and optimizing website performance, both Real User Monitoring and Synthetic Monitoring play crucial roles.
While RUM provides real-world insights from actual users, Synthetic Monitoring offers controlled, repeatable synthetic testing in different environments. Understanding their differences can help businesses choose the right tool—or a combination of both—for effective performance monitoring.
| Scenario | Best Choice | Why |
| Understanding real-world user experience | RUM | Captures actual user data, including network, device, and location variations. |
| Testing before a site goes live | Synthetic Monitoring | Runs controlled tests in a pre-production environment to catch issues early. |
| Detecting performance regressions | Synthetic Monitoring | Ensures consistent testing after code deployments to prevent slowdowns. |
| Optimizing for SEO and Core Web Vitals | RUM | Provides real-world CWV metrics (LCP, FID, CLS), which impact Google rankings. |
| Ensuring uptime and availability | Synthetic Monitoring | Continuously checks site availability, even without user traffic. |
| Benchmarking long-term performance | Both | RUM tracks real-user trends, while Synthetic Monitoring ensures controlled consistency. |
Key Takeaways:
- RUM is best for real-world insights, user experience tracking, and Core Web Vitals optimization.
- Synthetic Monitoring is ideal for proactive testing, uptime monitoring, and performance consistency.
- A combination of both provides a well-rounded approach to tracking and improving site performance.
Best Practices for Monitoring Core Web Vitals
- Combine RUM and Synthetic Monitoring to get a complete picture of performance. Use RUM to track real-world user experiences and Synthetic Monitoring to simulate user interactions in a controlled environment.
- Set clear benchmarks for CWV performance based on Google’s recommendations. Aim for LCP under 2.5s, FID under 100ms, and CLS under 0.1.
- Use automated alerts and thresholds to detect performance issues early. Configure alerts when CWV metrics deviate beyond acceptable limits, ensuring proactive performance management before user experience is impacted.
- Integrate with other monitoring and analytics tools like Google Search Console, PageSpeed Insights, and APM tools such as Middleware, Datadog or New Relic. These integrations provide deeper insights into both frontend and backend performance.
- Optimize continuously based on insights from both monitoring types. Address slow LCP by optimizing images and server response times, reduce FID by minimizing JavaScript execution, and improve CLS by ensuring stable UI elements.
Conclusion
Monitoring Core Web Vitals is essential for ensuring a smooth user experience and maintaining strong SEO rankings. By tracking LCP, FID, and CLS, businesses can identify performance bottlenecks and optimize their websites for better engagement and conversions.
To achieve the best results, combining RUM for real-world insights and Synthetic Monitoring for controlled testing provides a well-rounded strategy. Moving forward, teams should continuously analyze their CWV data, fine-tune performance optimizations, and integrate monitoring with other analytics tools to stay ahead of performance issues.
How to monitor core web vitals issues?
To monitor Core Web Vitals issues, use Google Search Console for reports, PageSpeed Insights for page analysis, and Lighthouse in Chrome DevTools for audits. The Web Vitals Chrome Extension provides real-time insights, while tools like Middleware.io, New Relic, and Datadog offer continuous monitoring for performance optimization.
What is lcp in core web vitals?
Largest Contentful Paint (LCP) is a Core Web Vitals metric that measures how long it takes for the largest visible content element (like an image or text block) to load and become visible to users. A good LCP score is under 2.5 seconds, ensuring a fast and smooth user experience. You can track LCP using Google Search Console, PageSpeed Insights, and Lighthouse.
How to fix core web vitals issues?
Improve Largest Contentful Paint (LCP) by optimizing images, using a fast server, and enabling lazy loading. Fix First Input Delay (FID) by minimizing JavaScript execution and using browser caching. Improve Cumulative Layout Shift (CLS) by setting size attributes for images and avoiding dynamic content shifts. Regular RUM and synthetic monitoring and optimization ensure better performance.
Do core web vitals affect SEO?
Yes, Core Web Vitals do impact SEO. Google considers core web vitals a ranking factor as part of the page experience signals, meaning sites with good scores are more likely to rank higher. If your site loads slowly, shifts content unexpectedly, or has delayed interactions, users may leave, increasing bounce rates and lowering rankings. Fixing these issues can improve both the user experience and search performance.


