
Summary: The best APM tools in 2026 are Middleware, Datadog, New Relic, Dynatrace, Grafana Cloud, AppDynamics, SigNoz, Elastic Observability, Instana, and Honeycomb. Middleware and SigNoz lead on OpenTelemetry-native, cost-predictable monitoring, Datadog and New Relic lead on integration breadth, Dynatrace leads on AI-driven root cause analysis for large enterprise estates, and Instana and Honeycomb serve two specialist needs: fully automated Kubernetes discovery and high-cardinality trace debugging. The right pick depends less on features than on your pricing model and your stack, see the comparison table below for a fast answer.
TL;DR
- Middleware, Datadog, New Relic, Dynatrace, Grafana Cloud, AppDynamics, SigNoz, Elastic Observability, Instana, and Honeycomb are the ten APM platforms worth evaluating in 2026.
- Pricing splits into two models: per-host (Datadog, Dynatrace, AppDynamics) that scales with infrastructure size, and per-GB (Middleware, New Relic, Grafana Cloud) that scales with data volume. Pick based on how your environment grows, not on the sticker price.
- Pricing splits into three models: per-host (Datadog, Dynatrace, AppDynamics, Instana) that scales with infrastructure size, per-GB (Middleware, New Relic, Grafana Cloud) that scales with data volume, and event-based (Honeycomb) that scales with trace volume regardless of host count. Pick based on how your environment grows, not on the sticker price.
- For Kubernetes and containerized workloads, prioritize OpenTelemetry-native tools (Middleware, SigNoz, Grafana Cloud), auto-instrumentation, and per-pod visibility over a proprietary agent per language.
- AI-driven root cause analysis is now a baseline feature across the category, not a differentiator. What separates tools is whether the AI reduces alert noise or just adds another dashboard to check.
- Distributed tracing depth and log-metric-trace correlation are the two capabilities that most directly cut mean time to resolution (MTTR) in microservices environments, weigh these more heavily than integration count.
This is a comparison guide, not a general explainer. It ranks the ten leading APM platforms head to head on pricing model, standout strength, limitation, and best fit, then breaks down what actually separates them on Kubernetes support, distributed tracing depth, and AI-driven root cause analysis, the three areas where the category differs most in practice.
What are APM tools?
APM tools are software products that implement application performance monitoring: they instrument your code and infrastructure, collect metrics, logs, and traces, and surface that telemetry through dashboards, alerting, and root cause analysis so engineers can catch and fix problems before they affect customers.
In practical terms, APM actively monitors web application speed and performance from both user-facing and backend perspectives. This data is meticulously analyzed to pinpoint potential issues and bottlenecks, facilitating issue resolution and enhancing the user experience.
New to Application Performance Monitoring? Learn how APM works, the metrics it tracks, and why it’s essential for modern applications. Learn About APM
What are the best APM tools in 2026?
Here is how the ten leading APM platforms compare on pricing model, standout strength, main limitation, and who each one fits best.
| Tool | Pricing model | Strength | Limitation | Best fit |
|---|---|---|---|---|
| Middleware | Pay-as-you-go, $0.30/GB across metrics, logs, and traces; 14-day free trial with unlimited ingestion | Unified metrics, logs, and traces in one view; OpenTelemetry native; predictable per-GB pricing with no per-host surprises | Smaller integration catalog than Datadog or New Relic | Teams that want Datadog-level visibility without host-based billing surprises |
| Datadog | Per host: APM $31/host/mo (Pro $35, Enterprise $40), requires paired Infrastructure plan | 1,000+ integrations, mature UI, strong service mapping | Costs compound quickly across Infrastructure, APM, logs, and RUM; not open-source, no self-hosting | Large teams that want one vendor for everything and can absorb per-product billing |
| New Relic | Usage-based: 100GB/month free, then $0.40/GB (Data Plus $0.60/GB), plus per-user fees for full platform access | Single ingest-based meter instead of per-host; strong AI-assisted root cause tooling | Full platform user fees add up fast for teams that need broad access | Teams that prefer a data-volume pricing model over host counting |
| Dynatrace | Consumption-based DPS: Full-Stack Monitoring around $58 per 8GB host/month, bundles APM, infra, and RUM | Davis AI gives automatic, causal root cause analysis with minimal manual configuration | Highest list price in the category; bundled model removes the option to start small | Large enterprises with complex, high-scale environments and dedicated observability budget |
| Grafana Cloud | Free tier: 10,000 metric series, 50GB logs and traces; Pro from $19/month plus usage | Most generous free tier in the category; fully open-source foundation (Mimir, Loki, Tempo) | Less turnkey than proprietary APM tools; requires PromQL and labeling discipline to avoid cost spikes | Teams already on Prometheus and OpenTelemetry who want to avoid vendor lock-in |
| AppDynamics | Per application agent, roughly $33/agent on Pro tier (Cisco channel discounts common) | Strong business-transaction correlation and end-user impact scoring | Complex setup; less suited to small teams due to cost | Enterprises already standardized on Cisco infrastructure |
| SigNoz | Usage-based on data ingestion and retention, no per-user charges; open-source self-hosted option available | OpenTelemetry native, single ClickHouse backend for unified metrics, logs, and traces | Smaller ecosystem and community than the incumbents; fewer built-in integrations | Engineering-led teams comfortable running or evaluating an open-source stack |
| Elastic Observability | Starts around $16/host/month (cloud-hosted) | Search-driven approach; strong for teams already using the Elastic Stack for logs | Less intuitive for teams new to Elasticsearch; costs scale with data volume and retention | Teams with existing ELK/Elastic investment wanting to extend into APM |
| Instana | Per host: Essentials ~$21.20/host/month, Standard ~$79.50/host/month (10-host minimum, billed annually) | Fully automated, zero-config discovery with 1-second metric granularity; all features included per tier, no separate charges for custom metrics or logging | 10-host minimum commitment; per-host model gets expensive fast on high pod-density Kubernetes clusters | Enterprises that want hands-off, automatic instrumentation across large, complex Kubernetes estates |
| Honeycomb | Event-based: free to 20M events/month, Pro from $130 per 100M events up to 1.5B events/month | Built for high-cardinality debugging, not dashboards; BubbleUp analysis surfaces the exact dimension causing an anomaly | Not a traditional full-stack APM; less suited to teams that want out-of-the-box dashboards and alerting | Engineering teams debugging complex distributed systems who need to slice traces by arbitrary high-cardinality fields |
Note: Pricing reflects publicly listed rates as of mid-2026 and is subject to frequent changes. Confirm current numbers directly with each vendor before budgeting.
Fast path to a decision:
- If pricing predictability matters most, compare Middleware and Grafana Cloud, both scale with data volume, not host count.
- If you need the broadest integration catalog and can absorb per-host billing, Datadog wins.
- If automatic causal root cause analysis matters more than cost, Dynatrace’s Davis AI is the strongest in the category.
- If you need to translate incidents into business-impact language for non-technical stakeholders, AppDynamics is built for that.
- If you already run Elasticsearch for logs, extend into Elastic Observability rather than adopting a second tool.
- If you want fully automated Kubernetes discovery with zero manual tagging, Instana is built for that.
- If your bottleneck is debugging complex distributed traces with high-cardinality data, Honeycomb is purpose-built for that, not for general dashboards.
1. Middleware APM
Middleware APM is a unified observability platform built on OpenTelemetry, giving teams metrics, logs, and traces in a single dashboard with a one-minute, single-script install.
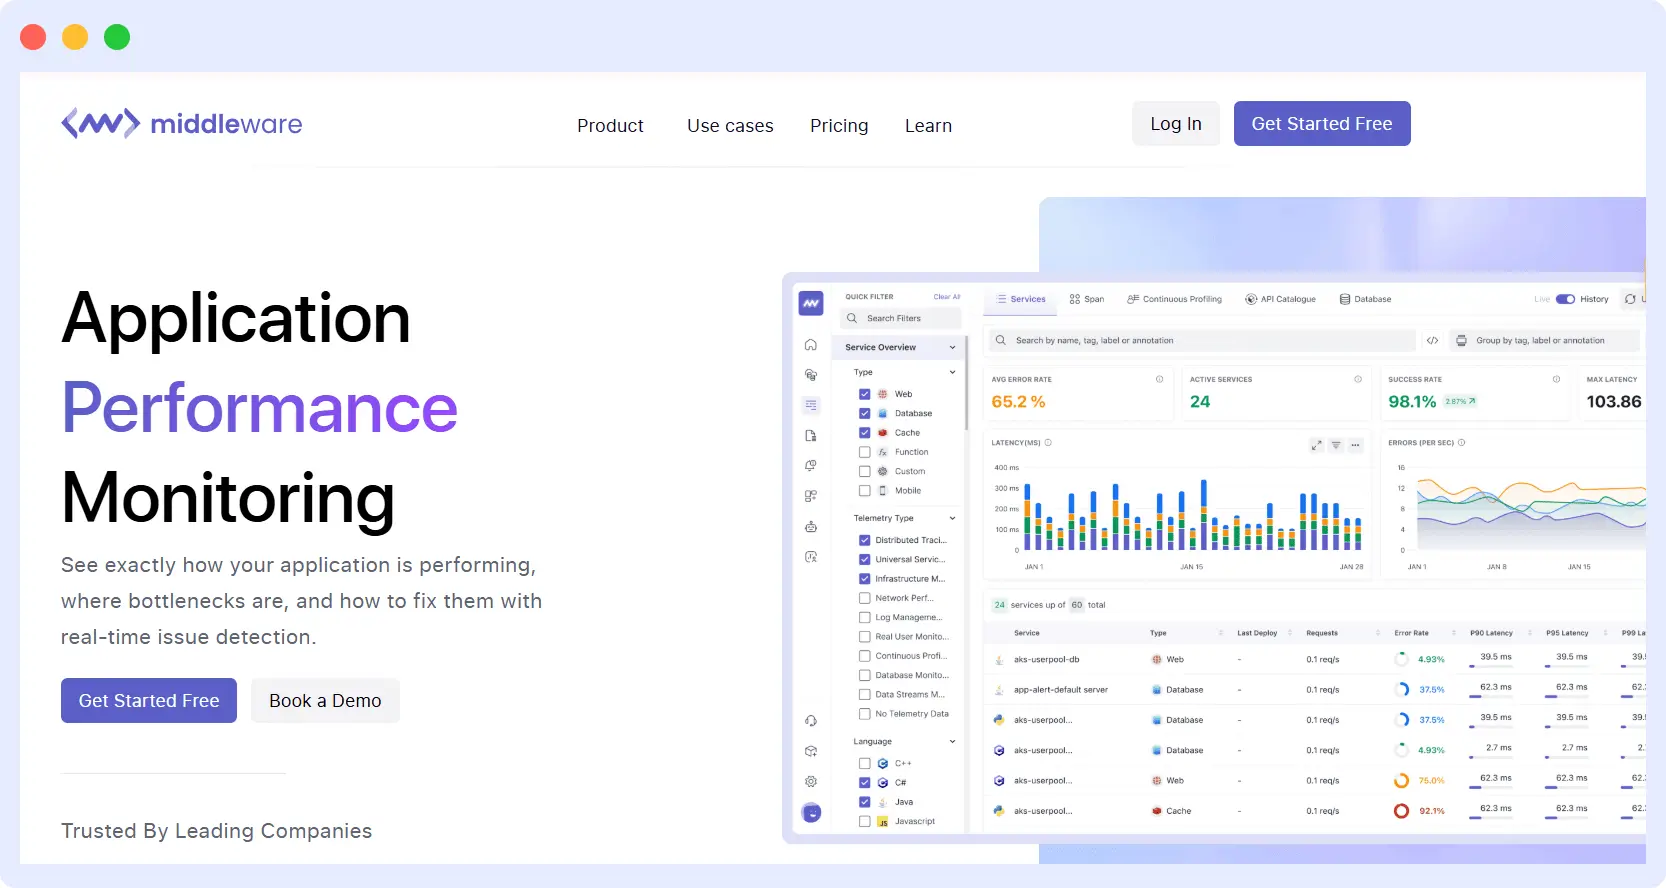
It was built to fix the two complaints engineers raise most about legacy APM tools: fragmented tooling across separate products, and unpredictable host-based bills that scale faster than infrastructure actually grows. Because it ingests any OpenTelemetry-instrumented service natively, teams switching from a proprietary agent don’t need to re-instrument their code to get started.
Key Features
- End-to-end distributed tracing that follows a single request across every service it touches
- 450+ built-in integrations spanning cloud providers, databases, message queues, and CI/CD tools
- A single unified dashboard that correlates metrics, logs, and traces instead of three separate views
- LLM observability for tracking prompt performance, token usage, and cost across AI workloads
- Continuous profiling that pinpoints the exact function or line of code consuming CPU or memory
- OpsAI, an SRE agent that investigates and resolves incidents automatically without manual triage
Pros
- GDPR, CCPA, and SOC 2 compliant.
- One-minute installation.
- Customized SQL query generation.
- 24/7 support via email, chat, and call.
- Unified view reducing issue identification time.
- Real-time data collection, storage, and analysis across various systems.
- Focuses on identifying the root cause of issues.
- Selective analysis of performance data for specific timeframes.
Cons
A smaller integration catalog than Datadog or New Relic, though native OpenTelemetry auto-instrumentation covers most modern Kubernetes and microservices stacks without a proprietary agent.
Best for
Engineering teams on Kubernetes or containerized infrastructure who have been burned by a surprise per-host bill and want cost that tracks data volume instead.
Pricing
14-day free trial with unlimited ingestion, then $0.30/GB pay-as-you-go. Enterprise plans support on-premises and BYOC deployment.
Looking for an all-in-one observability platform? Monitor applications, infrastructure, logs, metrics, and traces from a single platform. Start Free Trial
2. Datadog
Datadog is the largest observability suite by integration count, pairing APM with infrastructure monitoring, logs, RUM, and synthetics under a single login and a mature, heavily-documented UI.
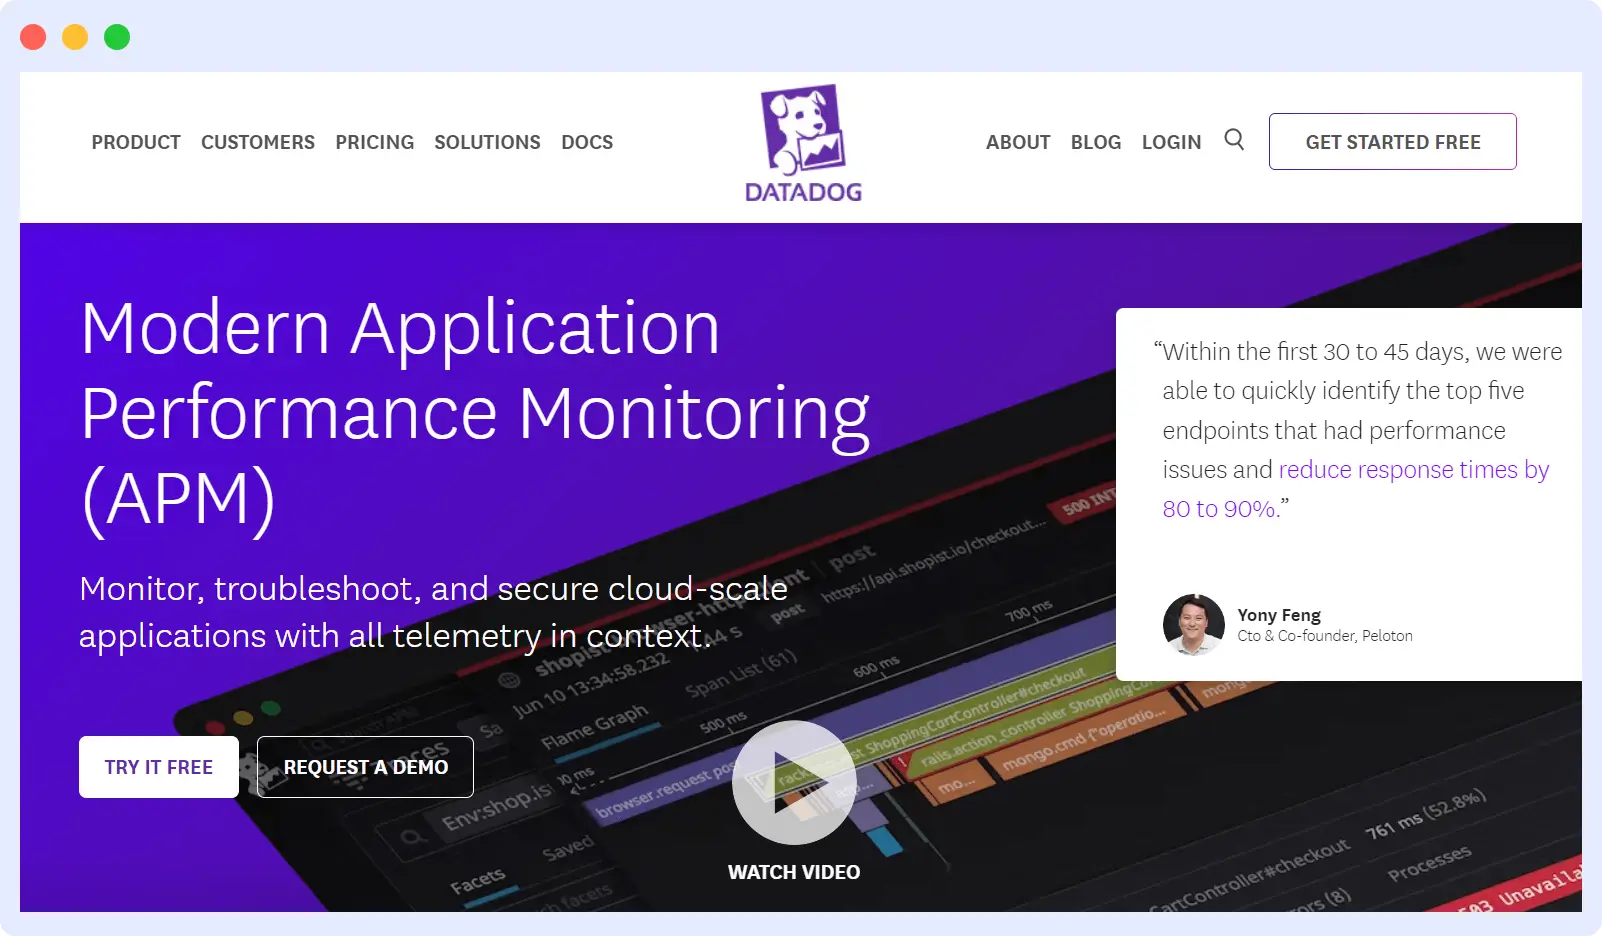
What started as an infrastructure monitoring tool has grown into a broad security and observability platform used across tens of thousands of companies, with a dedicated module for nearly every layer of a modern stack. That breadth is also the source of its pricing complexity, since each module (Infrastructure, APM, Logs, RUM, Security) bills independently and stacks on top of the others.
Key Features
- 1,000+ built-in integrations covering cloud providers, databases, CI/CD tools, and AI platforms
- Real-time trace search that lets engineers query live traces across the entire request path
- Real user monitoring and synthetic testing to catch frontend issues before customers do
- Service dependency mapping that visualizes how every service in the stack connects
- AI observability for LLM providers and vector databases like OpenAI, Anthropic, and Weaviate
- Cloud security monitoring built into the same platform as APM, not a separate product
Pros
- The most mature UI in the category, backed by over a decade of documentation, tutorials, and a large community
- One login covers infrastructure, APM, logs, RUM, and security, so teams don’t stitch together separate vendors
- The widest technology partner ecosystem in the category, so almost any tool in a modern stack has a pre-built integration
- Deep service dependency mapping that shows how an incident in one service ripples through the rest of the system
Cons
Every APM host requires a paired Infrastructure plan, so real-world cost typically runs closer to $46+/host/month once both are added, well above the advertised $31 starting price.
Best for
Enterprises with the budget and dedicated headcount to manage per-product billing across several Datadog modules at once.
Pricing
APM from $31/host/month (Pro $35, Enterprise $40), plus a required Infrastructure plan. See how Middleware compares as a Datadog alternative.
3. New Relic APM
New Relic is a full-stack observability tool billed by data ingested rather than hosts monitored, with the largest perpetual free tier in the category. It consolidates APM, infrastructure, logs, browser, and mobile monitoring into a single ingest-based meter, so a team’s bill tracks telemetry volume rather than server count.
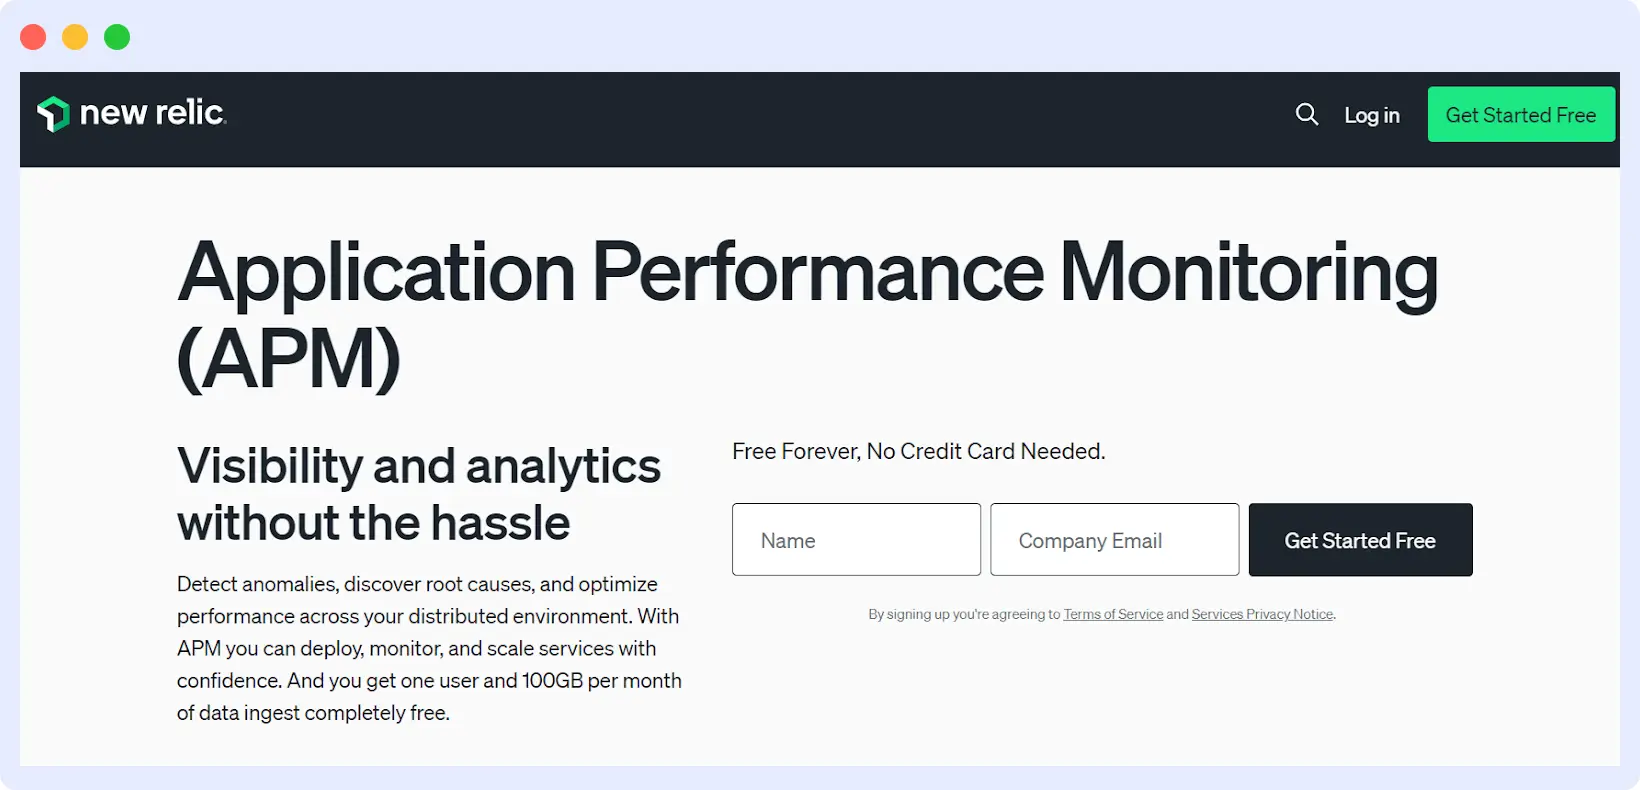
New Relic pioneered this shift away from per-host billing back in 2020, and that pricing model remains its main differentiator against Datadog and Dynatrace today.
Key Features
- Response time, error rate, and cross-application tracing across the full request path
- Native agent support for Java, Python, PHP, Ruby, and .NET applications
- 780+ integrations spanning cloud, infrastructure, and third-party services
- New Relic AI, a natural-language assistant for querying telemetry without writing NRQL
- Intelligent Observability capabilities including Transaction 360 and Security RX
- A single ingest-based data model that unifies metrics, logs, traces, and events
Pros
- A genuinely perpetual free tier (100GB/month), not a time-limited trial, so small teams can run indefinitely at no cost
- Billing tracks data volume instead of host count, so autoscaling or serverless workloads don’t inflate the bill just by scaling
- AI-assisted root cause inference that narrows down likely causes instead of leaving engineers to read raw telemetry
- A single ingest-based meter that’s simpler to forecast than juggling separate per-product pricing lines
Cons
Full platform access requires separate per-user licensing on top of data costs, $49/month for Core users up to $349 to $419/month for Full Platform users, which adds up quickly for teams needing broad seat access.
Best for
Teams with unpredictable infrastructure footprints but a small, well-defined group of engineers who need full platform access.
Pricing
Free up to 100GB/month, then $0.40/GB (Data Plus $0.60/GB), plus per-user licensing. See how Middleware compares as a New Relic alternative.
4. Dynatrace
Dynatrace is an enterprise APM suite built around Davis AI, a causal root-cause engine that maps dependencies and points to a probable cause automatically, without manual dashboard building. OneAgent, its single automatic instrumentation agent, discovers hosts, processes, and services without per-language setup, and everything it collects flows into Grail, Dynatrace’s unified data lakehouse for logs, metrics, traces, and security data. It’s built for large, fast-changing environments where manually correlating telemetry across thousands of services isn’t realistic for a human team.
Key features
- OneAgent, a single automatic instrumentation agent that discovers hosts and services without manual setup
- Davis AI, a causal engine that pinpoints root cause automatically instead of just flagging anomalies
- Smartscape, a real-time topology map showing how every host, service, and process connects
- Grail, a unified data lakehouse that stores logs, metrics, traces, and security data together
- Davis CoPilot and Dynatrace Assist, generative AI assistants that translate plain English into queries
- AI Observability for monitoring GenAI and LLM workloads across the stack
Pros
- Requires minimal manual configuration, since OneAgent auto-discovers hosts and services without per-language setup
- Built to handle very large, high-change environments where thousands of services would overwhelm a manual approach
- No per-seat fees, so adding engineers to the platform doesn’t add to the bill
- Davis AI’s causal analysis returns a specific, ranked root cause instead of just flagging that something is wrong
Cons
The highest list price in the category, and the bundled DPS pricing model means committing to full-stack cost from day one rather than starting small.
Best for
Enterprises with a dedicated observability budget and infrastructure too large and interconnected for engineers to trace root causes manually.
Pricing
Consumption-based DPS billing; Full-Stack Monitoring runs roughly $58 per 8GB host/month at list price. See how Middleware compares as a Dynatrace alternative.
5. Grafana Cloud
Grafana Cloud is the managed version of the open-source Mimir (metrics), Loki (logs), and Tempo (traces) stack, for teams that want that stack’s portability without operating it themselves. It’s the natural next step for teams already running open-source Grafana and Prometheus who want a hosted, scalable backend instead of maintaining their own storage layer. Because the underlying stack is fully open-source, nothing about the data model locks a team into Grafana Cloud specifically, self-hosting the same components remains an option at any point.
Key features
- An Application Observability module that correlates metrics, logs, and traces APM-style
- Native OpenTelemetry ingestion without needing a proprietary agent
- Built-in k6 load testing for performance and capacity testing
- Grafana Assistant, an AI copilot for building dashboards and queries with natural language
- Built on the open-source Mimir, Loki, and Tempo stack, fully portable if you self-host later
- Adaptive Telemetry, which automatically filters low-value data to control cost
Pros
- The most generous free tier in the category, enough to run a real small-to-mid production workload at zero cost
- Fully open-source foundation means no proprietary data format locking a team into the platform
- Fully portable if a team outgrows the managed tier, since the same Mimir, Loki, and Tempo stack can be self-hosted later
- Native OpenTelemetry support avoids re-instrumenting code that’s already OTel-based
Cons
Less plug-and-play than proprietary APM tools, requires PromQL fluency and labeling discipline since unmanaged metric cardinality spikes cost quickly.
Best for
Platform engineering teams that would rather own their observability stack’s portability than rent a fully managed black box.
Pricing
Free tier available; Pro starts at $19/month plus usage. See how Middleware compares in this Grafana vs. Middleware breakdown.
6. AppDynamics
Powered by Cisco, AppDynamics ties application performance directly to business-transaction and end-user impact, translating technical incidents into revenue and customer-experience terms.
It’s one of the original enterprise APM platforms, built for monolithic Java and .NET applications before microservices became the default architecture, and it still carries that business-transaction-first design today. Since the Cisco acquisition, it has added agentic AI SRE capabilities and deeper network-layer visibility through Cisco ThousandEyes integration.
Key Features
- Business transaction correlation that ties technical performance to specific customer journeys
- Automated anomaly detection that flags deviations without relying on static thresholds
- Native agent support for Java, Node.js, PHP, .NET, Python, and C++
- Agentic AI SRE capabilities that investigate incidents and recommend remediation automatically
- End-user impact scoring that quantifies incidents in revenue and experience terms
- Cisco ThousandEyes integration for network-layer visibility alongside application performance
Pros
- Strong business-transaction-to-revenue correlation that translates technical incidents into numbers a non-technical exec understands
- Deep Cisco network integration through ThousandEyes, valuable for enterprises already standardized on Cisco infrastructure
- Proactive alerting tuned to business-critical transactions rather than generic infrastructure thresholds
- Agentic AI SRE capabilities that are increasingly narrowing the gap with newer, cloud-native competitors
Cons
Complex setup and per-agent pricing make it a difficult fit below enterprise scale.
Best for
Cisco-standardized enterprises where procurement and networking infrastructure already run through Cisco.
Pricing
Roughly $33/agent/month on the Pro tier, with Cisco channel discounts common for existing customers.
7. SigNoz
SigNoz is an open-source, OpenTelemetry-native APM built on a single ClickHouse database instead of three separate storage backends for metrics, logs, and traces.
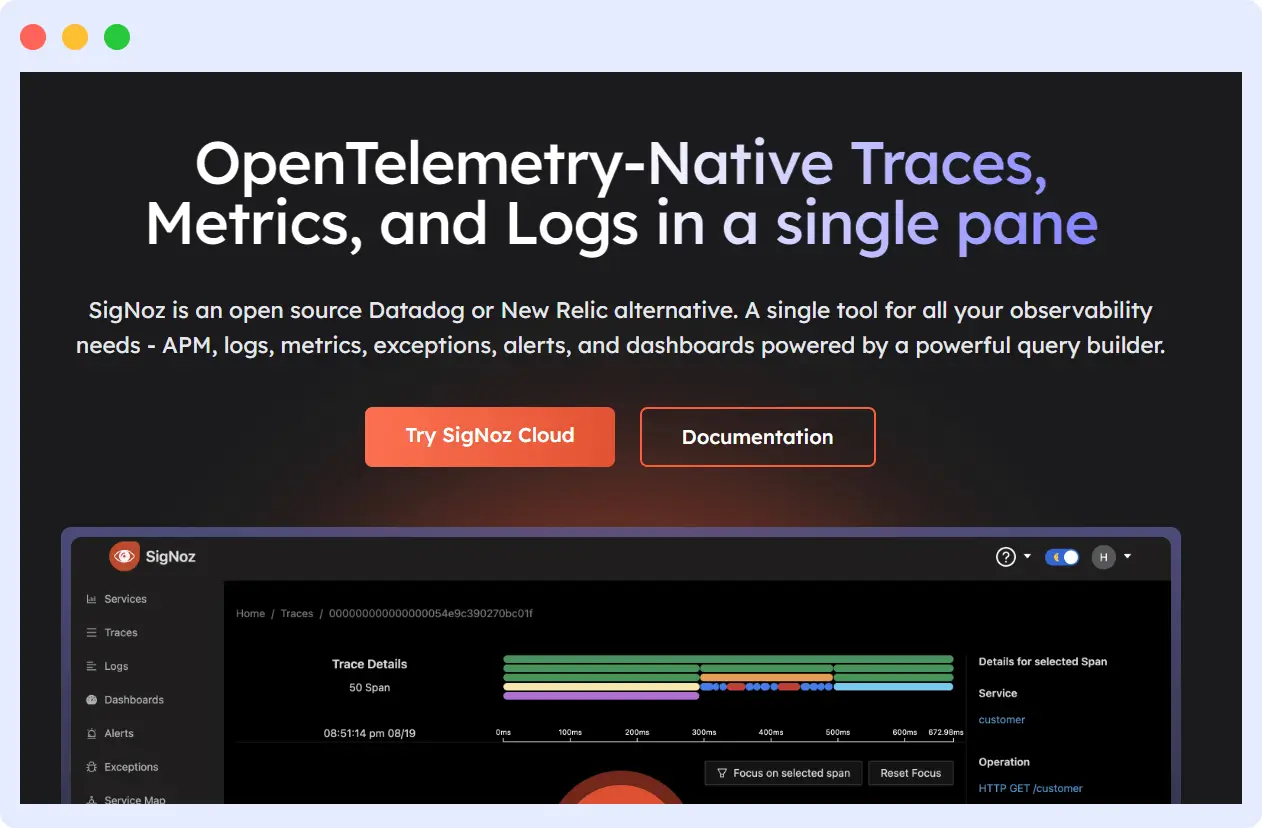
It was designed from the outset as an open-source alternative to Datadog and New Relic, giving engineering teams the choice to self-host the full stack or use a managed cloud tier without losing access to the underlying code. The unified ClickHouse backend is what keeps its ingestion and query costs low relative to proprietary competitors running separate systems per telemetry type.
Key Features
- A unified UI for metrics and traces instead of separate views per telemetry type
- Advanced trace filtering for narrowing down root cause across microservices
- A choice of self-hosted or managed cloud deployment depending on data control needs
- A single ClickHouse backend that stores all telemetry types instead of three separate databases
- OpenTelemetry-native architecture with no proprietary agent required
- No per-user pricing, so adding engineers doesn’t increase the bill
Pros
- An active, responsive open-source community that ships features and fixes quickly compared to closed-source competitors
- Full data ownership with the self-hosted option, important for teams with strict data residency or compliance requirements
- Fast ingestion and aggregation thanks to the single ClickHouse backend, instead of three separate storage systems
- No per-user pricing, so growing the engineering team doesn’t grow the bill
Cons
A smaller community and integration catalog than the incumbents; self-hosting means you own the operational burden.
Best for
Teams with the platform engineering capacity to self-host, or ones that want a managed cloud tier without OpenTelemetry lock-in risk.
Pricing
Usage-based on ingestion and retention; free self-hosted option, paid cloud tiers.
8. Elastic Observability
Elastic Observability extends the Elastic Stack (formerly ELK) into APM, logs, metrics, and traces with a search-first interaction model rather than a dashboard-first one. It’s built on the same Elasticsearch and Kibana foundation that made the ELK stack a default choice for log analytics, so teams already running Elastic for logs get APM and infrastructure monitoring as a natural extension rather than a second platform to learn. The fast, flexible search that made Elasticsearch popular for logs carries directly into how engineers investigate incidents here.
Key features
- Centralized search across logs, traces, and metrics using the same Elasticsearch query engine
- Strong dashboarding and visualization through Kibana
- Native Elasticsearch query capabilities for teams already fluent in the query syntax
- 450+ integrations covering clouds, CI/CD tools, and databases
- Agentic AI investigations through Elastic Agent Builder for automated root cause analysis
- LLM observability for tracking AI model performance, usage, and cost
Pros
- Powerful, flexible search across all telemetry types, not just logs, which is where the platform’s roots give it an edge
- Familiar and low-friction for teams that already run Elasticsearch and Kibana for logs
- Open, schema-agnostic ingestion built on OpenTelemetry, so data isn’t locked into a proprietary format
- Machine learning-based anomaly detection built into infrastructure monitoring without extra configuration
Cons
A steep learning curve for teams unfamiliar with Elasticsearch query syntax and cluster management overhead.
Best for
Teams with existing ELK investment and in-house Elasticsearch expertise already on staff.
Pricing
Starts around $16/host/month for cloud-hosted deployments.
9. Instana
Instana, owned by IBM, is an APM platform built for fully automated discovery, instrumenting hosts, containers, and services without manual configuration and updating at 1-second granularity. It was designed specifically for the pace of change in Kubernetes and microservices environments, where a manually maintained service inventory is out of date within hours of being built. Instana also captures 100% of requests rather than sampling, trading higher data volume for a completeness guarantee that sampled tools don’t offer.
Key features
- Zero-configuration automatic discovery that instruments hosts, containers, and services without setup
- 1-second metric granularity, far finer than the 1-minute intervals common elsewhere
- Support for 300+ technologies out of the box
- End-to-end distributed tracing across every hop a request makes
- 100% request capture without sampling, so no trace is ever missed
- AI-powered automated root cause analysis that narrows down the cause without manual digging
Pros
- Genuinely zero-touch setup, live within minutes of installing the agent with no manual service tagging required
- Every feature, APM, infrastructure monitoring, tracing, and end-user monitoring, is included per tier with no extra add-on charges
- Fast, automated root cause recommendations that point to a specific cause rather than just an anomaly
- 1-second metric granularity and 100% request capture give a completeness guarantee sampled competitors don’t offer
Cons
A 10-host minimum commitment, and the flat per-host pricing gets expensive fast on high pod-density Kubernetes clusters where host count multiplies quickly.
Best for
Enterprises running complex, dynamic infrastructure that want automated coverage without engineers hand-tagging every service.
Pricing
Per host, Essentials around $21.20/host/month, Standard around $79.50/host/month, billed annually with a 10-host minimum.
10. Honeycomb
Honeycomb is an observability platform built specifically for debugging complex production systems through high-cardinality event analysis, not for general-purpose dashboards. It was founded in 2016 by Charity Majors and Christine Yen, both former engineers at Parse (acquired by Facebook), who built it after using Facebook’s internal Scuba analytics tool to debug Parse’s infrastructure. Its core bet is that dashboards only answer questions you already know to ask, while high-cardinality querying lets you find the question you didn’t know to ask, which shows up directly in BubbleUp, its signature anomaly-analysis feature.
Key features
- BubbleUp, a feature that automatically surfaces the exact dimension responsible for an anomaly
- Distributed tracing built for high-cardinality, high-dimensionality data
- High-cardinality querying that lets engineers slice traces by any field, not a fixed set of tags
- Native OpenTelemetry support for vendor-neutral instrumentation
- SLO tracking tied directly to the same event data used for debugging
- A query-driven debugging workflow built for exploration instead of fixed dashboards
Pros
- Event-based pricing that scales with trace volume, not host count or user seats, so team growth doesn’t inflate the bill
- A genuinely different query-driven workflow well suited to exploratory debugging rather than fixed dashboards and alerts
- Built specifically for high-cardinality debugging that dashboard-first tools structurally can’t do well
- Native OpenTelemetry support means no proprietary agent to maintain or migrate away from later
Cons
Not a traditional full-stack APM; teams that want out-of-the-box infrastructure dashboards and alerting will find it thinner than Datadog or Middleware in that area.
Best for
Teams with complex microservices architectures where the bottleneck is finding the needle in a high-cardinality haystack, not building dashboards.
Pricing
Free up to 20 million events/month, Pro from $130 per 100 million events, scaling to 1.5 billion events/month; custom Enterprise pricing above that.
How to choose the right APM tool
Start with these questions before comparing feature lists:
- What’s your primary need? Full-stack performance monitoring, error tracking, or infrastructure visibility call for different tools.
- What’s your stack? Confirm language, framework, and cloud support before evaluating anything else, this eliminates half the list quickly.
- Do you run Kubernetes or serverless? Not every APM tool auto-instruments containers or serverless functions well; check this explicitly rather than assuming.
- How predictable does your bill need to be? Per-host pricing (Datadog, Dynatrace, AppDynamics) scales with infrastructure size. Per-GB pricing (Middleware, New Relic, Grafana Cloud) scales with data volume. Pick the model that matches how your environment actually grows.
- Do you need OpenTelemetry support? OpenTelemetry-native tools (Middleware, SigNoz, Grafana Cloud) avoid re-instrumenting your code if you switch vendors later.
- How fast do you need root cause answers? If MTTR is the priority, weigh AI-driven root cause analysis heavily, this is where the tools differ most in practice.
Then evaluate against the functional dimensions Gartner uses for the category: automatic application discovery and dependency mapping, end-to-end tracing and diagnostics, user experience tracking across platforms, and AI for IT operations. A tool that’s strong on three of these but weak on the one you need most isn’t the right fit, regardless of its overall market position. If you’re still weighing two finalists after that, the tiebreaker is almost always the pricing model, not a missing feature.
Need help choosing the right APM solution? See how Middleware compares with leading observability platforms. Book a Demo
Final thoughts
The right APM tool depends on your stack, your team’s size, and how predictable you need your bill to be, more than any single feature. For Kubernetes and microservices environments specifically, prioritize OpenTelemetry support, distributed tracing depth, and AI-driven root cause analysis that actually reduces alert noise rather than adding to it.
Middleware brings metrics, logs, and traces into one unified view with OpenTelemetry-native instrumentation and predictable pay-as-you-go pricing, no per-host surprises as your cluster scales.
Ready to improve application performance and reduce downtime? Start monitoring your applications with Middleware today.
FAQs
What are the best APM tools for cloud-native teams?
Middleware, SigNoz, and Grafana Cloud lead for cloud-native teams because all three are OpenTelemetry-native, meaning they instrument Kubernetes, containers, and serverless workloads without a proprietary agent per language. Datadog and Dynatrace also cover cloud-native environments well but at a higher, host-based cost as clusters scale.
Which APM tool is best for DevOps and observability?
There’s no single best tool, it depends on team size and existing stack. Middleware and SigNoz suit DevOps teams that want unified metrics, logs, and traces without host-based billing. Datadog suits teams that want the broadest integration catalog. Dynatrace suits large enterprises that prioritize automated, causal root cause analysis over cost predictability.
What features should I compare when choosing an APM tool?
Compare distributed tracing depth, log-metric-trace correlation, Kubernetes and serverless auto-instrumentation, AI-driven root cause analysis, pricing model (per-host vs. per-GB), integration count for your specific stack, and whether the tool is OpenTelemetry-native or requires a proprietary agent.
Which application performance monitoring solution is easiest to set up?
Middleware and SigNoz are the fastest to onboard because both use OpenTelemetry-native auto-instrumentation with a single-script install rather than a proprietary agent per language. Datadog and Dynatrace also offer auto-instrumentation but generally require more configuration to unlock their full feature set, particularly around service mapping and AI-driven root cause analysis.
How can APM tools reduce mean time to resolution for production incidents?
APM tools cut MTTR by correlating metrics, logs, and traces automatically instead of requiring an engineer to pivot between separate tools, and by using AI-driven root cause analysis to propose a likely cause instead of just flagging an anomaly. Middleware’s OpsAI, for example, resolves over 70% of incidents automatically across beta customers, with an 80%+ improvement in on-call productivity, by correlating signal across all three telemetry types the moment an incident starts.
Which APM tools support AI-driven alerting and root-cause analysis?
Middleware (OpsAI), Dynatrace (Davis AI), Datadog, and New Relic all offer AI-driven root cause analysis. They differ mainly in how much manual configuration they require and how aggressively they reduce alert noise versus simply flagging more anomalies.
What should I look for in an APM tool for containerized applications?
Look for auto-instrumentation that doesn’t require redeploying containers with a new agent, per-pod and per-node resource visibility, native Kubernetes event correlation, and support for multi-cluster environments if you run EKS, AKS, or GKE together.
Which APM platforms handle high-cardinality trace data without cost spikes?
Per-GB pricing models (Middleware, Grafana Cloud, New Relic) tend to handle high-cardinality data more predictably than per-host models, since cost scales with actual data volume rather than infrastructure count. Sampling controls, capturing errors and high-latency traces fully while sampling the rest, are the main lever for keeping high-cardinality trace costs manageable regardless of vendor.
Which APM solutions integrate best with CI/CD pipelines for deployment tracking?
Datadog, New Relic, and Middleware all support deployment markers that tie a release to the performance data that follows it, making it possible to see whether a specific deploy caused a regression. Check for native integrations with your specific CI/CD tool (GitHub Actions, GitLab CI, Jenkins) rather than assuming generic webhook support is equivalent.