Exit codes 137 are numbers returned after a command or program is executed. They tell whether a process executes successfully or not. They are helpful in scripting and automation since they enable you to:
- Detect success or failure.
- Handle errors programmatically
- Chain commands conditionally using &&, ||, or if.
Our primary focus in the article is the exit code 137. In this article, we’ll learn about the causes, implications, and how to diagnose and fix it.
What is Exit Code 137?
Exit code 137 is a number that a process returns when it is forcibly terminated by the operating system using the SIGKILL signal (signal 9). Kubernetes uses this code to identify pods that were shut down by the Linux kill signal (SIGKILL).
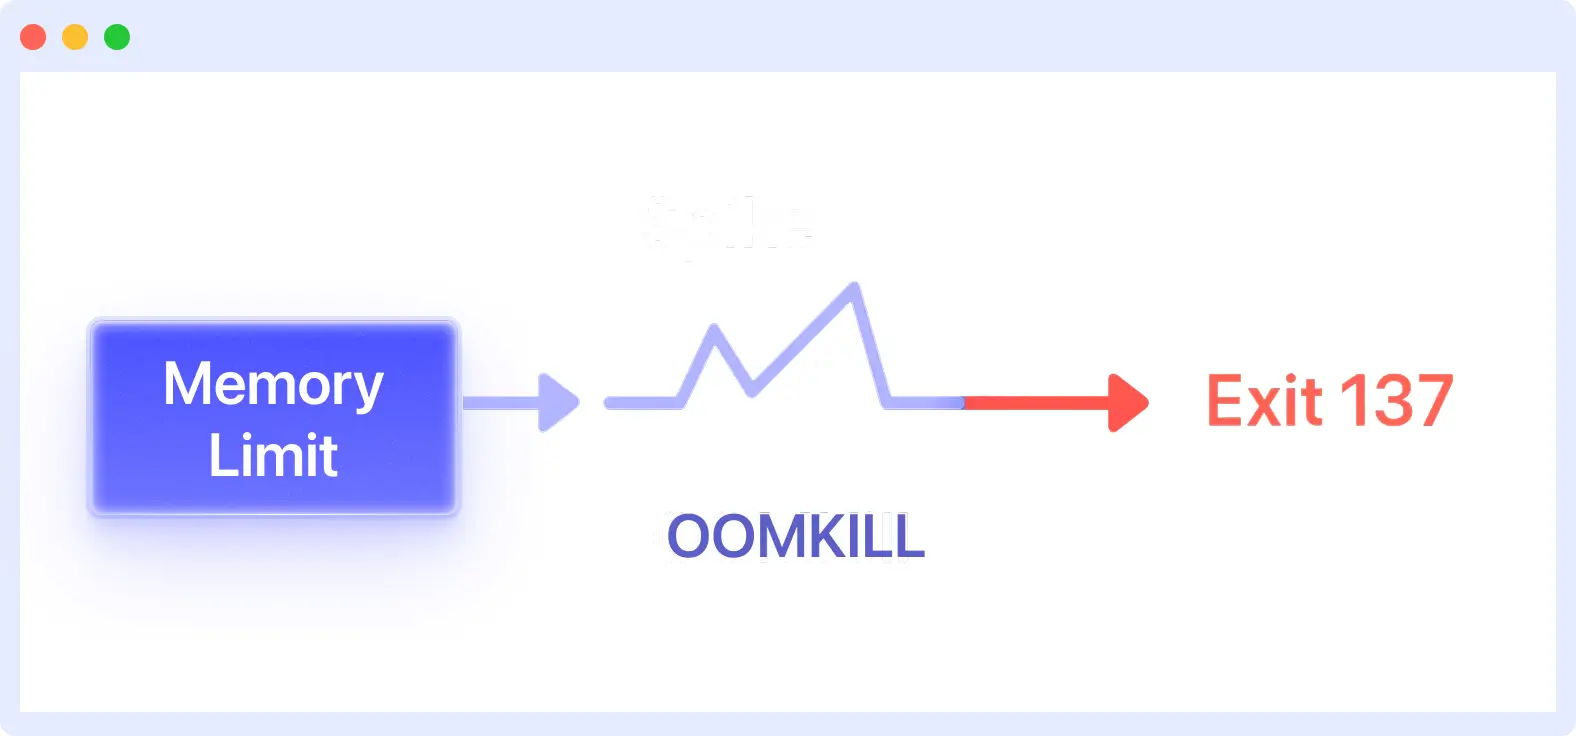
Most often, the system’s OOM killer stops the process to free up memory. In Kubernetes, this code indicates that the Linux kernel terminated a container that was consuming too much memory to maintain stability.
Code 137 is the sum of 128 and 9; 128 is a base code for fatal signals. 9 is the signal number for SIGKILL.
So: 128 + 9 = 137
Before termination, pods often show slow response times or crashes, typical application performance issues you should watch for.
Common Causes of Exit Code 137
Exit code 137 doesn’t just appear from nowhere. Something must have triggered it. Here are some of the common causes:
- Out of Memory (OOMKilled): Exit codes 137 mostly occur when the process or container runs out of memory. The Linux kernel’s OOM killer uses SIGKILL to free up memory by stopping processes. It happens when memory demand exceeds the system or container limit.
- Incorrect Resource Limits: If you set low memory limits on containers or fail to configure them properly, the app will not have sufficient memory to function effectively. Because of this, the container will hit the memory limit and trigger the OS to kill it.
- Memory Leaks and Spikes: Most of the time, the problem doesn’t come from resource allocation. Some parts of an app that cause memory leaks can gradually consume memory. Additionally, a sudden increase in memory usage due to poor management can cause processes or containers to be terminated. Detecting and fixing memory leaks is necessary to prevent exit code 137.
- Failed Health Checks: If health checks continue to fail in Kubernetes, it may result in the killing of containers. This could send out a kill signal to restart the container, which would result in exit code 137.
Implications of Exit Code 137
A forceful kill can cause issues that impact the performance and reliability of an application. Especially the ones running on containers or in cloud environments.
Affects the Stability and Availability of an Application
An instant termination can cause an application to become unstable by removing it from service immediately. If there’s no backup instance or load balancer to take over, users will experience downtime. Even when there is a backup, restarting the killed process takes time. Such situations can lead to slower response times and reduce the quality of the service.
In systems where multiple services are interdependent, if one fails, the others may also fail, ultimately affecting the entire system.
Potential Data Loss or Corruption Due to Forced Termination
When a process is terminated immediately, it can’t preserve its work, complete transactions, or properly disconnect connections. This can make you lose data.
For instance, a write activity to a database might be stopped, which would corrupt the data. Data in memory, including cache and active user sessions, will also be lost immediately. This can prevent users from continuing their previous actions and require extra steps to return to normal.
Effect on Cluster Resource Monitoring and Management
In Kubernetes, frequent occurrences of exit code 137 can impact resource utilization. Monitoring tools may indicate that your app’s memory usage has decreased. However, the decrease does not indicate better memory use by your app. Just implies the process was destroyed, therefore it stopped using memory.
Therefore, you may unnecessarily reduce RAM restrictions or pod sizes. Due to multiple forceful terminations, app memory needs are hidden, making resource management and cluster stability difficult.
How to Diagnose Exit Code 137
You have to find the cause of exit code 137 before fixing it. Logs, system metrics, and data are evaluated to see if the container died due to a memory limit.
1. Inspecting Pod/Container Logs
First, look at the logs of the pod or container that gave you the exit code 137 to figure out what happened. The system sends messages to the logs while the pod is running. This message will display errors, warnings, or other indications that triggered the kill.
For instance, if the program runs out of memory or fails over and over again before being terminated, those problems will be recorded in the log.
You can get the logs using the command:
Reviewing these logs helps you identify the issues with your application.
📜 Need help analyzing pod logs to find out what went wrong? Our Kubectl Logs Tail tutorial shows you how to tail logs efficiently.
2. Metrics and Logs for Nodes
You should look at the logs and metrics of the node where your pod was executing. System logs on the node often show how resources are being used, which can cause containers to be shut down.
Memory usage trends over time can indicate if the node ran out of memory and the kernel killed processes. This helps identify whether the exit code 137 was caused by the pod exceeding its memory or a system resource shortage affecting several pods.
Commands like:
Monitoring tools that provide node health and resource stats are valuable here to get a clear picture of the environment when the pod was killed.
3. Using Monitoring Tools
You need monitoring tools to keep an eye on things and rapidly find exit code 137 incidents. These tools keep track of pod memory usage, node performance, and container health over time. This helps you find patterns like memory leaks or resource shortages before they cause problems.
👉 To learn more about tracking memory and CPU trends at the pod and cluster levels, check out our comprehensive guide on Kubernetes Monitoring.
Middleware is one monitoring tool you might want to consider using. It has a lot of features that let you monitor your apps in real time.
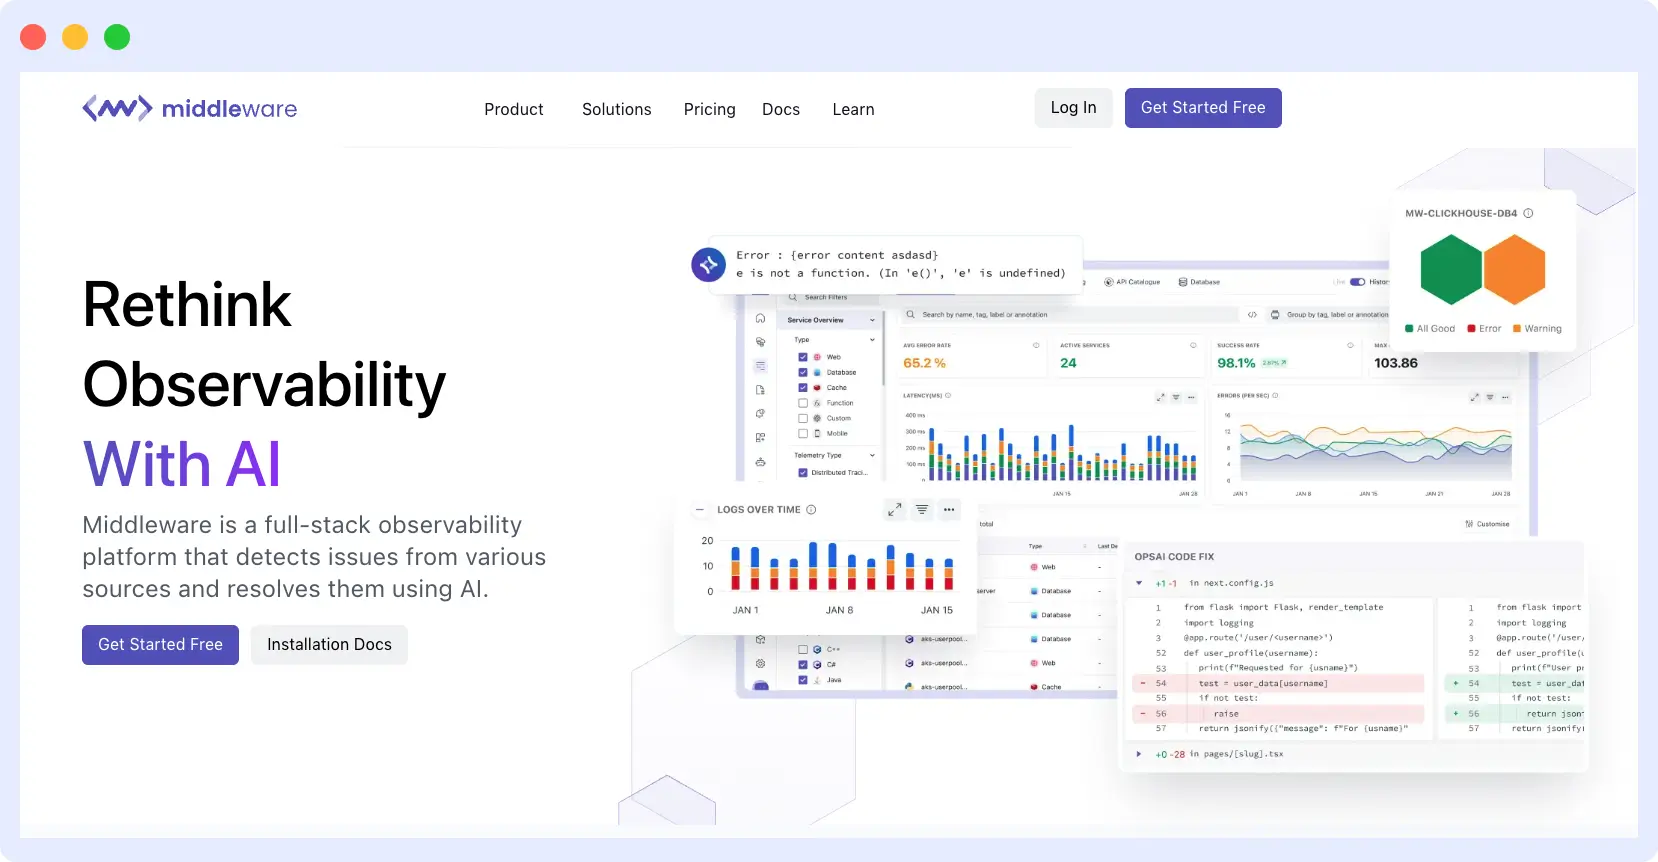
With Middleware, you can monitor how much memory a pod is using. This will let you know when they’re getting close to the limit and warn you ahead of time to avoid termination.
How to Fix Exit Code 137
When you see error code 137, the first thing to do is to double-check your diagnosis (logs, node metrics, etc.). This will give you a glimpse of what went wrong.
Now, here are different ways you can fix exit code 137 depending on the cause:
1. Increase Memory Limits
As mentioned earlier, exit code 137 is often caused by the container or app using more memory than allocated. Each container’s memory is limited. For low memory limits, the system will rapidly stop the container from using more memory.
When users face delays or degraded experience, Digital Experience Monitoring can help trace issues before they escalate into errors like 137.
To fix this, manage your container’s resources very well. Your application can consume additional memory without being killed. You can do this in Kubernetes by modifying the “resource” part of your container or pod specification:
# Current problematic config
resources:
  limits:
    memory: "256Mi"

# Updated config
resources:
  requests:
    memory: "512Mi"
  limits:
    memory: "1Gi"
- The requests field tells Kubernetes how much memory your container is expecting to use.
- The limits field is the maximum memory the container can consume.
Increasing these values will give the container more available memory. However, be sure to find a balance; setting limits too high can cause other containers to receive less memory, which will lead to problems.
2. Optimize Memory Usage
Most of the time, increasing memory limits may not be helpful, especially if your application has memory leaks. The app uses all available memory and returns an exit code of 137.
To fix this, monitor and improve app memory usage:
- Profiling tools for your programming language can help you understand how your software utilizes memory.
- Search your code for the area that adds data, objects, or arrays without cleaning up.
- Ensure your software releases memory appropriately after a task.
- Fix memory leaks to ensure your program uses memory efficiently.
Overall, improving memory usage will make your program more reliable and reduce memory loss.
👉 Refer to our post on Kubernetes Troubleshooting Techniques for real-world debugging workflows and error handling methods.
3. Adjust Liveness and Readiness Probes to Prevent Premature Kills
Kubernetes uses liveness and readiness probes to determine if a container is healthy enough to execute or receive traffic.
- Liveness probe tells Kubernetes, “restart me if I keep failing this check.”
- Readiness probe tells Kubernetes, “only send traffic to me when this check passes.”
How to configure probes:
1. Increase initialDelaySeconds to give your app more time to start:
livenessProbe:
  httpGet:
    path: /health
    port: 8080
  initialDelaySeconds: 30   # Wait 30 seconds before first check
  periodSeconds: 10
  failureThreshold: 3

readinessProbe:
  httpGet:
    path: /ready
    port: 8080
  initialDelaySeconds: 15   # Wait 15 seconds before first check
  periodSeconds: 5
  failureThreshold: 3
2. Adjust periodSeconds and failureThreshold.
livenessProbe:
  periodSeconds: 10
  failureThreshold: 3

readinessProbe:
  periodSeconds: 5
  failureThreshold: 3
- periodSeconds indicates how often Kubernetes runs the probe
- failureThreshold defines the number of probe failures that Kubernetes requires to consider the container unhealthy.
Setting a higher failureThreshold or longer periodSeconds can delay restarts.
3. Use simple, lightweight health check endpoints
Avoid running heavy commands or checks in your probes. Use HTTP or TCP checks whenever possible because they are less likely to strain your container.
Example:
4. Test your probes locally before deploying
5. Update your deployment
After you adjust your probe, apply the changes with:
You can refer to Kubernetes’ official documentation to learn more about setting up probes.
Best Practices to Avoid Exit Code 137
To handle exit code 137 effectively, it is best to avoid it altogether. Here are some best practices to follow:
- Set both requests and limits in resource configs: Always define how much memory a container expects and the maximum it can use in your Kubernetes or Docker settings. This prevents unpredictable scheduling and OOM kills.
- Monitor memory trends continuously: Utilize a monitoring tool, such as Middleware, to track container and node memory usage over time. This helps identify slow growth before it leads to failures.
- Stress test before deploying: Simulate heavy traffic or large workloads in a test environment to see how your app handles high memory usage. Fix problems before they hit production.
- Enable memory usage alerts: Set up alerts with tools like Middleware to receive notifications when there’s a sudden increase in memory usage.
📊 Discover how observability including metrics, logs, and traces helps you prevent issues like SIGKILL in our Mastering Kubernetes Observability guide.
How Middleware Helps to Fix Kubernetes Errors
Middleware makes it easy to identify and resolve issues in Kubernetes clusters, pods, nodes, and the entire cluster, allowing you to monitor your environment effectively. It features a dashboard that displays logs, metrics, and events for containers in a clear and easy-to-read format.
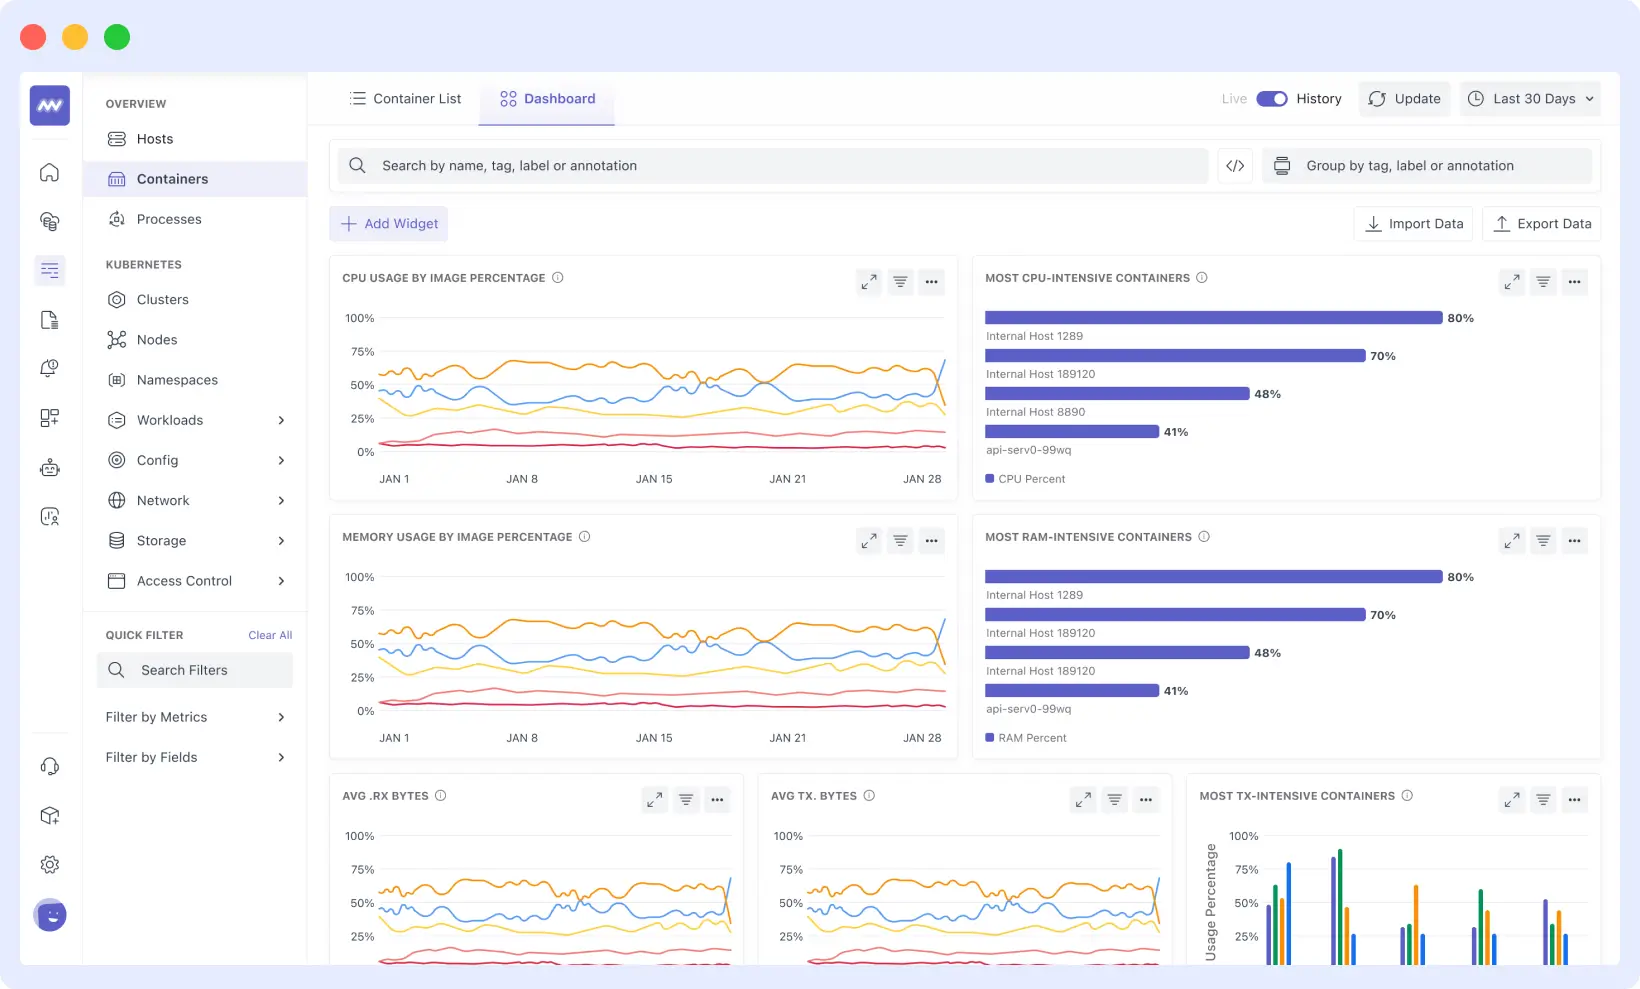
With Middleware, you can:
- You can filter logs by container, pod, or service to find mistakes more quickly. No need to jump between multiple terminals.
- With Middleware, you can view charts for memory, CPU, and network usage over time to determine what happened before a crash. This makes it easier to figure out what went wrong, such as exit code 137.
- Get notifications when something goes wrong. You can set up alerts to receive immediate notifications if memory, CPU, or error rates exceed safe levels.
- Connect logs and metrics. You can gain a clear understanding of what caused a failure by matching log entries with times when CPU or memory consumption increased.
Middleware saves you time and makes it easier to fix Kubernetes failures without having to guess what went wrong.
Learn how to set up the Middleware agent for a Kubernetes environment by referring to the documentation.
Conclusion
You can prevent error code 137 from interfering with your work by knowing how to identify its source and following best practices.
You should actively manage and closely monitor your application’s resources to ensure dependable, steady operation and prevent unplanned container breakdowns.
If you want to see what’s going on with your containers and apps in great detail, utilize monitoring tools like Middleware to find problems before they happen and cause downtime.
FAQs
What is exit code 137 in Kubernetes?
It means that the container was killed with signal 9 (SIGKILL) because it used too much memory.
How can I prevent exit code 137?
Increase your container’s memory limits, optimize your app’s memory usage, and monitor memory trends using tools like Prometheus or APMs.
Can exit code 137 be caused by anything other than memory issues?
Yes, Kubernetes can also terminate the container forcefully, leading to this exit code, however memory misuse is the most common reason.
How are SIGTERM and SIGKILL different?
SIGTERM stops the app gradually, allowing it time to clean up. SIGKILL stops the app right away without giving any warning.


