Kubernetes monitoring helps SREs, DevOps, and cluster admins identify performance issues, such as insufficient resources, high CPU usage, and pod failures, across their Kubernetes (K8s) environment.
It simplifies the management of your containerized applications by tracking uptime, cluster resource utilization, and interactions among cluster components.
This article explains Kubernetes monitoring, highlighting essential metrics to collect and best practices, as well as tools you can implement for effective container monitoring.
What is Kubernetes monitoring?
Kubernetes monitoring involves analyzing and managing container performance within Kubernetes clusters. This process includes collecting performance data for troubleshooting insights, allowing for tracking and identifying issues promptly to ensure node performance and user satisfaction.
While Kubernetes does offer built-in monitoring plugins, they may not provide the detailed visibility necessary for efficient container monitoring and troubleshooting.
Traditional monitoring tools also struggle to monitor the various components enabled by Kubernetes effectively. Nonetheless, numerous off-the-shelf monitoring solutions can provide timely and effective visibility into your Kubernetes clusters.
Why is Kubernetes monitoring important?
Kubernetes monitoring provides real-time performance insights, allowing for quick issue resolution and enhanced application uptime. It offers visibility into clusters and nodes, helping identify operational issues and areas of improvement.
This timely response to issues is essential for seamless application upgrades, as it aids in node optimization, scaling decisions, and the detection of malfunctioning pods. Such monitoring improves planning and safeguards cluster stability.
What Kubernetes metrics you should measure
Measuring the proper metrics is essential for achieving end-to-end visibility of your Kubernetes clusters.
Metrics play a pivotal role in setting up dashboard activities and alerts, offering insights into both the Kubernetes system and the applications running within it.
You can obtain metrics from various sources, including cAdvisor, Metrics Server, Kubernetes API Server, and Kube-state-metrics, among others. Here are some key metrics to monitor in Kubernetes:
Cluster monitoring
The Kubernetes cluster serves as the primary host for all containers and the machines running applications. Therefore, monitoring its environment and the well-being of its components, such as nodes and pods, is crucial for successful container management.
Key metrics to monitor in a Kubernetes cluster include:
a) Cluster nodes: In a cluster are nodes that enable the running of applications. These nodes comprise several resources that allow them to carry out their function. You must observe these resources and monitor their health. Worker nodes host the containers while the master nodes manage the worker nodes’ activities.
b) Cluster pods: A pod is the smallest unit in a cluster and consists of one or more containers. The number of pods running determines the required number of nodes. Ensuring the health and resource usage of pods is critical for efficient Kubernetes monitoring.
c) Resource utilization: Understanding resource utilization metrics reveals the strengths and weaknesses of cluster nodes, helping determine adequacy and excess. Key resources to monitor include disk utilization, memory utilization, CPU utilization, network bandwidth, and more.
Pod monitoring
Pods, which consist of containers deployed onto nodes, are fundamental to the Kubernetes ecosystem and require proper monitoring. Consider the following metrics for effective pod monitoring:
a) Container metrics: the number of containers running in a pod and their lifecycle must be understood and regulated. Avoid overloading pods and ensure scalability is optimized.
b) Application metrics: Application metrics measure performance and provide industry-specific information. They offer insights into traffic, the rate of failed requests, request durations, feature usage, and other critical data.
c) Kubernetes scaling and availability: Understanding the scaling and availability capabilities of Kubernetes helps configure auto-scaling tools for clusters. The number of containers or pods in a cluster determines node requirements.
d) Load average: The load average indicates the number of programs running or waiting to run on the CPU. Ensure it doesn’t exceed the number of CPU cores. Monitor load average in conjunction with sys CPU usage and I/O wait for effective troubleshooting.
e) Resource requests and limits: Containers have associated resource requests and limits for CPU and memory. Properly manage these to avoid underutilization or overutilization. Aim for up to 80% actual usage on the 90th percentile for both resource requests and limits.
When a pod is evicted due to node resource pressure or scaled down by the autoscaler, Kubernetes initiates a graceful termination by sending SIGTERM — the container will exit with exit code 143. Monitoring for this code helps confirm whether pod restarts are expected lifecycle events or signs of instability.
Kubernetes monitoring: Key methods
You can monitor your Kubernetes cluster nodes in two ways: using DaemonSets and Heapster. Both methods help collect metrics from the cluster and transmit them to an external endpoint for further analysis.
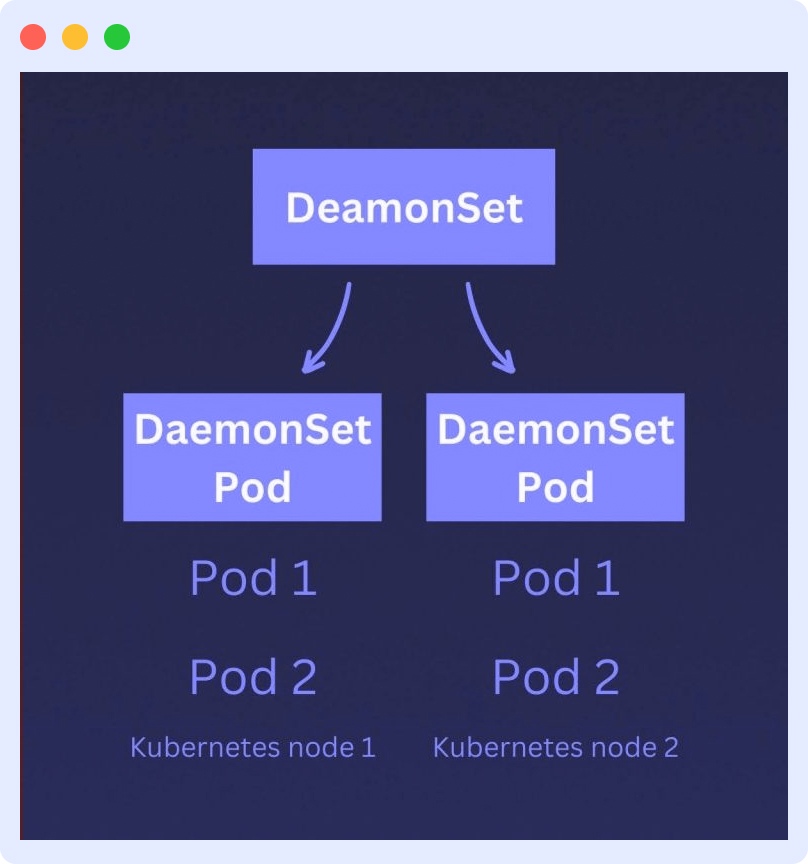
Monitoring using Kubernetes DaemonSets
Kubernetes DaemonSets monitor individual pods and ensure that each one runs on every node in the cluster. They report a node’s ability to run the pods allocated to it.
As a workload tool, object, or specialized pod, a DaemonSet acts as a monitoring agent that collects critical resource metrics from the containers and the node host, sending them to the API server.
Since a DaemonSet is a pod, you can create your specialized monitoring DaemonSet, which functions as a sister pod to your nodes. You can then configure Kubernetes to automatically attach this DaemonSet to each node you create.
This allows the DaemonSet to monitor the node and its components. When a node is terminated, either manually (by you) or automatically (by Kubernetes self-healers), its designated monitoring DaemonSet is also terminated.
Kubernetes Monitoring using Heapster
Heapster is a monitoring pod that collects and interprets signals and Kubernetes metrics. It serves as a link between the cluster and backend storage and also collects logs. Heapster enables performance analysis and visualization.
Heapster queries the nodes about the containers running on them. It works with cAdvisor to expose container metrics such as CPU usage, network activity, and memory utilization.
To efficiently monitor your containers using the Heapster method, you must use the pod in conjunction with a time-series database (TSDB) like InfluxDB and a visualization tool like Grafana. This requires deploying InfluxDB and Grafana and editing the Heapster deployment to send data to InfluxDB.
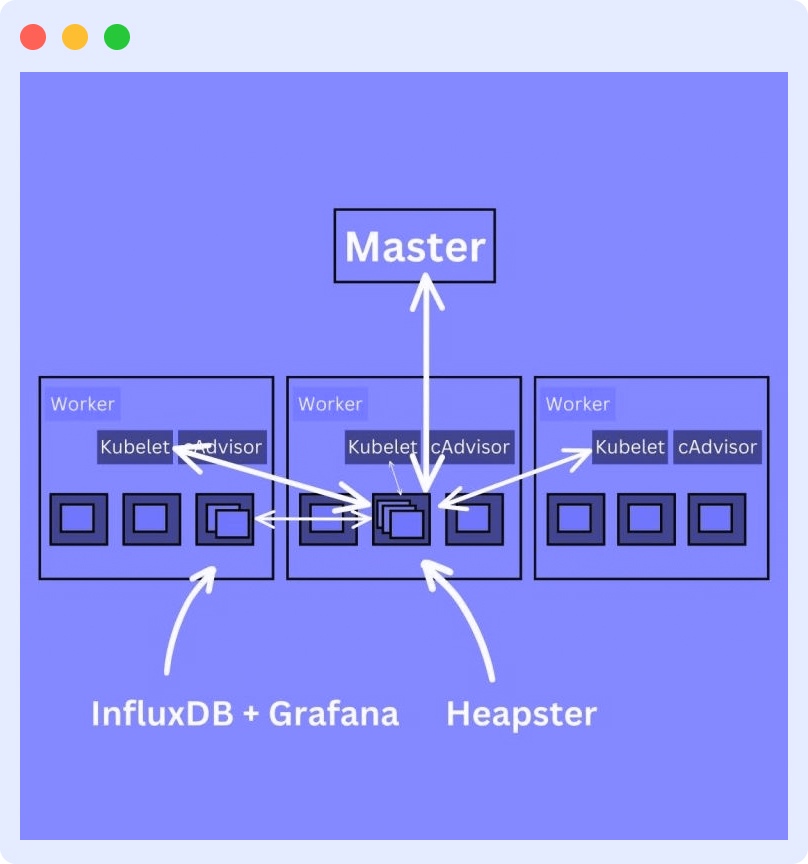
These prerequisites make the Heapster monitoring method more complex than the DaemonSet method.
Kubernetes monitoring with Middleware
Middleware integrates every part of your Kubernetes cluster to provide a comprehensive view of its health and performance. After installing the Middleware agent, it collects metrics, events, and logs from your cluster components, workload pods, and other Kubernetes objects.
The Middleware agent integrates with container platforms like Docker to aggregate container-level metrics and provide a detailed breakdown of your container resources.
This allows you to monitor relevant Kubernetes metrics at the pod and cluster levels.
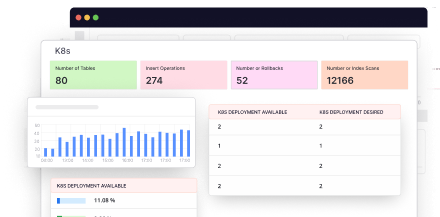
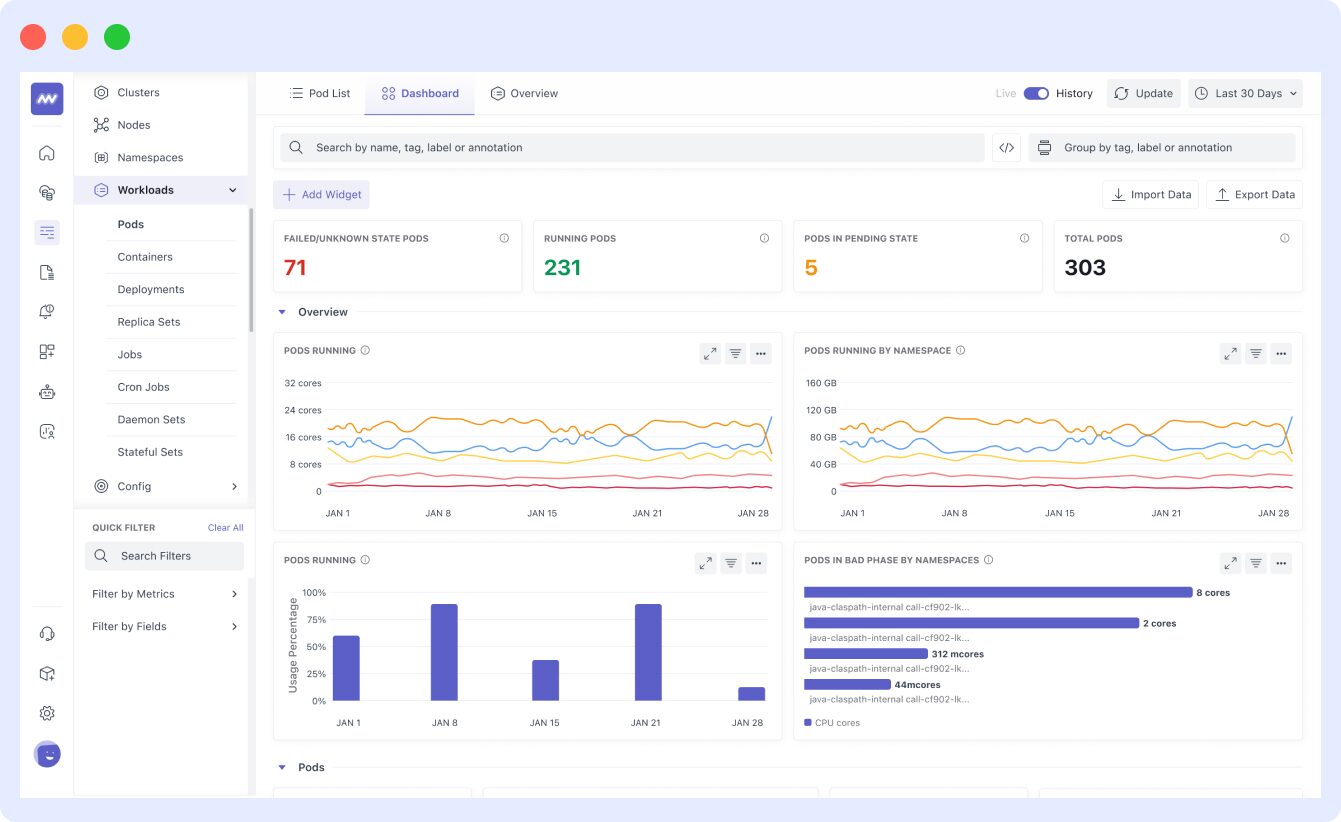
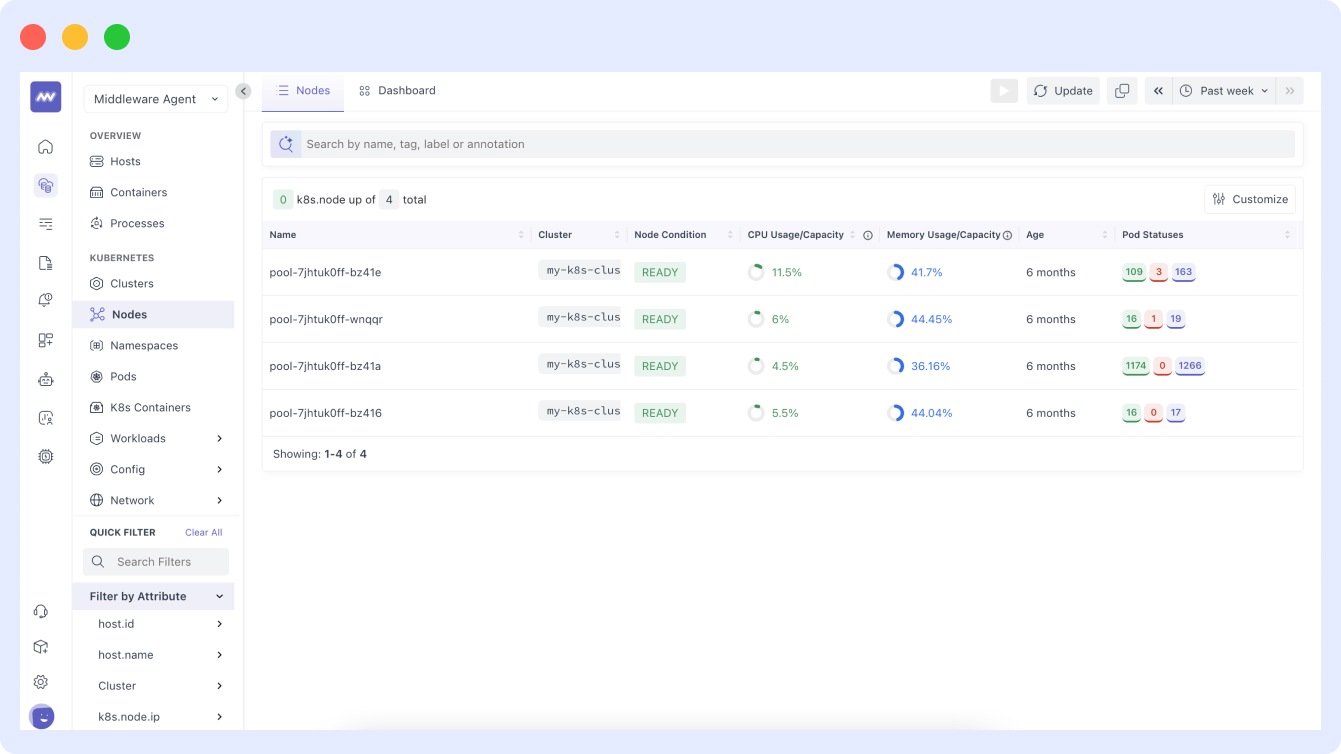
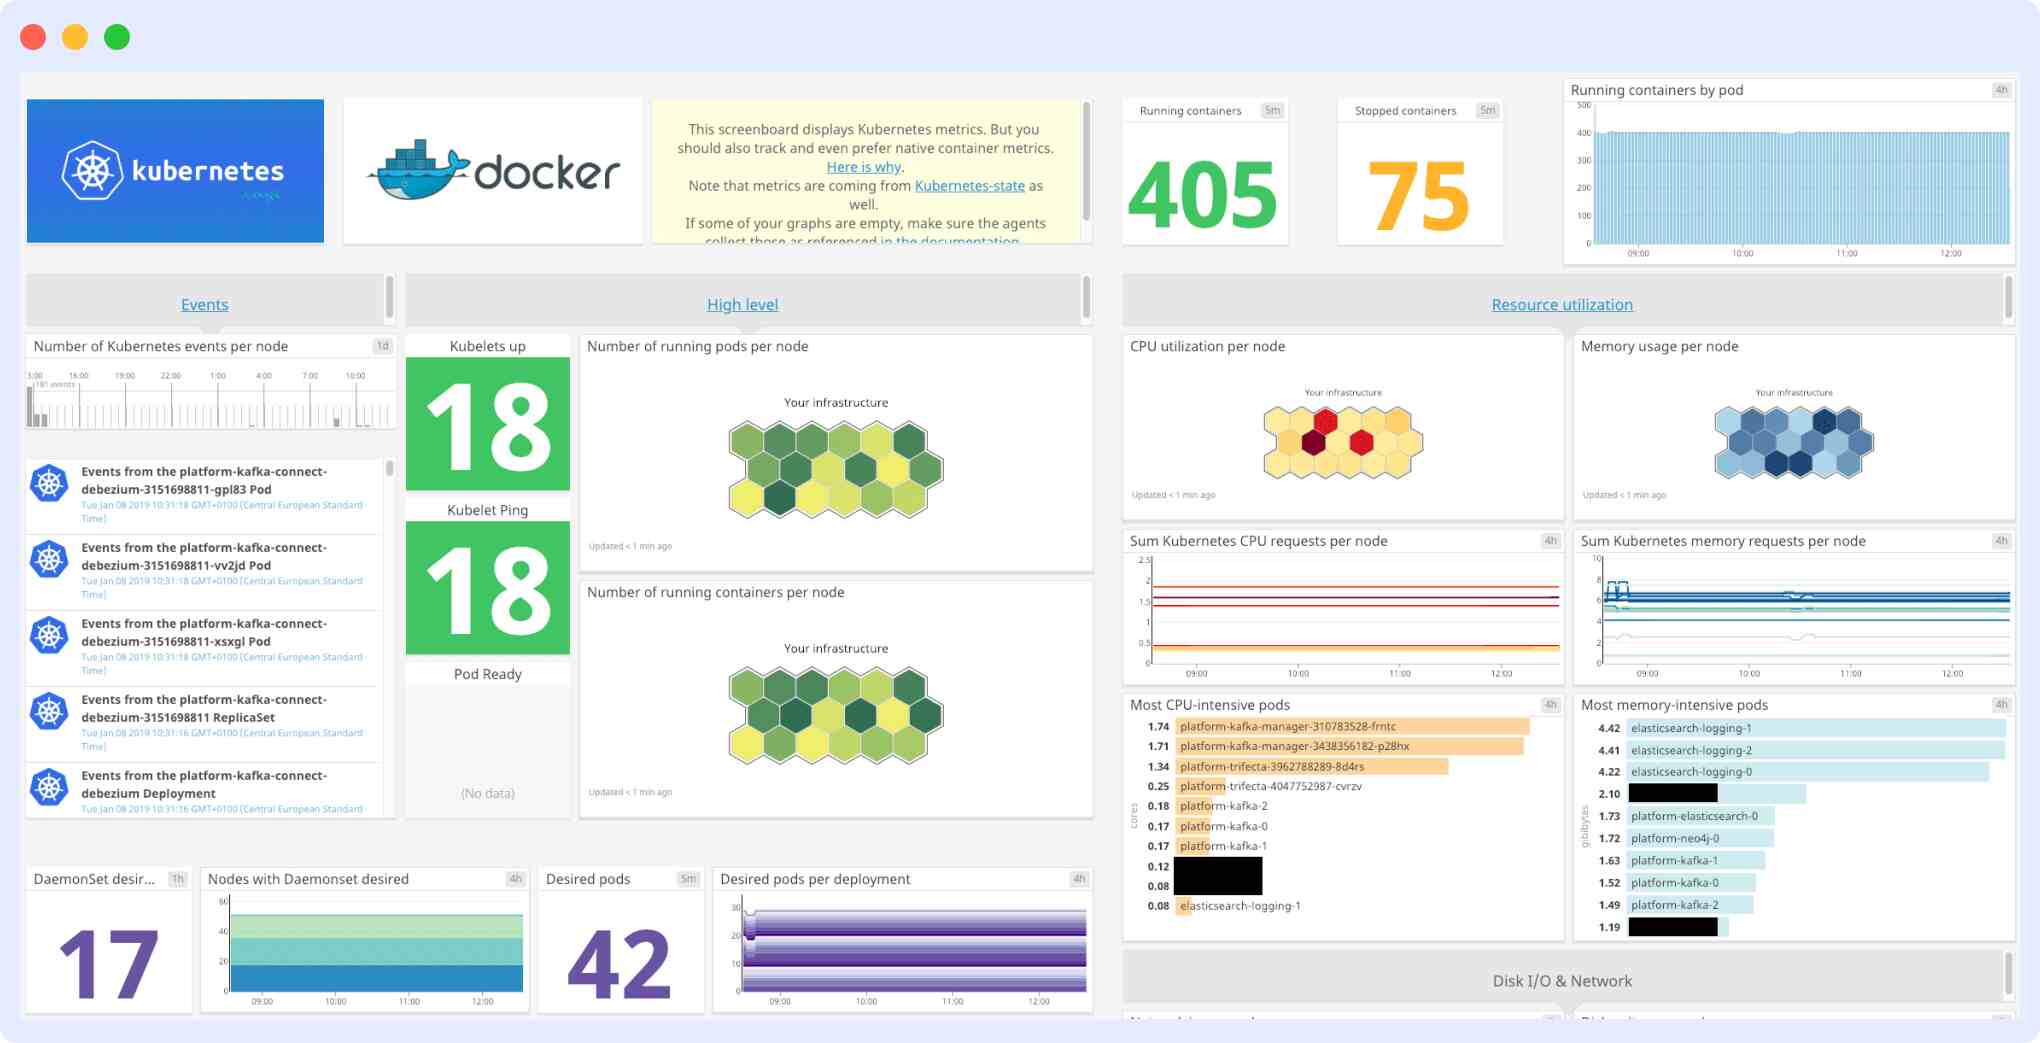
- For node monitoring, the agent provides a graphical monitoring dashboard as illustrated below:
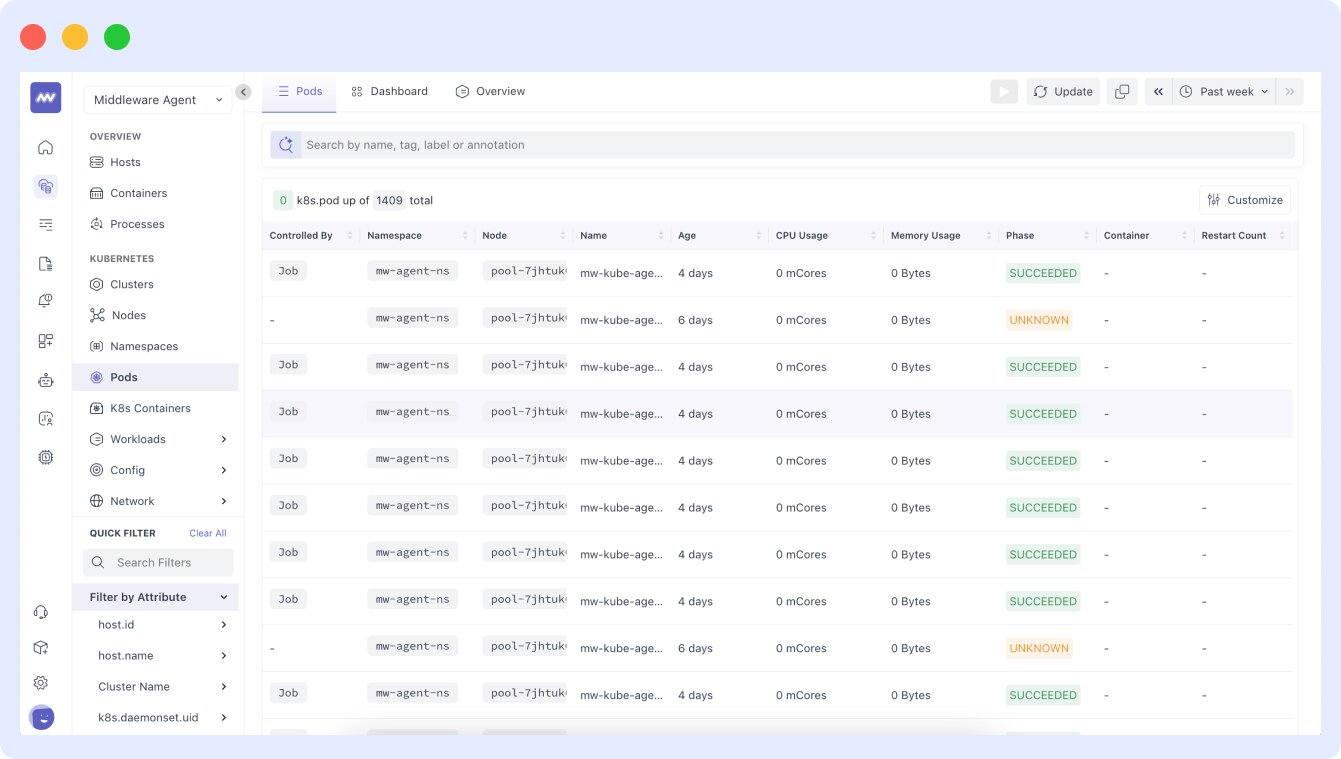
- In the dashboard, the pods are displayed in sequential order with their names and UIDs, as shown in this image:
- The Middleware agent is also equipped to provide granular visibility into the CPU usage of your pods, allowing you to view a typical CPU usage dashboard for pods.
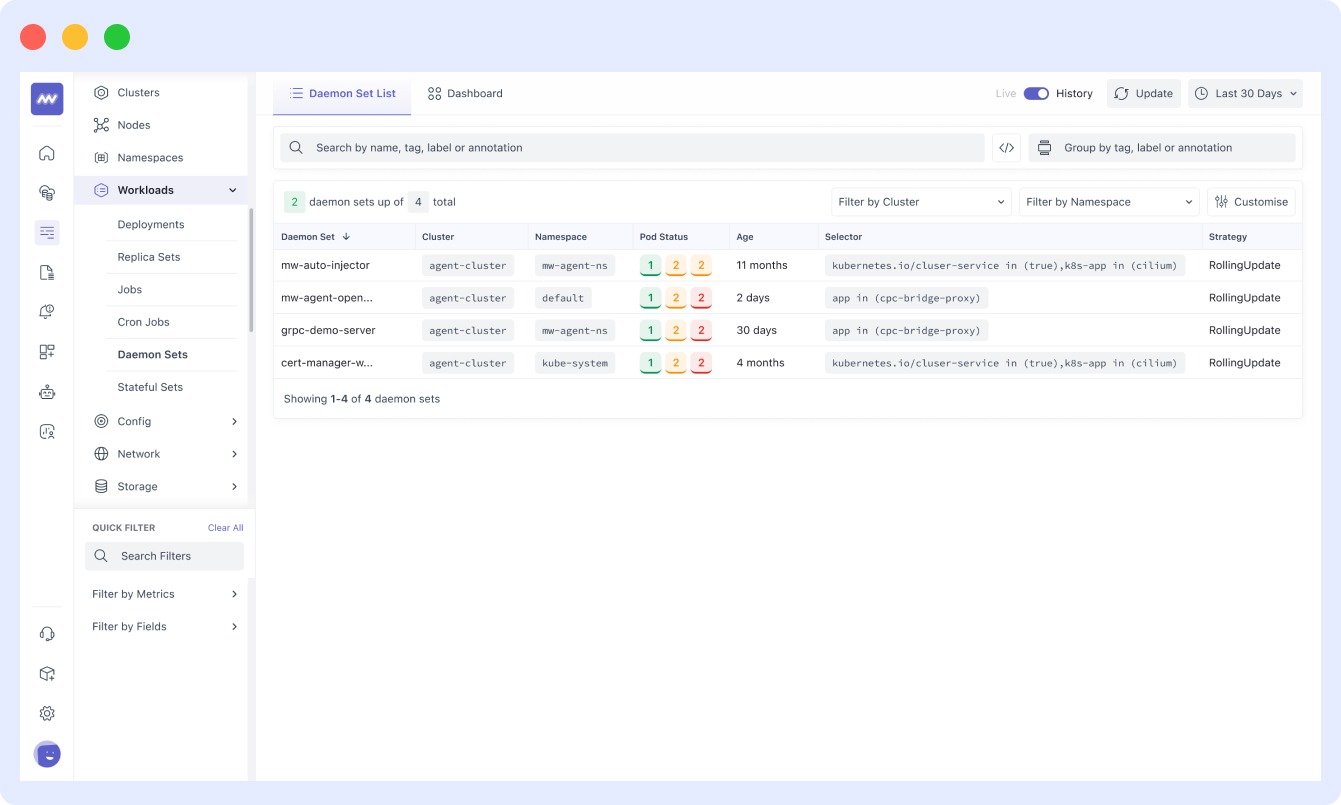
- Middleware monitors and collects metrics for DaemonSets, which facilitate the deployment of ongoing background tasks on specific nodes or all nodes as needed. This includes metrics for all daemons, including storage and log collection. A typical DaemonSet monitoring setup is displayed below:
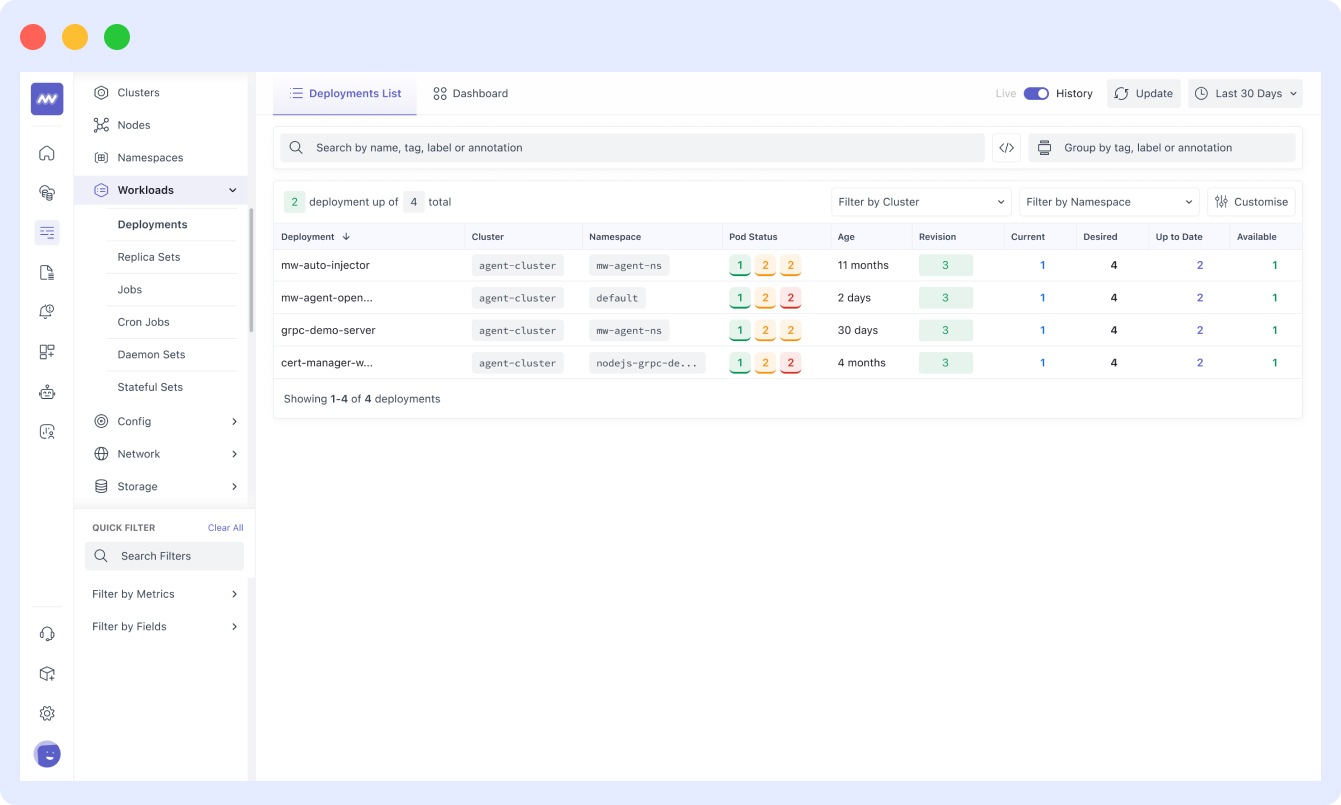
- In the Kubernetes dashboard of Middleware, you can also monitor the status and activity of your deployments:
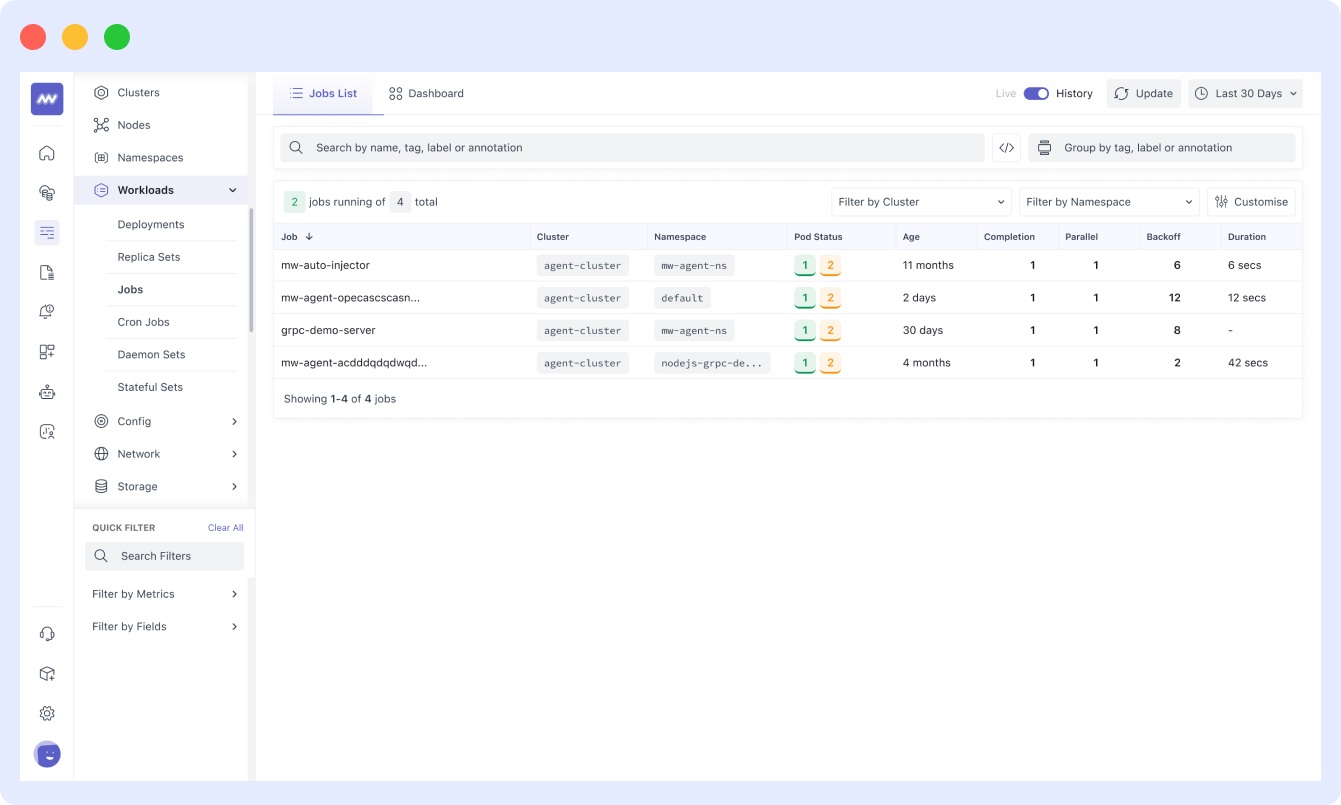
And even jobs:
Overall, Middleware offers a comprehensive Kubernetes container monitoring solution.
Get started monitoring your Kubernetes here.
Kubernetes monitoring best practices
When monitoring or attempting to monitor Kubernetes clusters, you must follow certain best practices for the best results.
Let’s dive in!
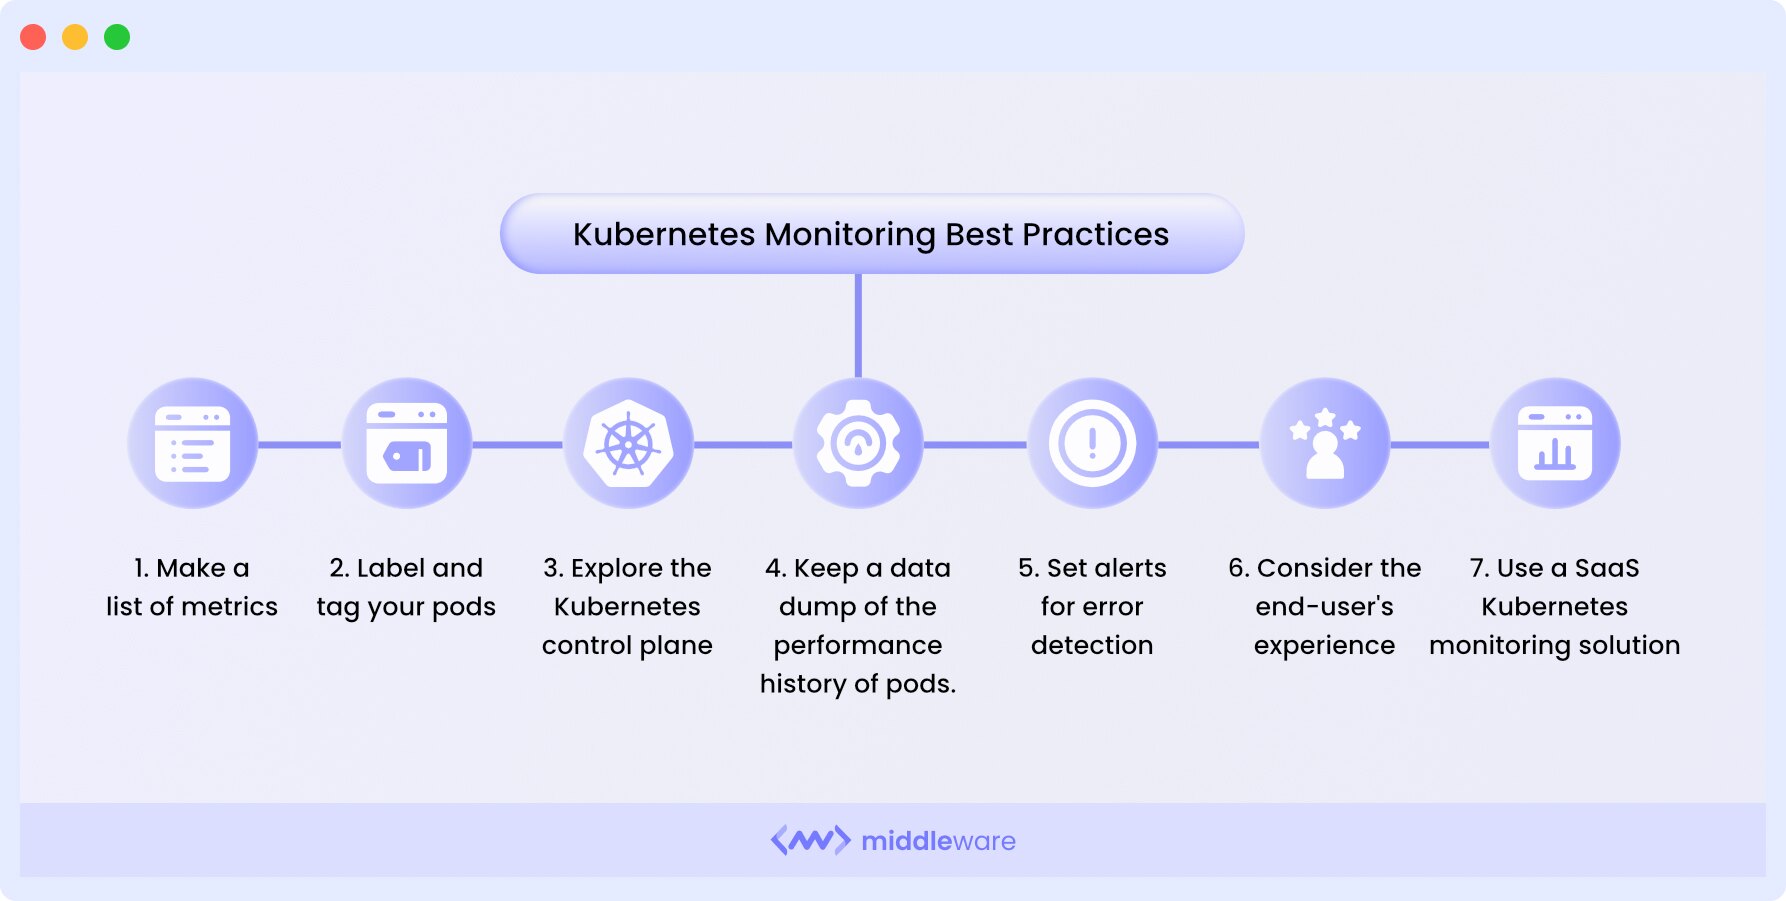
1. Compile a list of metrics
Begin by creating a comprehensive list of metrics that require monitoring. These metrics should encompass cluster nodes, pods, applications, and associated resources to ensure thorough coverage.
2. Label and tag your pods
In a Kubernetes environment with a multitude of containers, effective labeling and systematic tagging are imperative. Labels and tags can be tailored to the specific application or location, facilitating straightforward and comprehensive cluster filtering.
3. Inspect the Kubernetes control plane
Regularly examine the Kubernetes control plane to access detailed insights into cluster performance and detect potential issues within Kubernetes microservices. This API metric offers comprehensive visibility into Kubernetes clusters.
4. Maintain historical data
Keep a historical record of pod performance, enabling in-depth root cause analysis of problems and providing insights for future component enhancements. This historical data also aids in predicting the future performance of your clusters.
5. Configure alerts
Establish alerts for error detection and system performance reporting. Ensure that alerts are configured only for significant, actionable events to prevent unnecessary distractions and alert fatigue. Alerts can be set to trigger push notifications, emails, or pager notifications.
6. Monitor user interactions
Enhance the end-user experience by configuring monitoring settings in your application to detect and provide insights into user interactions. This approach contributes to usability improvements and a smoother front-end experience.
7. Utilize Kubernetes monitoring tools
Consider employing a SaaS Kubernetes monitoring solution that offers detailed analysis and granular visibility into every component of your clusters and the broader Kubernetes ecosystem.
While Kubernetes itself provides system monitoring capabilities, dedicated tools are often necessary to comprehensively cover Kubernetes ecosystem scenarios.
Choose a monitoring solution that streamlines the monitoring process without sacrificing granularity in your Kubernetes object visibility.
Top 4 Kubernetes monitoring tools
While there are several out-of-the-box Kubernetes monitoring tools available for monitoring the health and performance of Kubernetes clusters, very few provide the granular visibility required for effective monitoring.
Here are four of the most efficient Kubernetes monitoring tools:
1. Middleware
Middleware is a full-stack observability platform that offers Kubernetes monitoring solutions for both traditional and microservice-based applications deployed on Kubernetes.
It collects metrics, events, and logs from your cluster components, workload pods, and other Kubernetes objects in real-time. Additionally, it allows you to set up alerts and notifications for the metrics that matter most to you.

To begin, simply install the agent. Once it’s successfully installed, Middleware will start monitoring the nodes in your Kubernetes clusters.
Middleware uses an eBPF-based kernel agent, which is lightweight and easy to install. It allows you to consolidate multiple datasets into a single dashboard.
Middleware’s APM and distributed tracing offer insights into applications running within your Kubernetes clusters.
Middleware also offers numerous out-of-the-box reports, custom dashboards, charts, and alerts to save you time.
Sign up for free and install the Middleware agent to get started Kubernetes monitoring!
2. Datadog
Datadog is an APM solution that extracts real-time logs, metrics, events, and service states from Kubernetes. It allows you to monitor, troubleshoot, and optimize application performance.
Datadog features dashboards with high-resolution metrics and events for graphing and manipulation. You can deploy the Datadog agent using a DaemonSet, which runs on every cluster node.
The Datadog Agent is easy to install and integrates well with other infrastructures, but Datadog pricing is a major concern for almost all users, and apart from that, their log integrations may appear confusing to beginners.
3. Dynatrace
Dynatrace simplifies monitoring K-native and managed services, such as OpenShift, EKS, AKS, GKE, IBM IKS, and others. By deploying and managing the Dynatrace OneAgent Operator, it tracks cluster availability, health, and resource utilization.
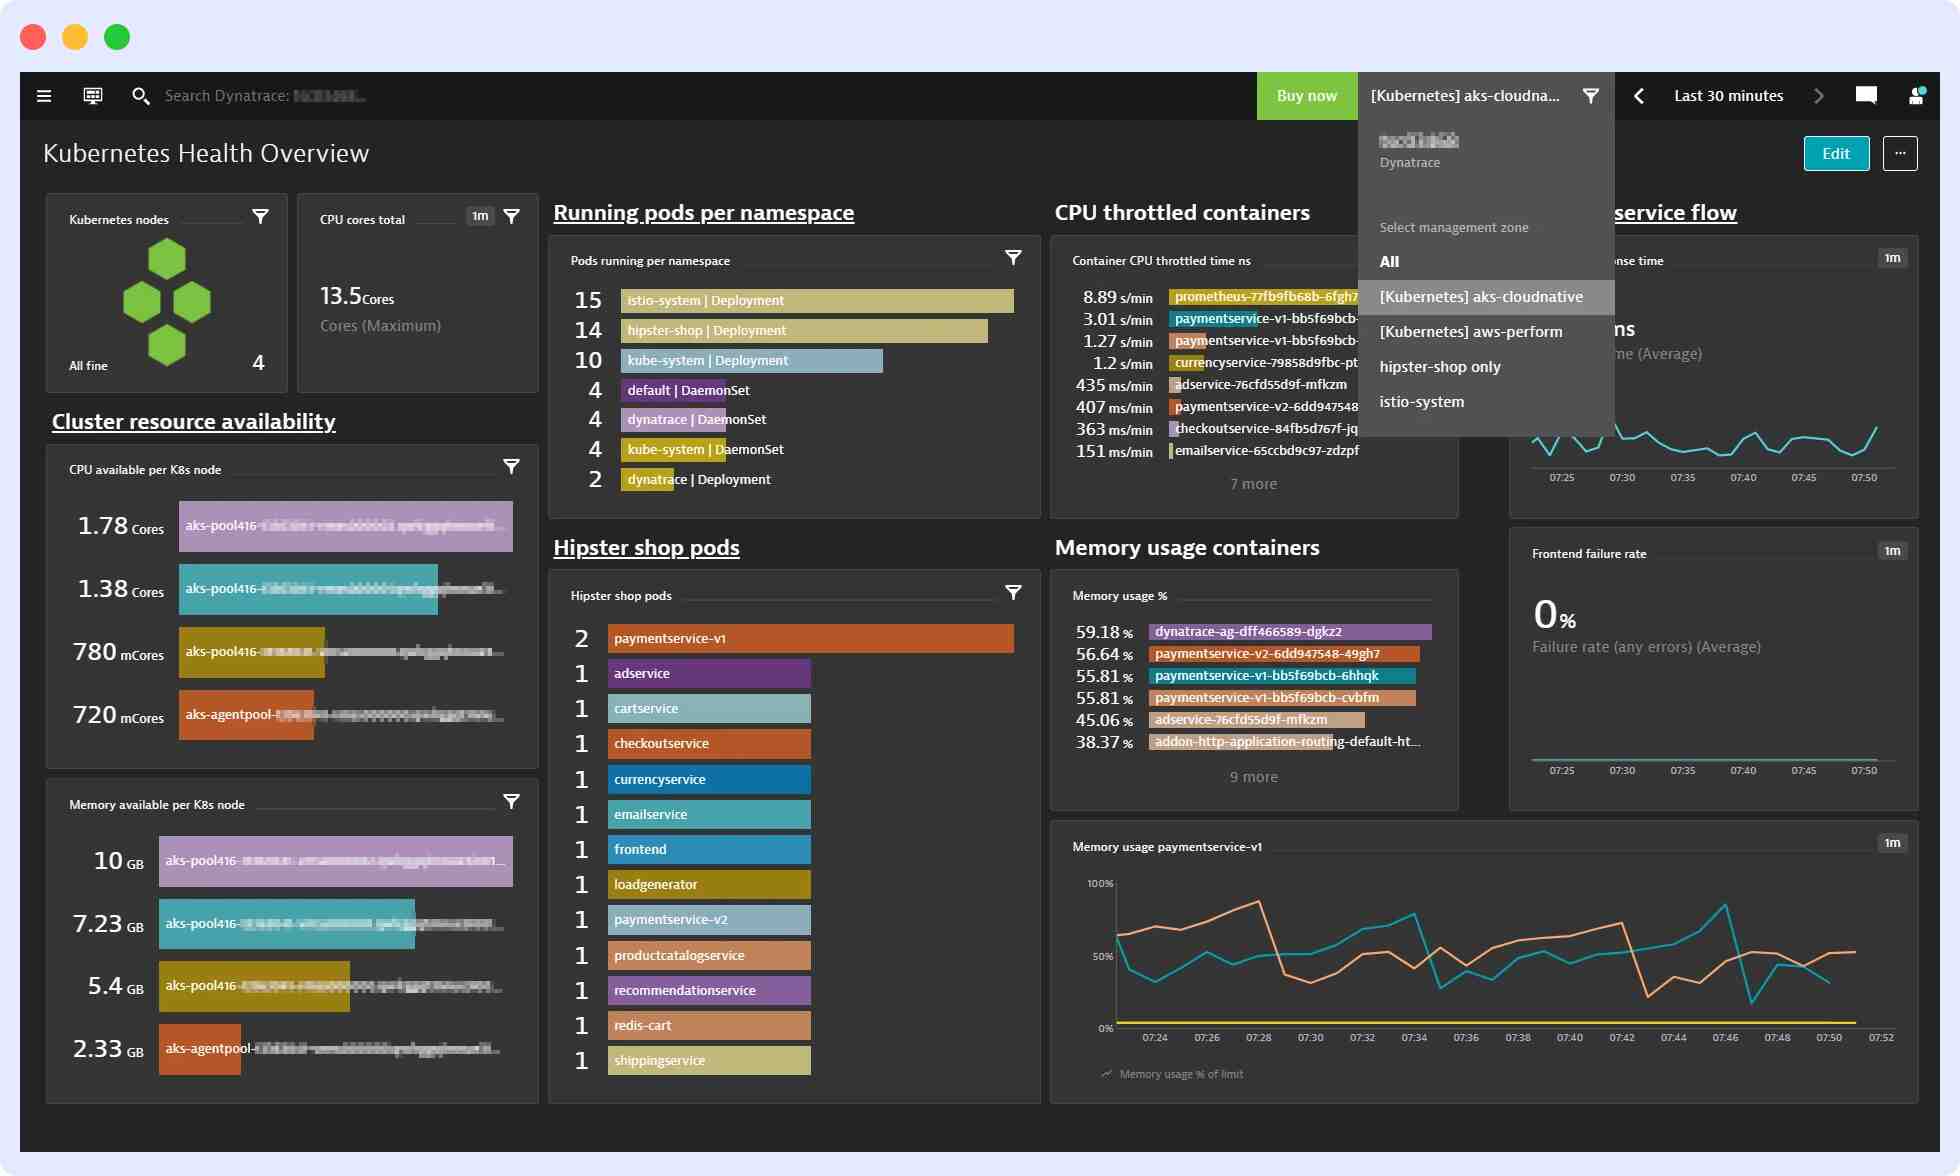
Dynatrace is easy to install but can be costly, and fully maximizing its monitoring capabilities can be challenging due to a steep learning curve.
4. Kubernetes Dashboard
The Kubernetes Dashboard is a web-based user interface for Kubernetes. It can be used to deploy containerized applications to a Kubernetes cluster, receive an overview of the applications running on the cluster, and manage cluster resources.
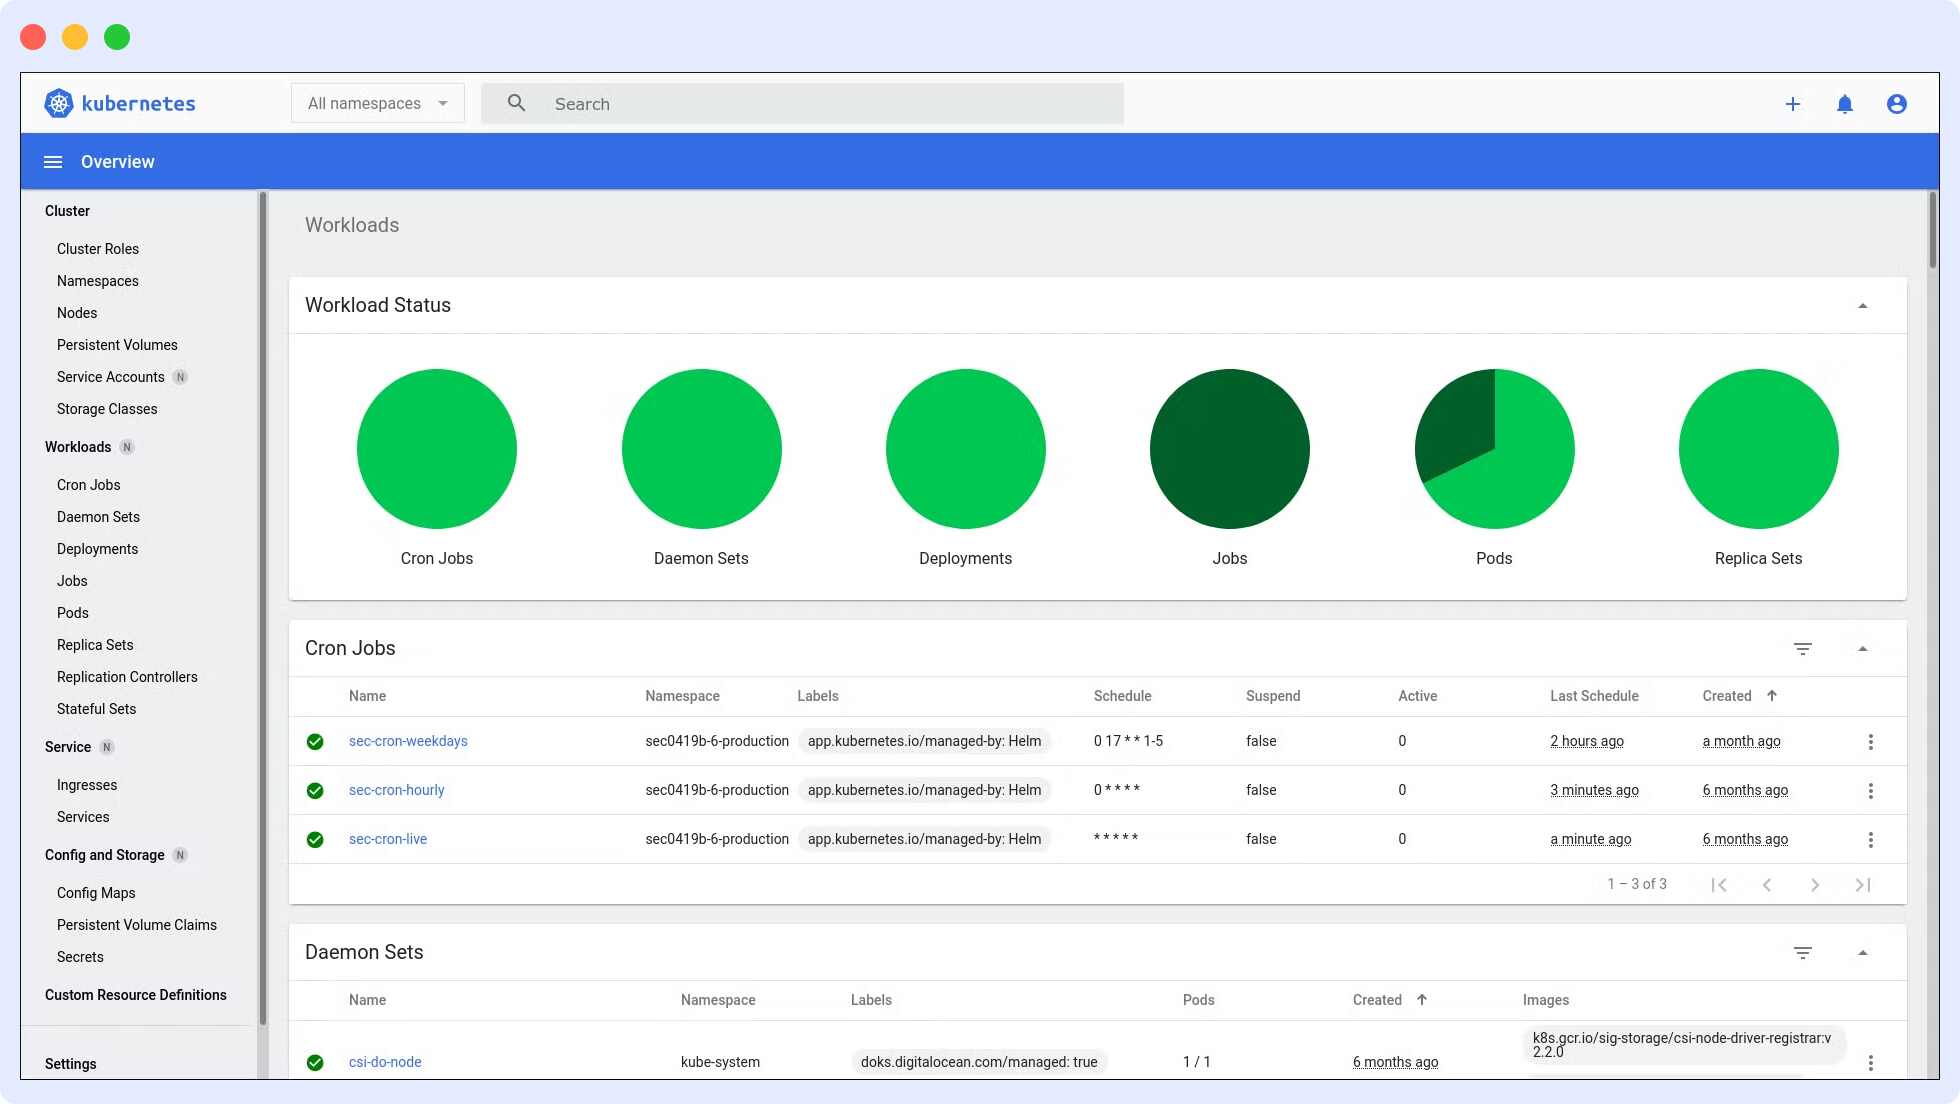
Additionally, it can be used to troubleshoot containerized applications by analyzing data on the health of your Kubernetes cluster’s resources and any faults that may have occurred.
Individual Kubernetes resources, such as deployments, jobs, DaemonSets, and StatefulSets, can be created or modified using the Kubernetes Dashboard. You can also manage Kubernetes directly through the Kubernetes Dashboard.
Conclusion
Kubernetes enables the deployment of numerous containerized applications within its clusters, each containing nodes responsible for managing the containers. Efficient observability across these machines and components is crucial for the effective orchestration of Kubernetes containers.
Kubernetes includes built-in monitoring features for its control plane, but they may not provide the depth needed for detailed analysis and granular visibility into application workloads, event logging, and other microservice metrics within Kubernetes clusters.
For this reason, many organizations seek Software-as-a-Service (SaaS) monitoring solutions to gain comprehensive visibility. Middleware offers an end-to-end monitoring solution tailored for Kubernetes, helping organizations monitor Kubernetes and its associated infrastructure. It seamlessly integrates with existing tools and infrastructure.
Consider exploring Middleware’s Kubernetes performance monitoring solution for enhanced visibility and efficiency.
Get started with a free trial today.
FAQ
What is Kubernetes?
Kubernetes, often referred to as ‘K8s,’ is an open-source orchestration tool designed by Google and later donated to the Cloud Native Computing Foundation (CNCF). It is a robust solution for managing containerized application clusters, delivering OS-like services at the cloud level.
How do you monitor Kubernetes?
There are two main ways to monitor Kubernetes: using the DaemonSets approach or employing Heapster.
Both of these methods help collect metrics from the cluster and transmit them to an external endpoint for further analysis.
What is the best monitoring tool for Kubernetes?
While there are several tools available for monitoring Kubernetes, independent user research and reviews have shown that Middleware is considered the best monitoring tool for Kubernetes.
Nonetheless, it’s essential to consider your specific requirements and evaluate available tools to determine the most suitable one for your needs.
What are the benefits of Kubernetes monitoring?
Monitoring Kubernetes offers several advantages, including:
- Improved workload management and optimization
- Real-time alerts for proactive issue resolution
- Early error detection to prevent downtime
- Simplified troubleshooting processes
- Real-time visibility into the cluster’s performance and health
What metrics do I need to monitor in Kubernetes?
Monitoring Kubernetes involves tracking various metrics to ensure the cluster’s smooth operation and application health. Key metrics to monitor include:
- Kubernetes cluster metrics: These provide comprehensive insights into your cluster’s status and performance.
- Control plane metrics: Monitoring these metrics ensures the proper functioning of the Kubernetes control plane.
- Kubernetes nodes metrics: Keep an eye on node performance and health.
- Pod metrics: Monitor the health and performance of individual Pods.
- Application metrics: Track overall application health and performance for a complete view of your system.
How do I monitor Kubernetes logs?
To monitor Kubernetes logs, you can access the kubelet logs through the Kubernetes dashboard or use a third-party monitoring tool like Middleware, which offers a user-friendly dashboard for log monitoring.