Kubernetes is the most utilized open-source tool for container orchestration, allowing the deployment of applications in their hundreds.
DevOps engineers find it reliable and resilient for deploying, managing, and scaling their containerized applications. Kubernetes also has a self-healing architecture enabling its clusters to add, remove, or replace pods.
Despite these functionalities, Kubernetes is not omniscient—Kubernetes manages the containers running several applications but does not monitor the health of the infrastructures that host the containers.
These infrastructures include the nodes in the Kubernetes clusters, which are the physical and virtual machines connected over a network.
This diversity of functions and numerous moving parts make the Kubernetes architecture complex and call for observability.
This article highlights the importance of Kubernetes observability, the components to be observed, and observability best practices.
What is Kubernetes observability?
Kubernetes observability is the practice of monitoring and discerning the activities of the Kubernetes system and its infrastructures to detect and diagnose issues. It involves collecting data from all parts of the system and making it available for analysis. These data sources include metrics, logs, and traces.
For a well-performing deployed application, it is essential to observe the health of your servers, including the disk space, memory, and CPU, and keep them patched.
Even if you’re running on a public cloud, keeping track of the usage is important for provisioning additional capacities when needed.
Observability helps you make data-driven decisions that help maintain overall system health and availability while reducing the risk of downtime or system failure.
As a DevOps engineer, an effective Kubernetes observability tool is important to your arsenal. It provides information that helps you identify bottlenecks and troubleshoot issues such as system resource contention, misconfigured pods, and network connectivity problems.
The role of metrics, logs, and traces in K8s observability
Metrics, logs, and traces are the triad pillars of observability in Kubernetes. The following is an overview of their role:
Metrics
Kubernetes metrics are quantitative data on the performance of the Kubernetes environment, such as CPU usage, network utilization, and memory consumption.
When metrics are collected and stored by an observability tool, they are used to identify bottlenecks, troubleshoot performance issues, optimize resource allocation, and make informed decisions about scaling.
Additionally, you can leverage metrics for capacity planning, forecasting, and alerting. Metrics are gathered using observability tools.
Logs
Kubernetes logs provide insight into the events and activities of nodes, containers, and other core components of the Kubernetes architecture.
Logs can be used for debugging, troubleshooting, and auditing, as they offer a detailed view of errors, warnings, and other events.
You can use them to identify error messages, track changes in configuration settings, monitor resource consumption, and more.
In addition to providing operational insights, logs are important to compliance and audit efforts.
Organizations are often required to maintain records of system events, and logs provide an accurate snapshot of system activity at any given time.
This kind of reporting can be particularly helpful in demonstrating compliance with security standards or legal requirements, which is why logging is considered a critical part of observability in Kubernetes.
Traces
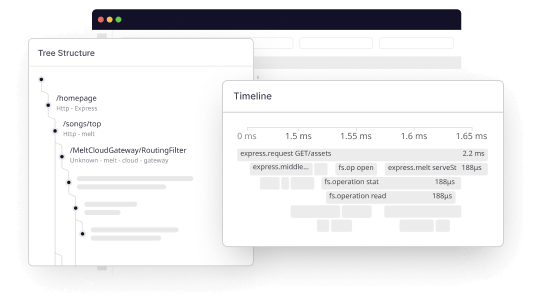
Kubernetes traces capture the flow of requests through the application or system, giving DevOps engineers insight into the cause of any issues that arise.
In Kubernetes, traces are typically generated by applications and services deployed on the platform. They provide critical insights into the behavior of these applications and their interactions with the underlying Kubernetes infrastructure.
They enable you to follow a user request as it flows through the system, helping you to identify which services are involved in the transaction and how long each request takes to complete.
By analyzing the timing and duration of requests, you can identify areas for optimization.
In addition, traces can be used to identify patterns of behavior that might indicate a security breach or other suspicious activity.
Kubernetes observability & APM
As a DevOps engineer, effective APM is critical to ensuring the success of your organization’s applications.
Below are some ways Kubernetes observability intersects with APM:
Monitoring
Kubernetes observability tools provide DevOps engineers with a comprehensive view of the Kubernetes environment, from the application to the infrastructure level.
By analyzing performance data over time, you can identify useful patterns and optimize infrastructure and service configurations accordingly.
Real-time monitoring of application logs, metrics, and traces helps identify potential issues before they cause downtime and impact the business.
Root cause identification and analysis
If an issue arises, Kubernetes observability enables DevOps engineers to pinpoint the root cause of the problem quickly. Root cause analysis of problems helps you resolve issues promptly, reducing Mean Time to Repair (MTTR).
Incident management and troubleshooting
Kubernetes observability tools like Middleware automatically detect and alert you when there is a problem with the application. You can leverage the data analytics capabilities of the platform to troubleshoot performance problems.
This is vital because it reduces the scale of an incident by quickening resolution time. When issues persist, Kubernetes observability helps in incident management by identifying problem areas, isolating the issues, and containing the damage.
Capacity planning
Kubernetes observability tools help DevOps engineers to plan for future growth by analyzing usage data, resource utilization, and application performance trends to identify infrastructure bottlenecks and capacity constraints.
This enables you to scale the application and infrastructure as needed, ensuring that performance levels are maintained without overspending on infrastructure.
Simplify K8 Monitoring with Middleware. Get started free.
Performance Enhancements
By monitoring application performance metrics and identifying bottlenecks, DevOps engineers can optimize their applications and K8 deployments for better overall performance and user experience.
Data-led decision-making
At this point, it’s pretty clear that observability offers a complete picture of your K8 applications with actionable insights on every component that drives performance. This data removes any guess work enabling DevOps engineers to make better decisions about resource allocation, scaling, and overall infrastructure optimization.
Key challenges of Kubernetes observability
The following are key challenges associated with observability in Kubernetes:
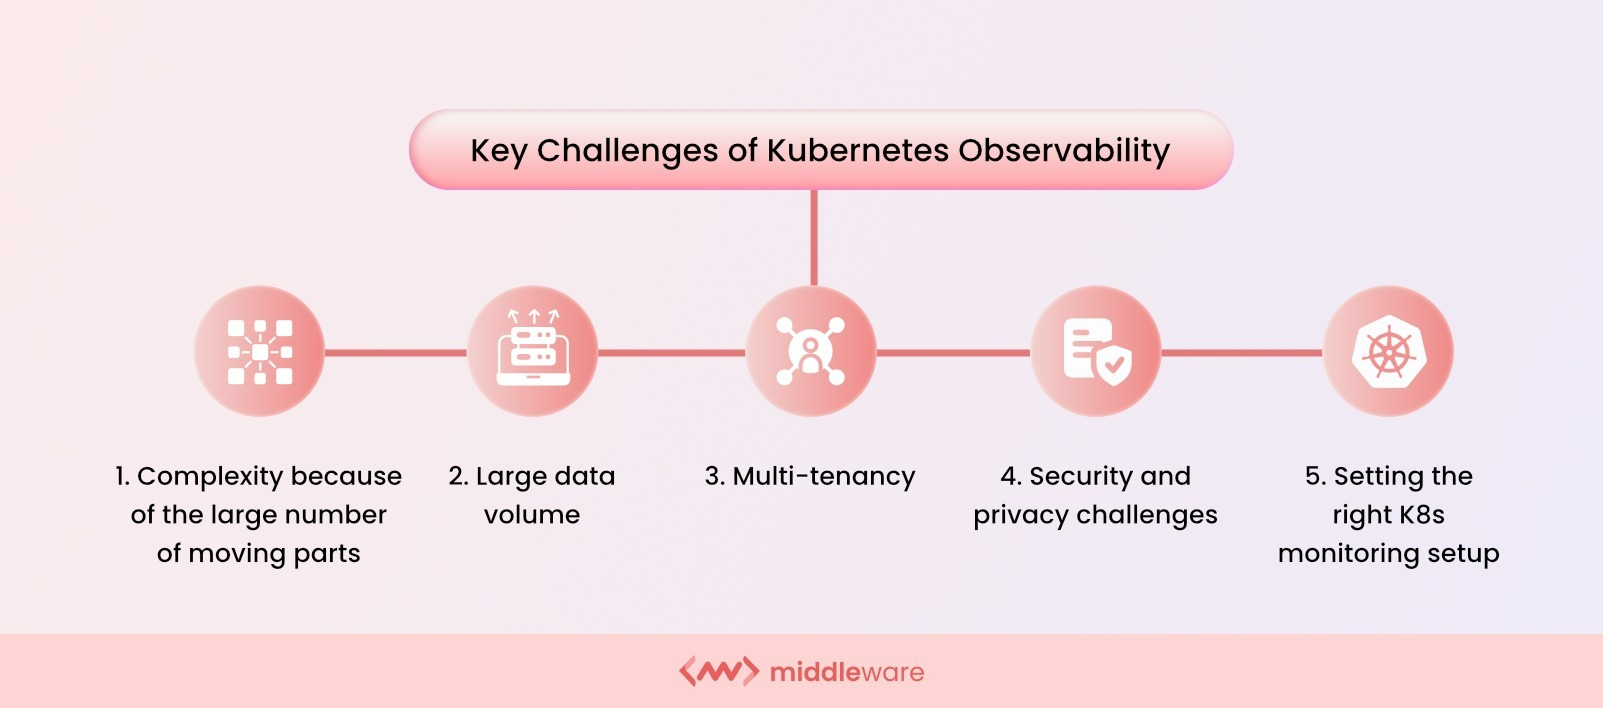
Kubernetes complexity
Monitoring Kubernetes can be challenging because Kubernetes comprises several parts that must be monitored. Kubernetes distributes application components and services across multiple nodes, making it difficult to keep track of every component’s state, health, and associated resources.
As the number of components grows, observability becomes challenging. Monitoring and identifying which components are causing issues can take much time and effort.
If you’re evaluating orchestration choices alongside observability, this detailed guide on Docker Swarm vs Kubernetes breaks down which platform fits different use cases.
Large data volume
Kubernetes generates a lot of data, including logs, metrics, and traces. It, therefore, requires a centralized observability solution that can efficiently collect, store, and analyze it.
These solutions will include machine learning, artificial intelligence, and other complex algorithms to make sense of the available data for DevOps engineers.
Multi-tenancy
Kubernetes clusters are multi-tenant environments where multiple users can deploy their applications, services, and resources on shared infrastructure.
The clusters are often used by teams from different departments working on projects. This multi-tenancy can cause conflicts, making it harder to monitor system usage accurately.
Observability can become challenging when it comes to ensuring that teams have access only to the data that they are authorized to view.
Security and privacy challenges
The data processed within a Kubernetes cluster may be sensitive, requiring data privacy protection protocols. Organizations operating in the healthcare or finance sectors, for instance, impose strict requirements on data transmission and storage to maintain data integrity, confidentiality, and privacy.
Kubernetes observability can present security and privacy challenges since it requires access to sensitive data such as logs, tracing data, or critical system indicators.
Sensitive data, in some instances, must be managed with advanced security measures to ensure that only authorized individuals have access to it.
Setting the right K8s monitoring setup:
Operationalizing K8s observability requires a strategic approach that involves defining objectives, monitoring requirements, and monitoring tools to be used, among other things.
Monitoring configuration, troubleshooting, and maintenance must be handled with careful planning to avoid situations that may cause performance or security issues.
With a clear monitoring strategy in place, teams may know where to start when monitoring their Kubernetes environment effectively.
Kubernetes observability best practices
Following best practices will optimize your chances of full and efficient Kubernetes observability.
Below are key observability best practices to help you achieve better outcomes:
Define key performance indicators
Defining and prioritizing critical performance indicators within your application stack is necessary to obtain insights into your application and infrastructure’s behavior effectively.
Design and tailor the KPIs to your use cases and revisit them when necessary to reflect the application’s or infrastructure’s performance requirements.
The KPIs should include metrics for resource utilization, application performance, and system health.
Establish a clear monitoring strategy
To ensure the collation of the right data, you must develop a robust monitoring strategy that includes real-time user monitoring and historical data analysis. This will greatly help you during analysis and decision-making.
A monitoring strategy should establish monitoring requirements, define monitoring objectives, and select appropriate tools to achieve set objectives.
The strategy should also establish procedures for handling alerts and monitoring configurations to ensure that visibility and alerts are sent to the right parties.
Use a centralized logging solution
Kubernetes generates large data transmuted into logs, metrics, and events. It is stressful and counterproductive to monitor all these separately.
A centralized logging solution harmonizes application information from all relevant sources and funnels them into a unified interface.
Utilize distributed tracing
Distributed tracing provides a detailed view of how requests move through and across your applications or services. It can be useful when deciding which issues are urgent or which to prioritize for resolution.
Monitor resource utilization
To stay abreast of your infrastructure’s capacity usage and proactively scale resources when needed, you must collect real-time CPU, memory, and network usage data, among others.
Top 3 full-stack Kubernetes observability tools
Three of the best Kubernetes observability tools are:
Middleware
Middleware is a full-stack observability tool that allows users to monitor their applications, infrastructure, and networking from a single platform.
It offers K8 monitoring solutions for both traditional and microservice-based applications deployed on Kubernetes. Also, Middleware provides dynamic visualizations of Kubernetes clusters and real-time alerts for errors or performance issues.
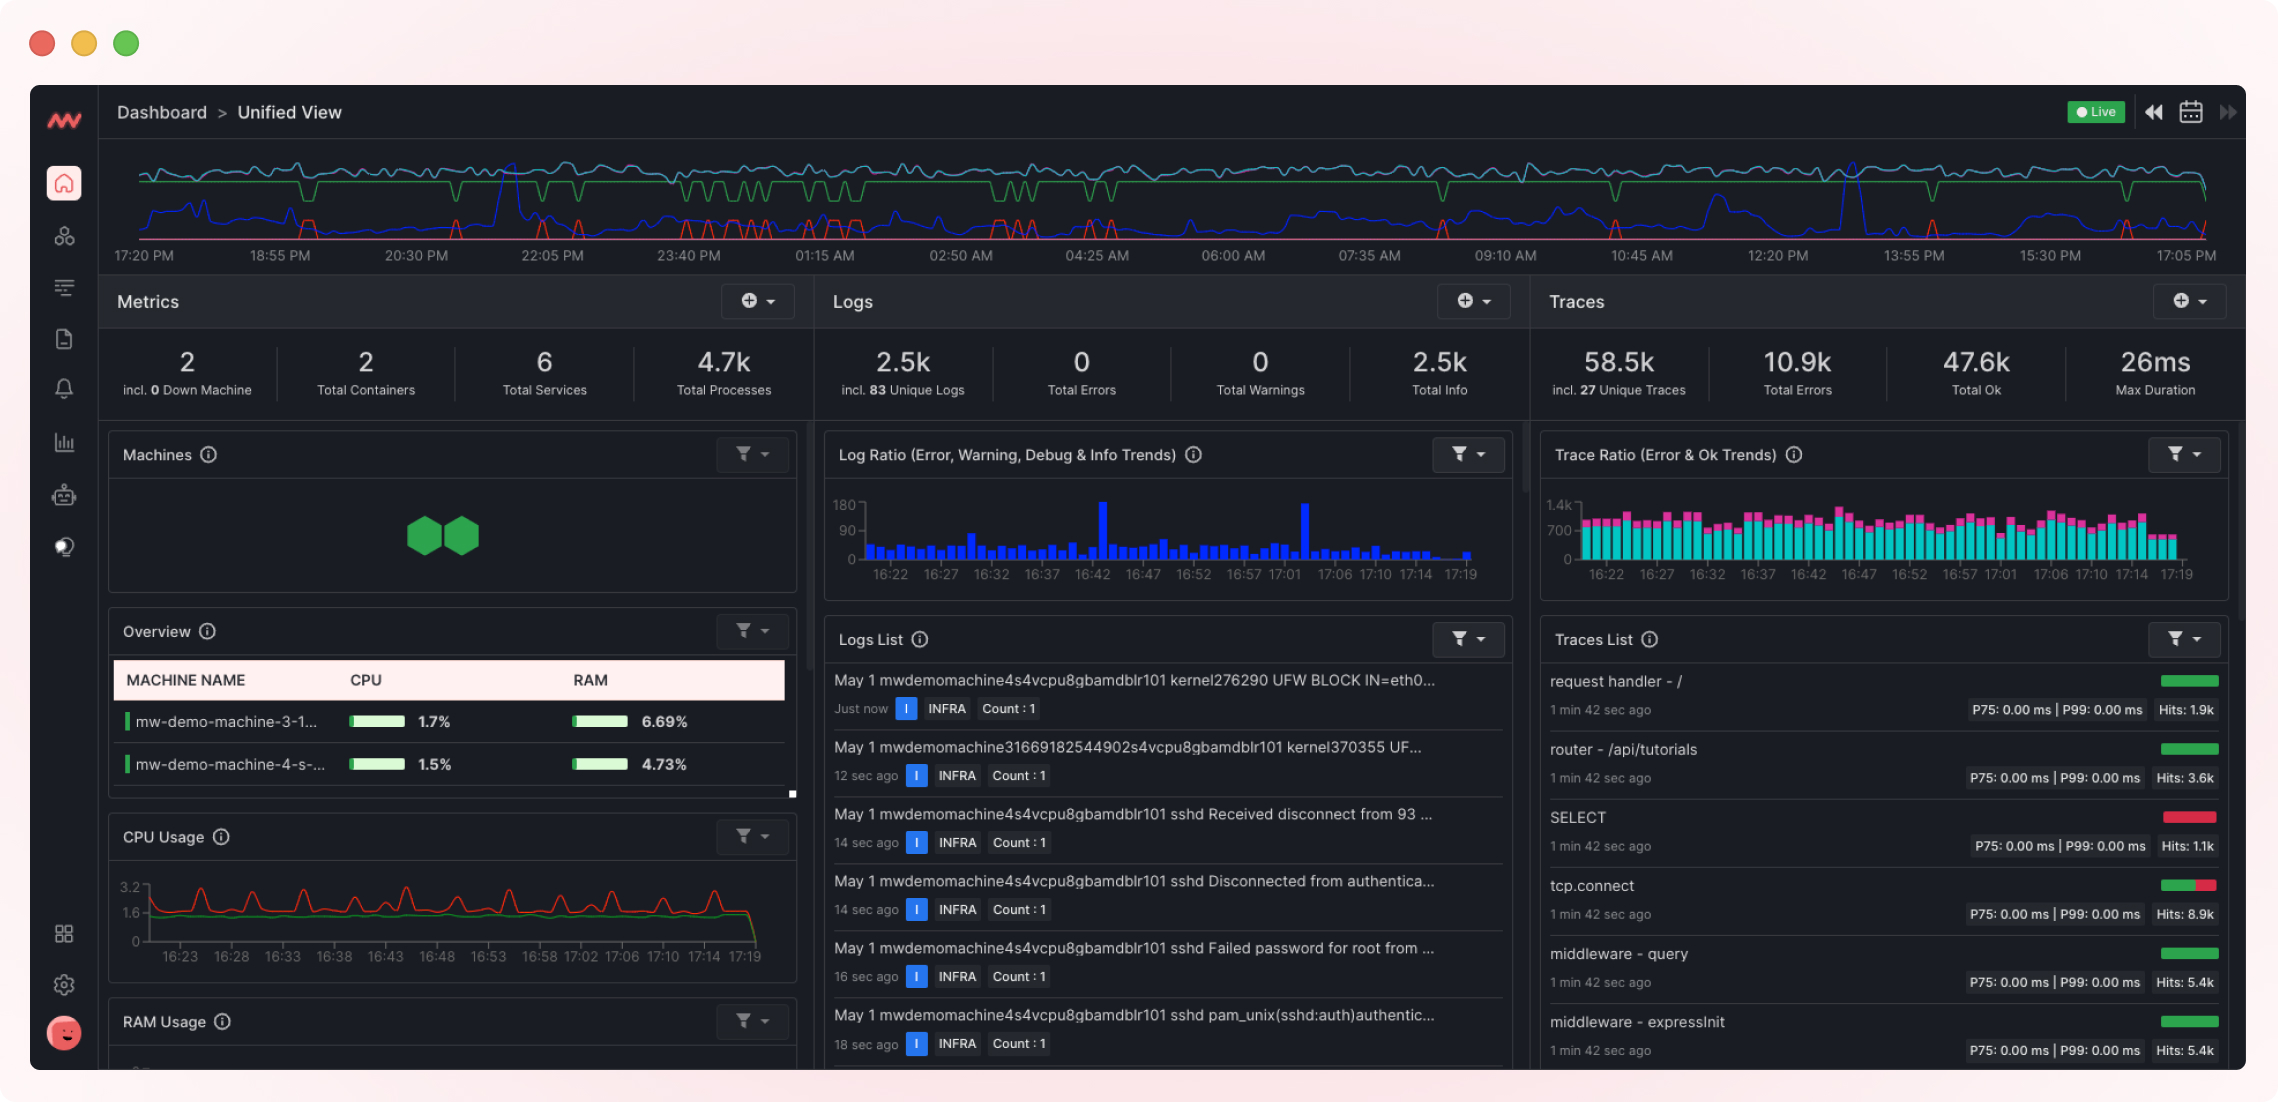
Middleware also includes log aggregation, metric analysis, and distributed tracing features. DevOps engineers can identify and diagnose problems across the stack, from the application code to the underlying infrastructure.
Interestingly, Middleware uses an eBPF-based kernel agent, which is inherently lightweight and easy to install. With a few clicks, developers can consolidate multiple datasets into a single dashboard.
These dashboards are completely customizable too! Middleware also offers APM and distributed tracing that can give you insights into applications running within your Kubernetes clusters.
You can start monitoring K8 apps by simply installing the Middleware agent. If done right, the platform starts monitoring the nodes in your Kubernetes clusters in less than 60 seconds.
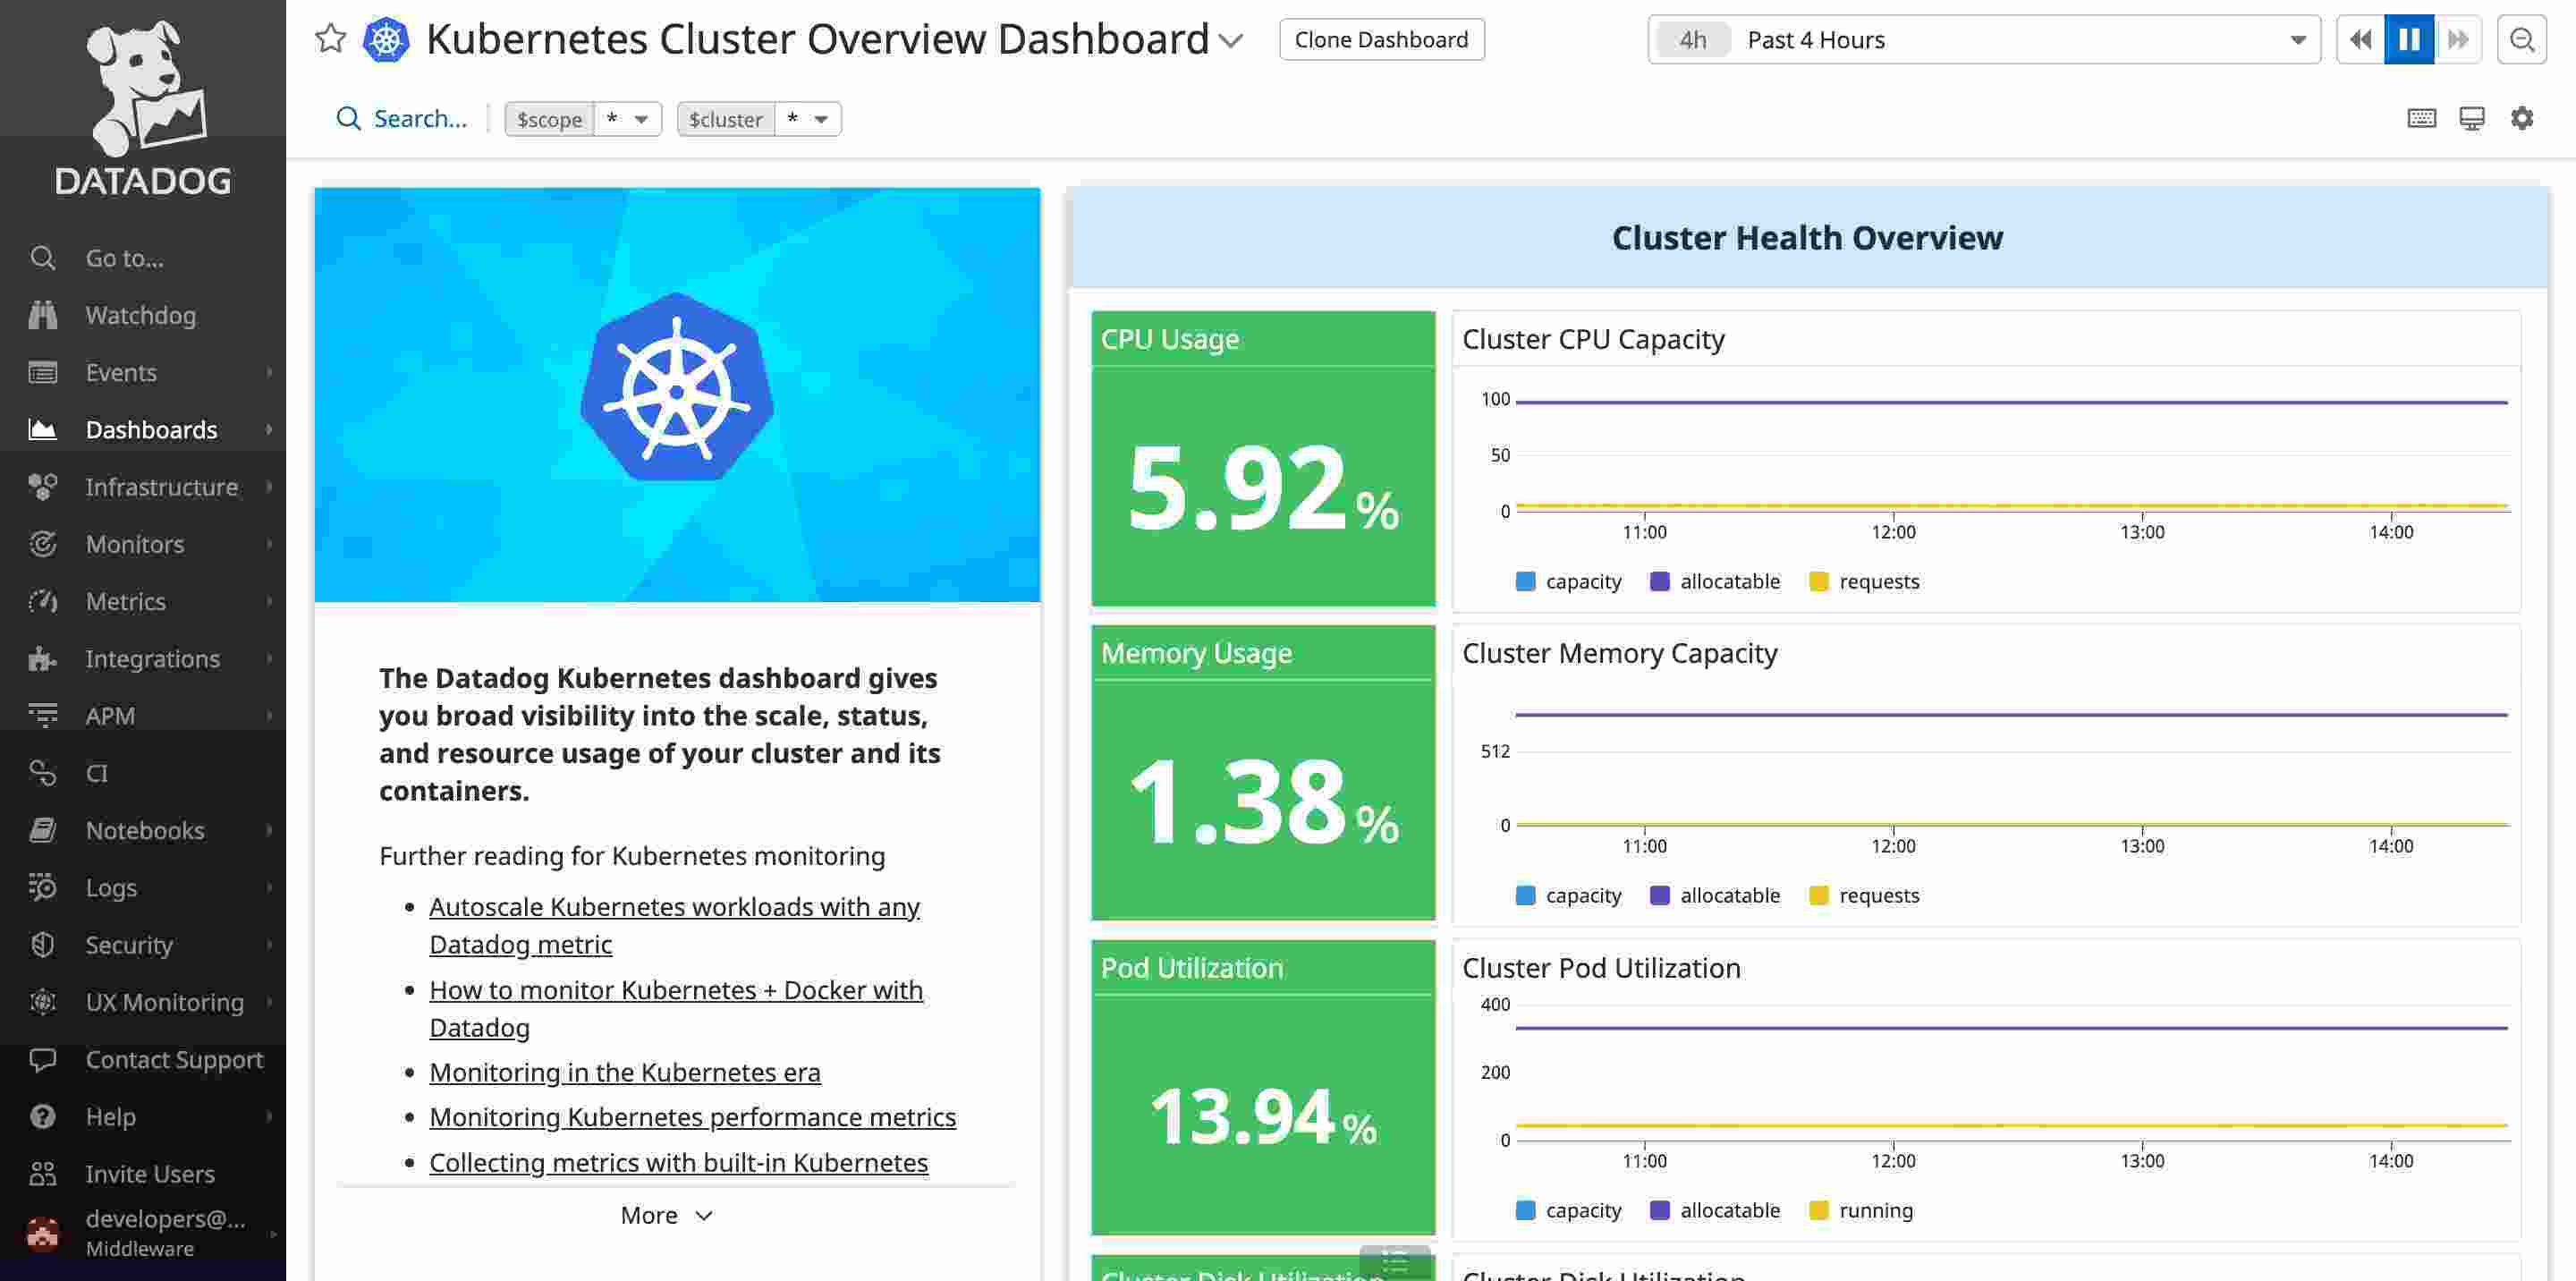
Datadog
Datadog is an observability platform that provides real-time monitoring and alerting for Kubernetes environments. It aggregates and organizes data from various sources to provide a clear picture of an organization’s Kubernetes infrastructure.
Datadog also integrates with a wide range of other tools and services, making it easy to build a comprehensive observability strategy.
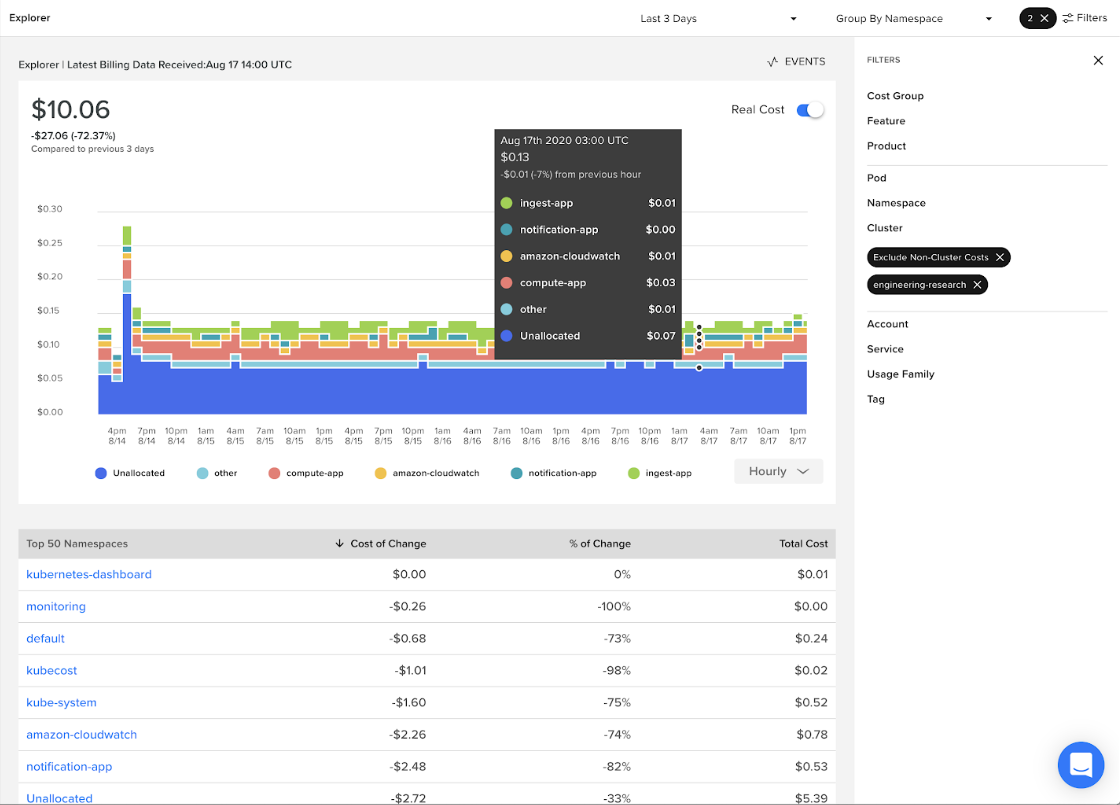
Cloudzero
Cloudzero is a cloud-native observability platform that provides cost-based insights into the financial implications of Kubernetes deployments.
Combining real-time monitoring, tracing, and financial analytics, CloudZero helps synergize between the technical and business ends of Kubernetes orchestration.
Conclusion
Kubernetes observability is an important aspect of managing modern application deployments. The key to effective observability is to prioritize monitoring, establish a clear strategy, and ensure the collection and analysis of data in all areas of the Kubernetes environment.
Using the right tool, such as Middleware, you can keep your Kubernetes environments running efficiently, minimizing downtime and ensuring optimal performance.
Sign up now to see it in action.