Modern applications operate across multiple servers, containers, and cloud instances, making it nearly impossible to manage everything manually. When something goes wrong, such as a slow response time or the system crashing, you want to know exactly what happened and where it occurred. That’s where observability and the ongoing Grafana vs Datadog debate come into play.
These observability tools allow you to monitor, visualize, and troubleshoot your entire IT infrastructure in real-time, helping you maintain system performance and reliability. Both tools help keep your system’s health, but each takes a different approach to achieve this. Grafana is more flexible and more customizable than Datadog. Datadog aggregates all data into a single monitoring platform. This choice can make or break your monitoring strategy, so let’s examine which monitoring solution best suits your needs.
Platform Overview
Grafana
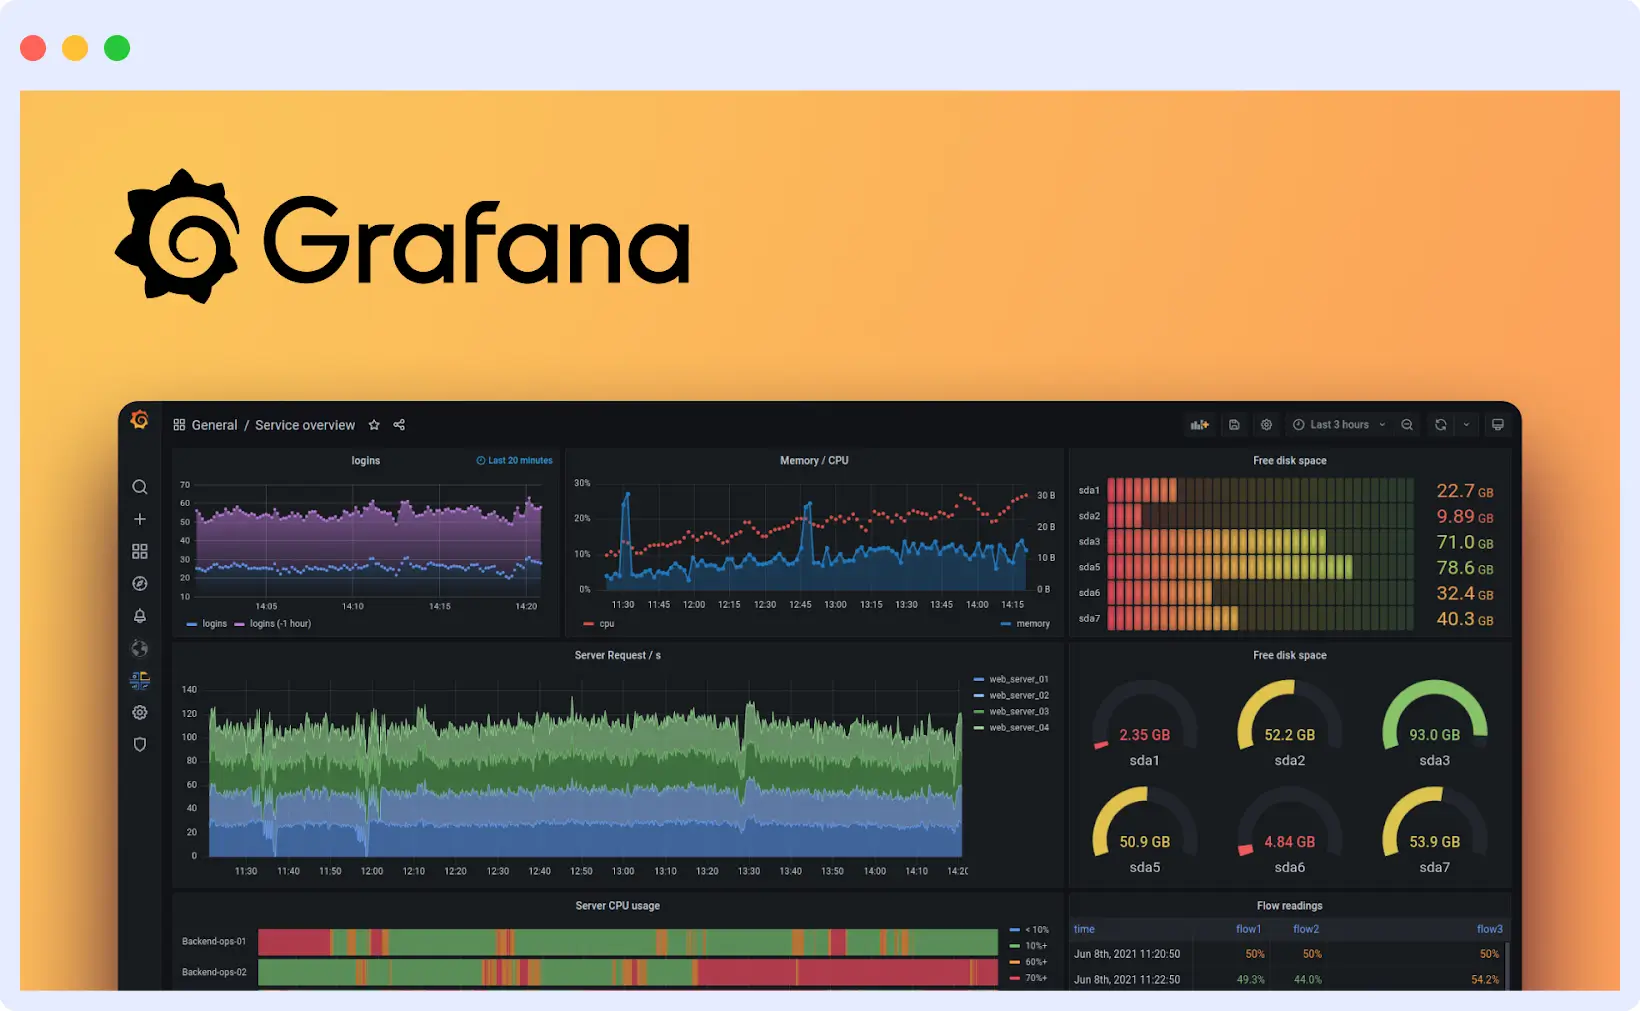
Grafana is an open-source project that has evolved into a go-to solution for teams that value customization. Often described as the Swiss Army knife of data visualization, Grafana can connect to nearly any data source and deliver beautiful, highly flexible dashboards.
Whether you’re pulling metrics from Prometheus, logs from Elasticsearch, or insights from your database, Grafana integrates seamlessly. It’s an ideal choice for teams that already have monitoring tools in place and want to elevate their observability through enhanced visualization. With an active community contributing thousands of plugins and pre-built dashboards, getting started is rarely from scratch.
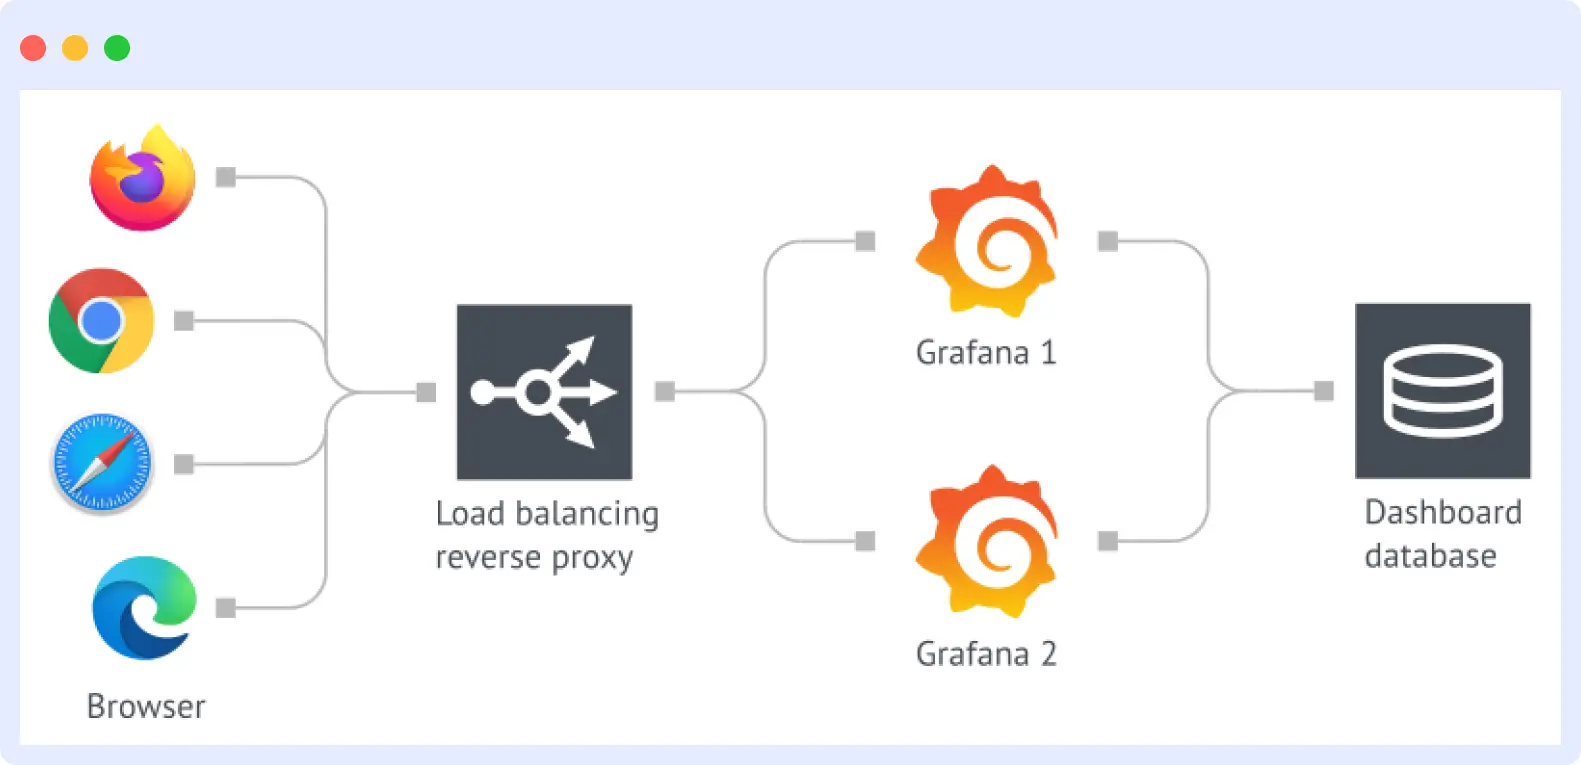
Grafana can be deployed in three ways:
Grafana Enterprise: Designed for large organizations with advanced needs, offering additional commercial features and support.
Open-source, self-hosted version: Ideal for teams that want full control and have in-house resources to manage the infrastructure.
Grafana Cloud: A managed service that removes the burden of hosting and maintenance.
Key Considerations:
- You can start small and scale gradually as your observability needs grow.
- Due to its high flexibility and customization, Grafana typically requires additional setup and configuration compared to all-in-one platforms.
According to users who switched, Middleware delivers 3× better data correlation and 4× faster troubleshooting compared to Grafana — all with a one‑minute installation.
Datadog
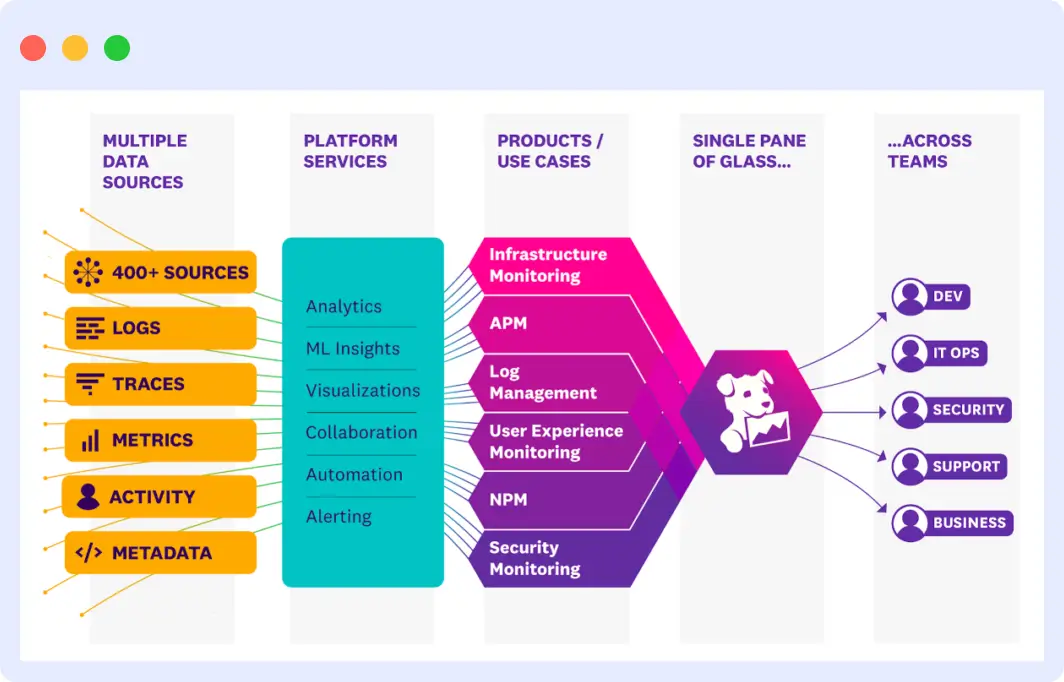
Datadog is fundamentally different from traditional monitoring tools. It’s a platform that works out of the box. Instead of piecing together various tools for metrics, logs, traces, and APM, Datadog delivers everything in one unified, cloud-controlled environment.
Once installed, Datadog automatically ingests data from your applications and infrastructure with minimal configuration. Whether you’re running on AWS, Docker, Kubernetes, or using frameworks like Django, Ruby on Rails, Spring Boot, Datadog likely already has a pre-built integration. This reduces the weeks of effort typically required to stitch together a custom monitoring stack.
Since all data resides in Datadog’s cloud, there’s no need to maintain servers or handle software upgrades. You benefit from automatic updates, built-in security, and the ability to scale independently without worrying about infrastructure planning or licensing.
Datadog is ideal for teams that want enterprise-grade monitoring without the complexity of managing it themselves. It enables organizations to focus on building products, not maintaining monitoring systems.
Grafana vs Datadog Key Feature Comparison
Data Collection and Integration
Grafana is like a smart LED TV that connects to your existing monitoring tools. You need to create the connections with data sources, such as Prometheus to gather metrics or Elasticsearch to collect logs. After the connections, Grafana excels at displaying time-series data with visually appealing charts. It is a unified dashboard where you can connect various devices.
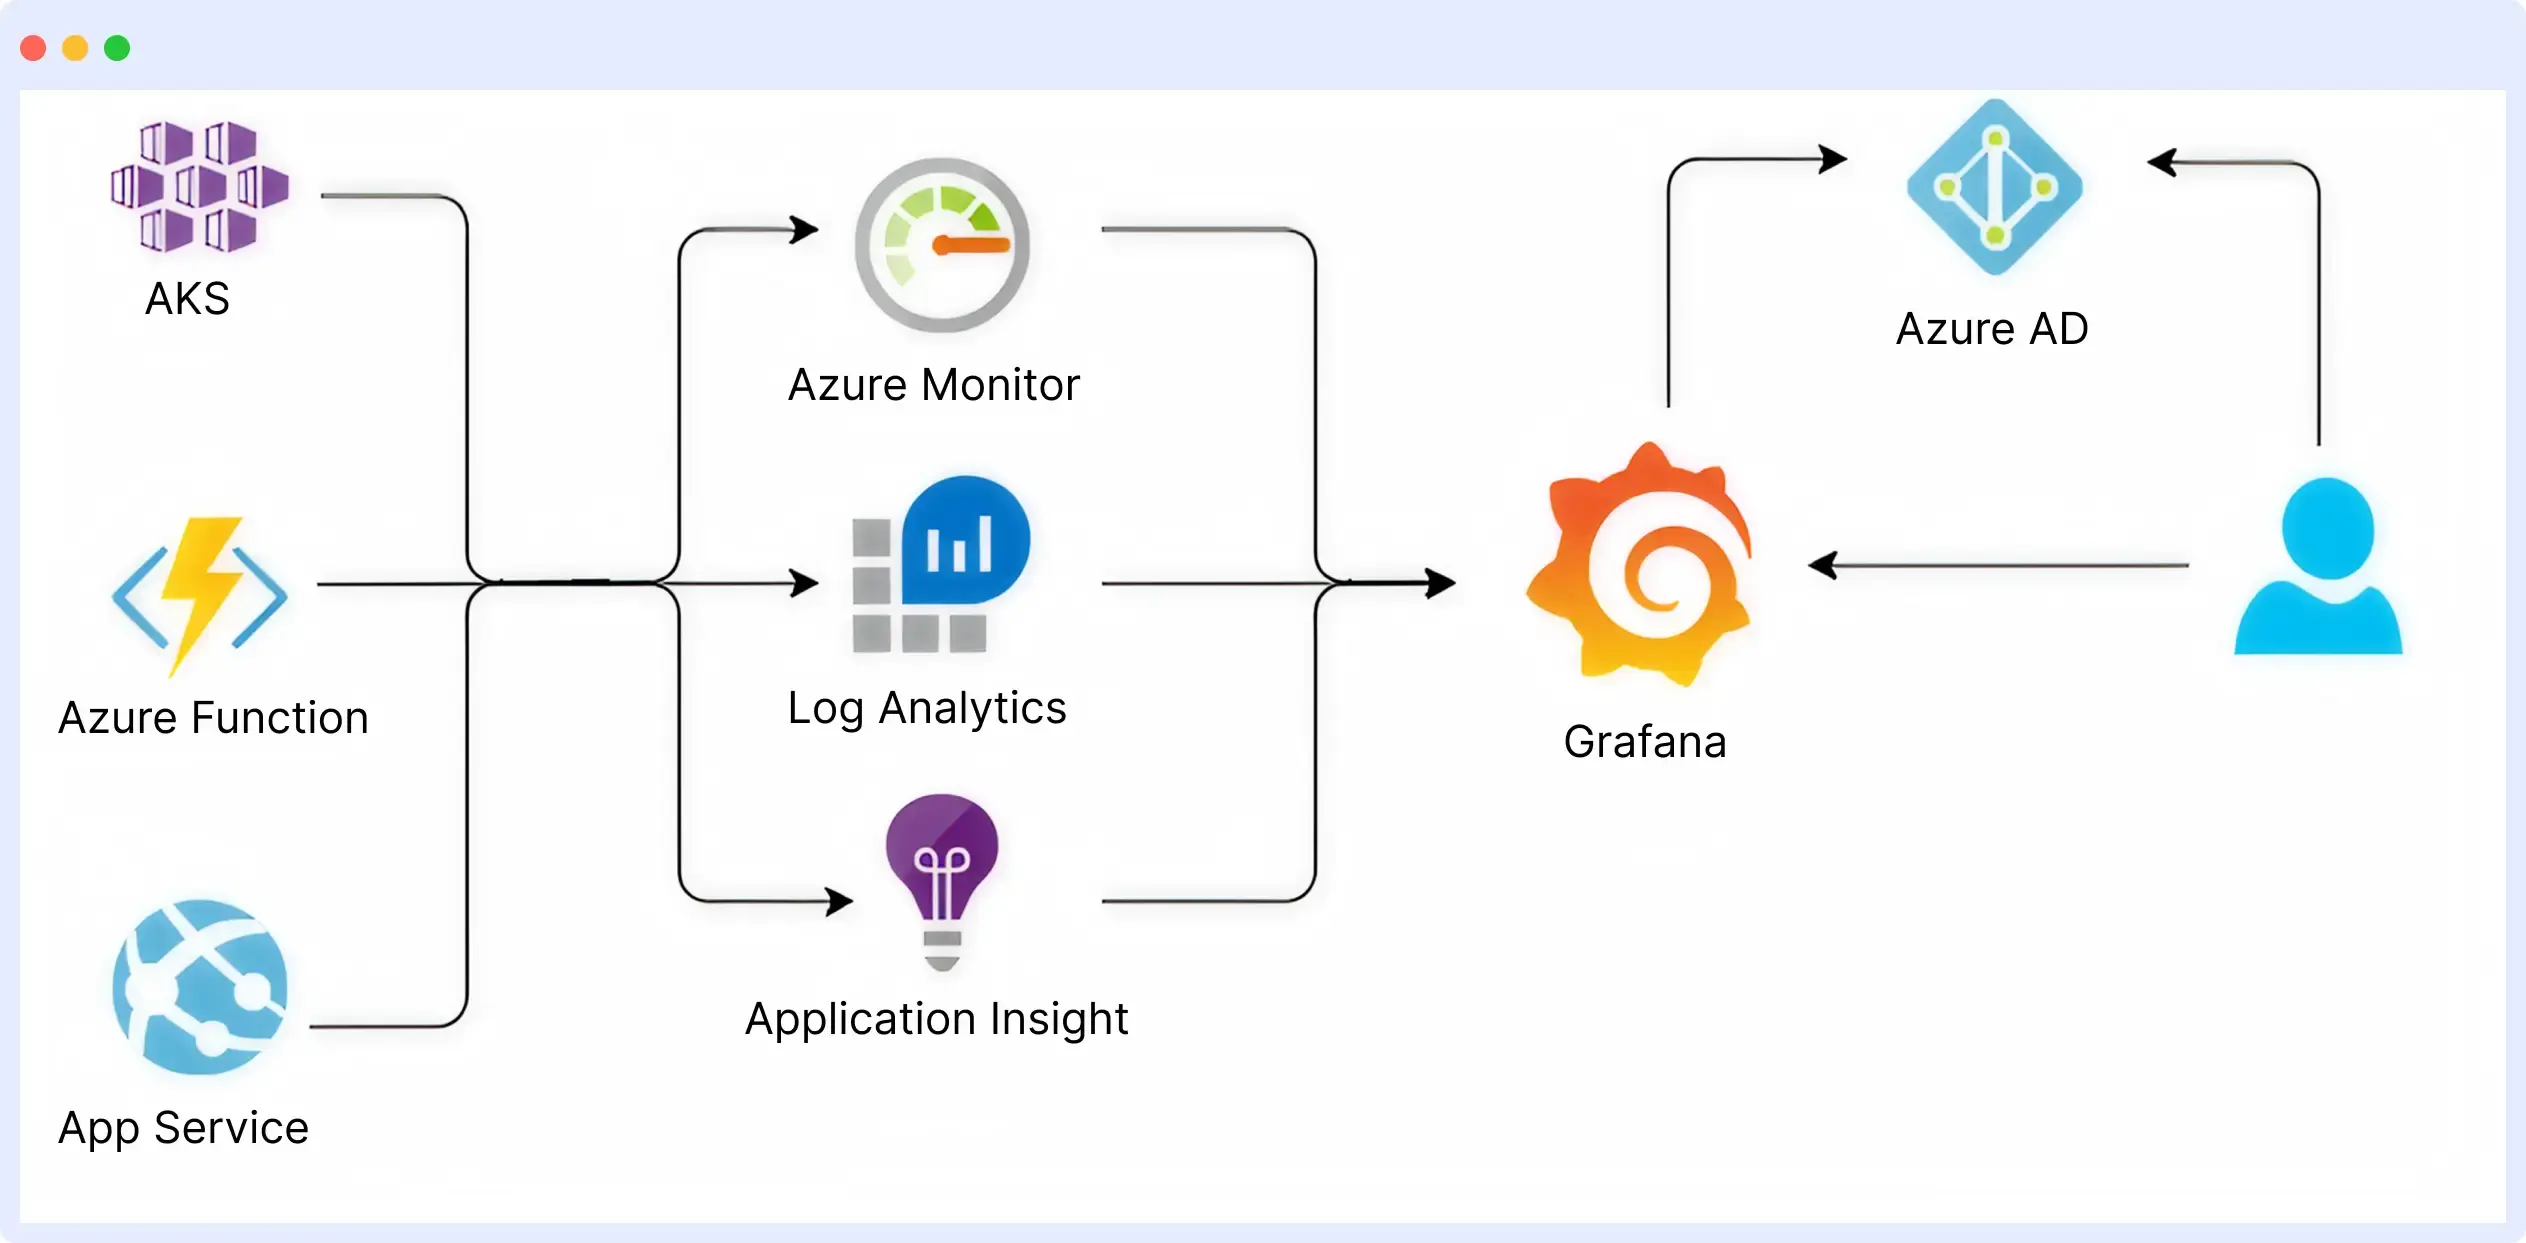
Datadog provides its data collection agents, which automatically start gathering information from your systems. It’s like having built-in sensors everywhere that run right when you install them. With over 700 integrations, Datadog can almost always connect with whatever tool or service you are already using, without additional setup.
Winner: Datadog
Datadog offers data collection with over 700 integrations and minimal setup. Grafana, in contrast, relies on external data sources, such as Prometheus or Elasticsearch, for ingestion.
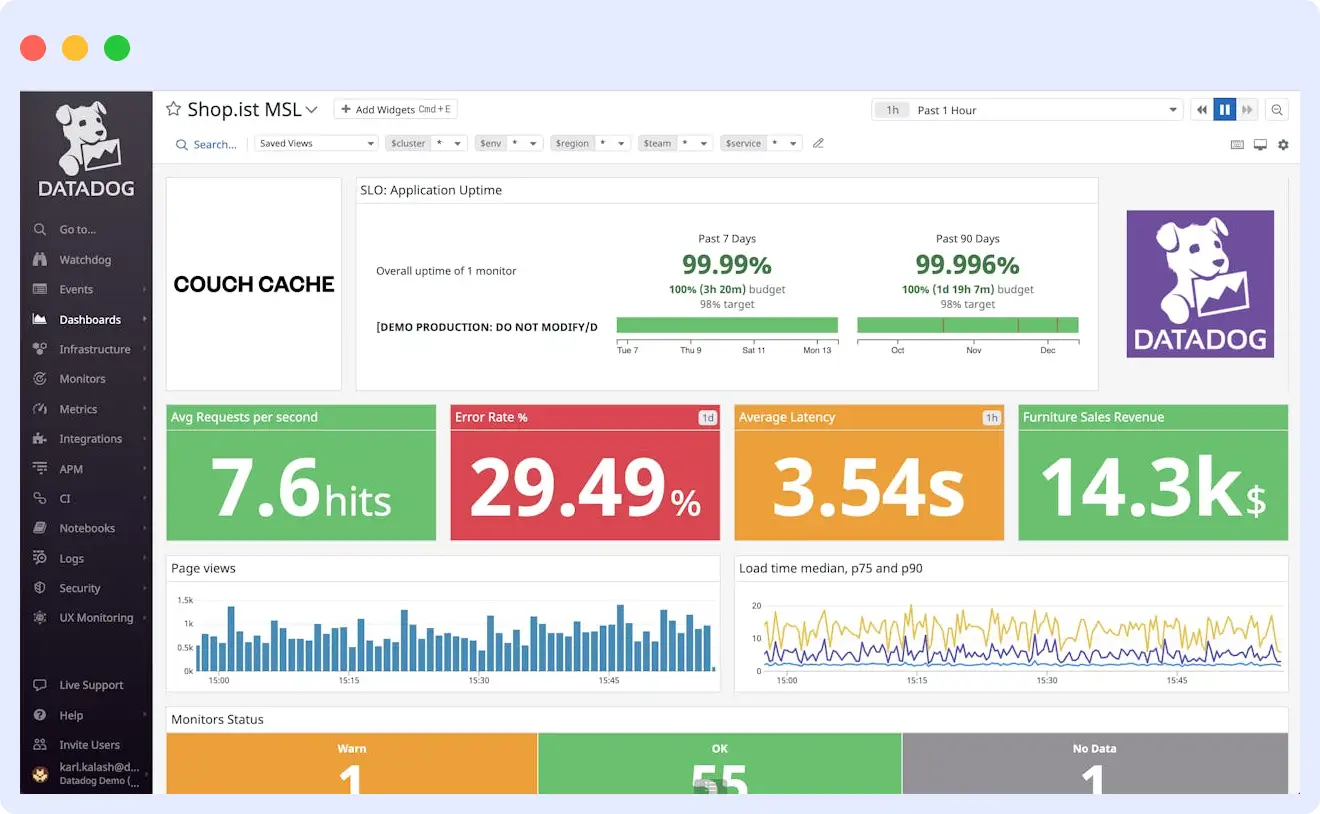
Visualization and Dashboards
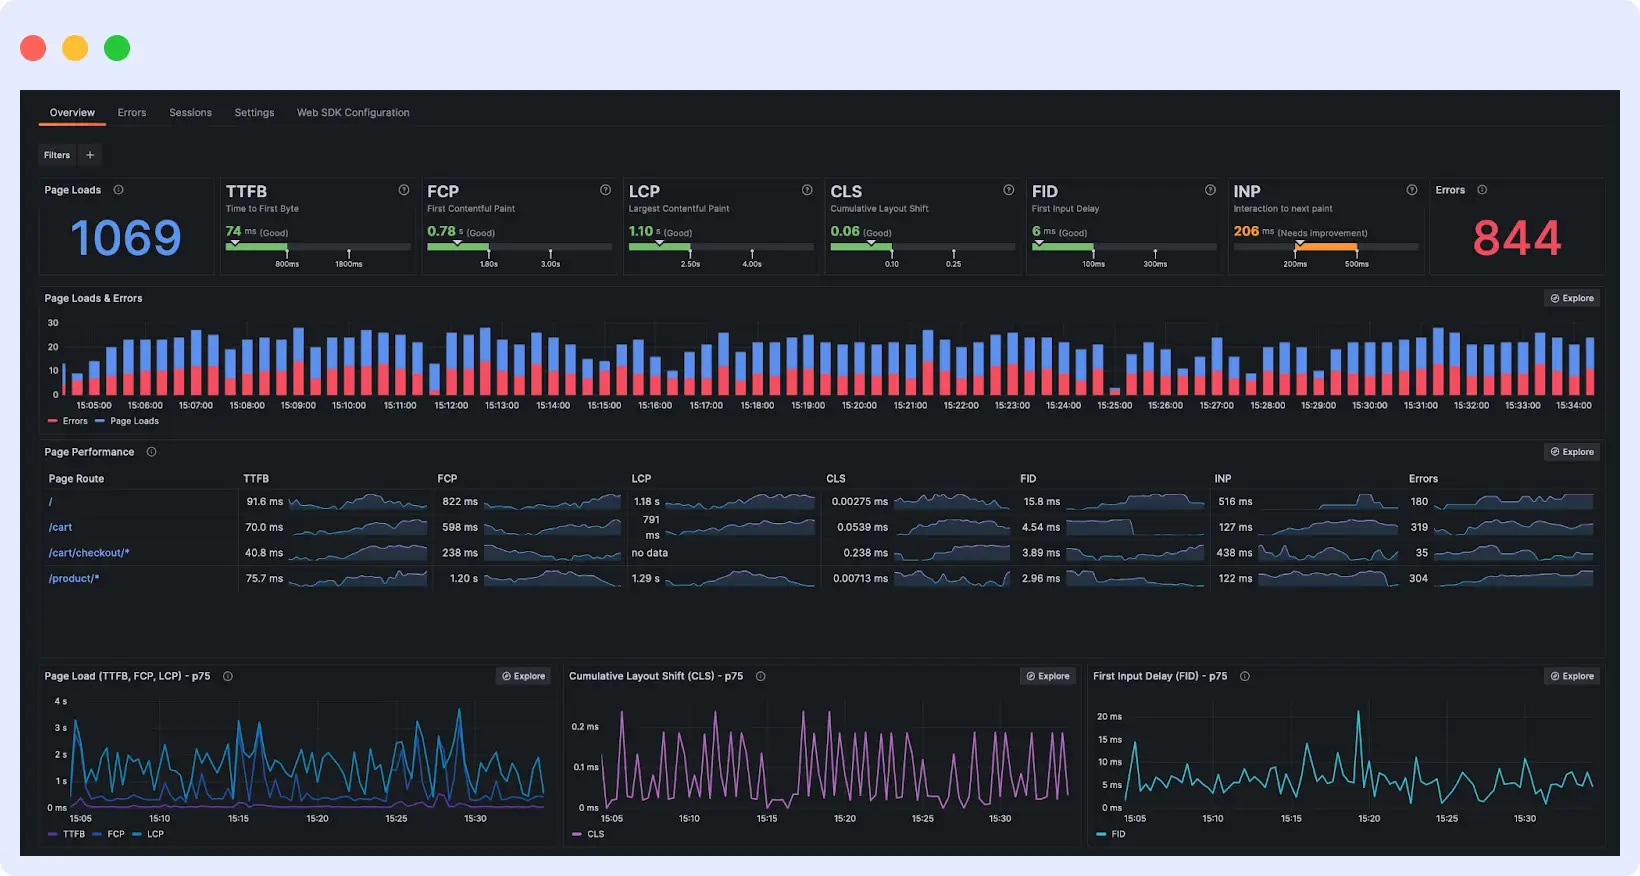
Grafana provides you with absolute control over how your dashboards look and behave. You can customize every aspect of the dashboard, develop complex visualizations, and build exactly what your team requires. It is an excellent solution for teams whose dashboard requirement will match their unique workflow and visual preferences.
Datadog simplifies dashboard creation with drag-and-drop widgets and 100+ pre-built templates for instant, professional visuals. It’s ideal for users who want powerful visualizations without spending hours on customization.
Winner: Grafana
Grafana offers greater flexibility and advanced customization for tailored dashboards. Datadog is better for speed and ease, but less suited for complex, bespoke visuals.
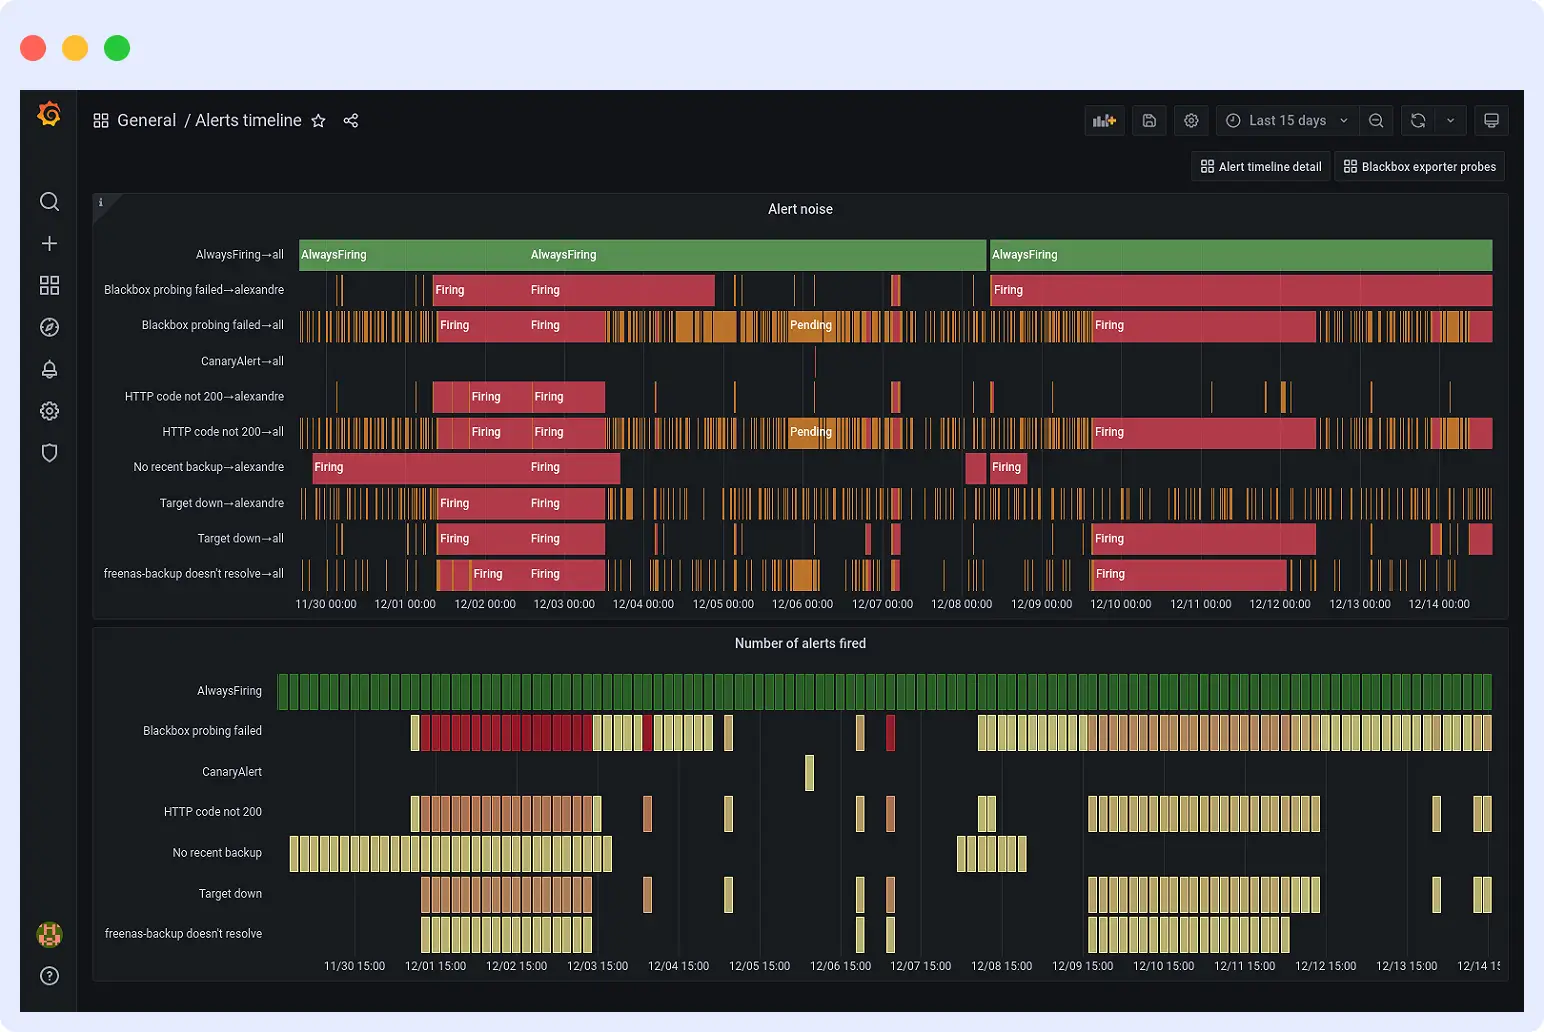
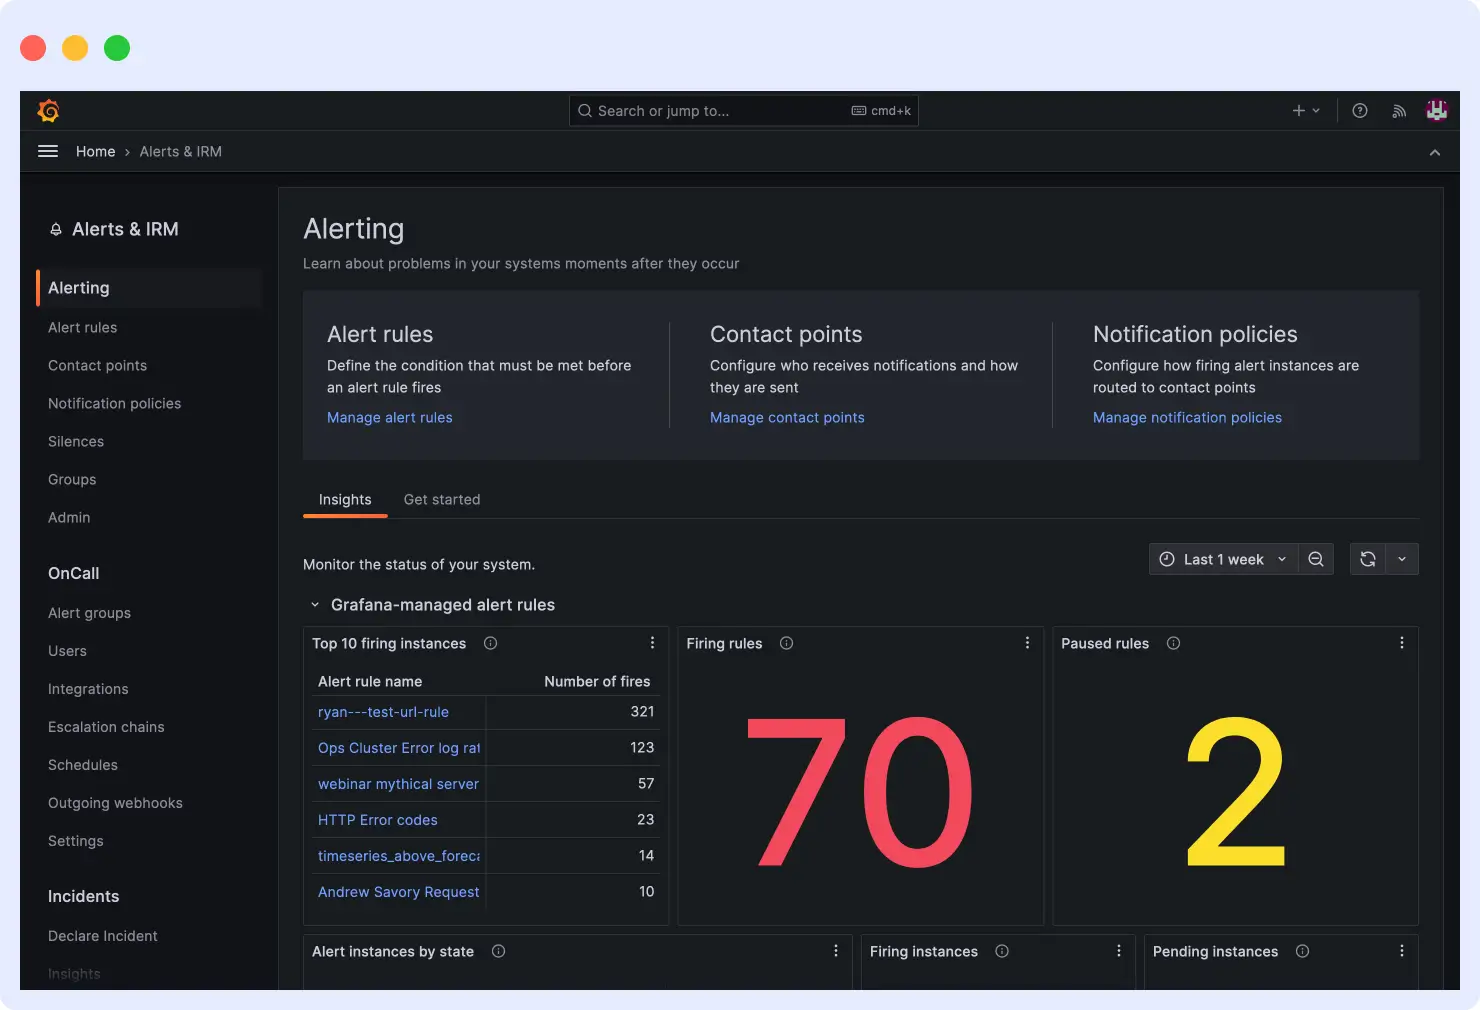
Alerting and Anomaly Detection
Grafana does a good job of working with basic alerts, but for advanced alerts, such as anomaly detection, you will need to use third-party tools. It’s a great use case when you already have alerts on your monitoring setup and would like Grafana to send alerts based on your dashboards.
Datadog includes intelligent alerting by default. It detects unusual patterns in your data using machine learning and can predict potential issues before they become problems. You get the benefits of advanced alerts without needing to set up complex rules or rely on external tools.
Winner: Datadog
Datadog Offers built-in intelligent alerting with machine learning for proactive issue detection. Grafana handles basic alerts but lacks native anomaly detection, relying instead on third-party integrations.
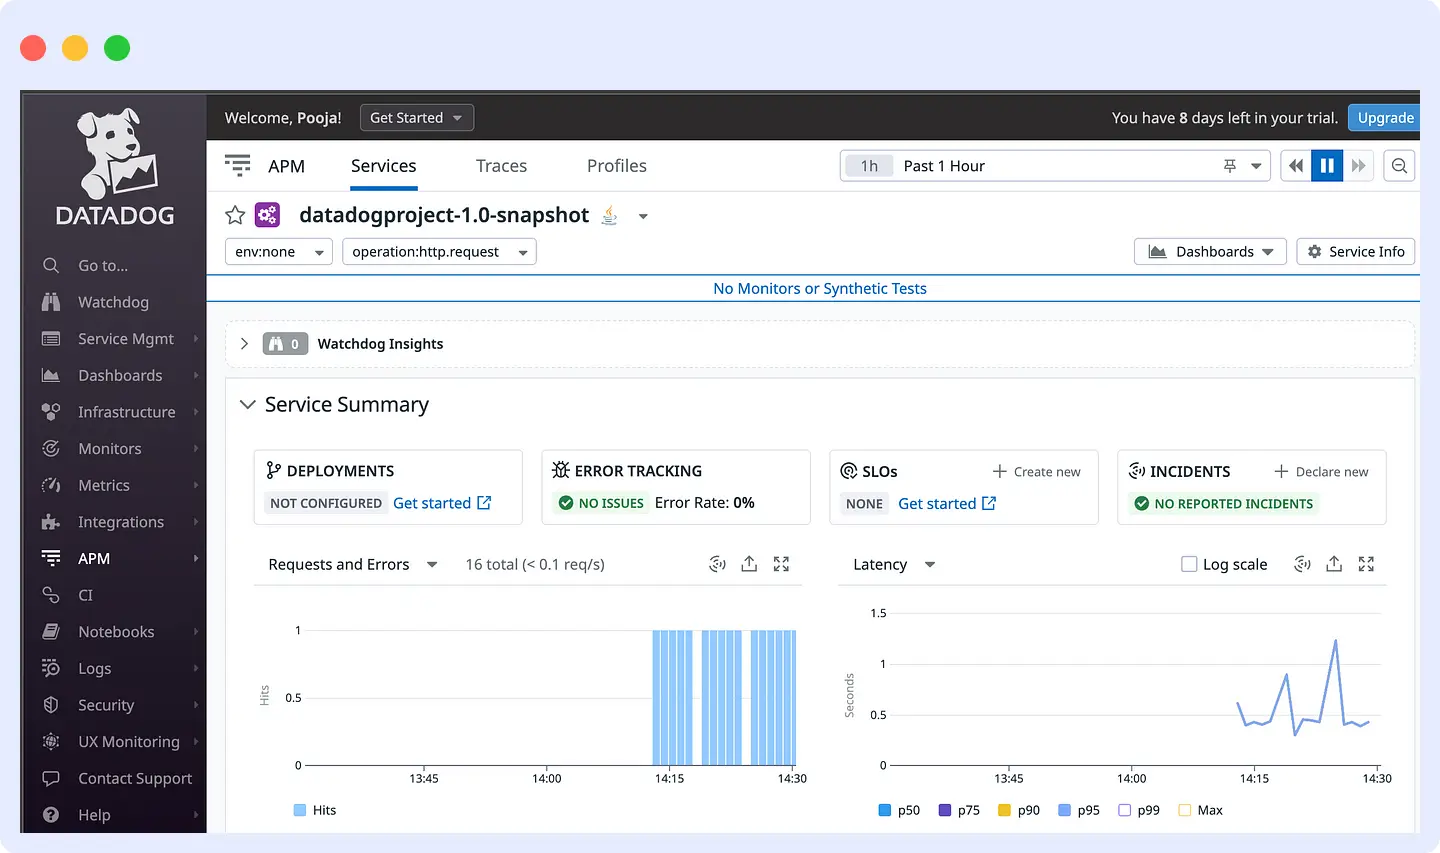
Application Performance Monitoring
Grafana supports APM data visualization through integrations with tools like Jaeger or Tempo, enabling distributed tracing and performance monitoring. It’s ideal for teams that prefer building their own observability stack while using Grafana as the central visualization layer.
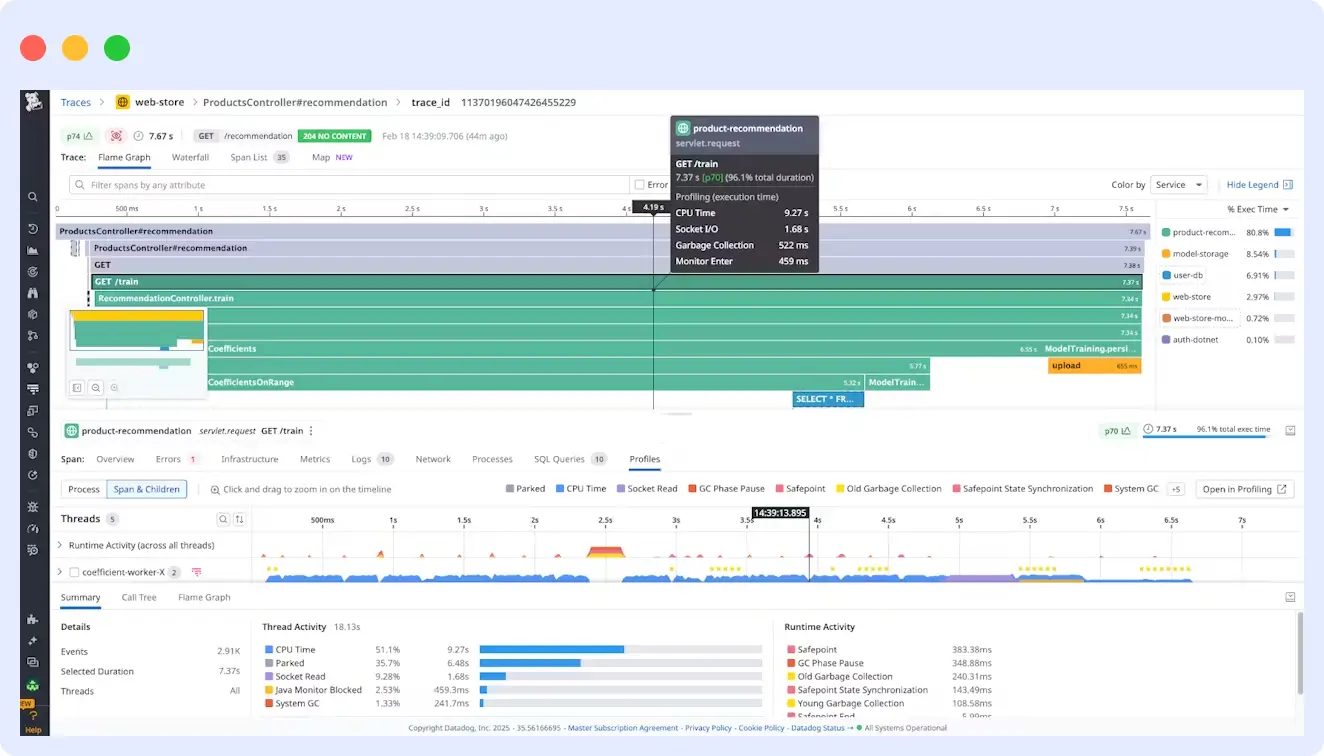
Datadog has robust APM features built into the Datadog platform. You have automatic service discovery, distributed tracing, and performance maps without having to install anything additional. It has great visualization capabilities, giving you an exact way to see how requests flow through your application and where bottlenecks occur.
Winner: Datadog
Datadog delivers a comprehensive APM solution with built-in service discovery, tracing, and performance maps, requiring no additional setup. Grafana only visualizes APM data from external tools, such as Jaeger or Tempo, and relies on pre-configured backends.
Log Management
Grafana uses Loki or other log aggregation tools to address log data. When your logs are connected, you can associate logs with metrics on the same dashboard, greatly simplifying root cause analysis. It’s ideal for teams wanting to see a unified view of disparate types of data.
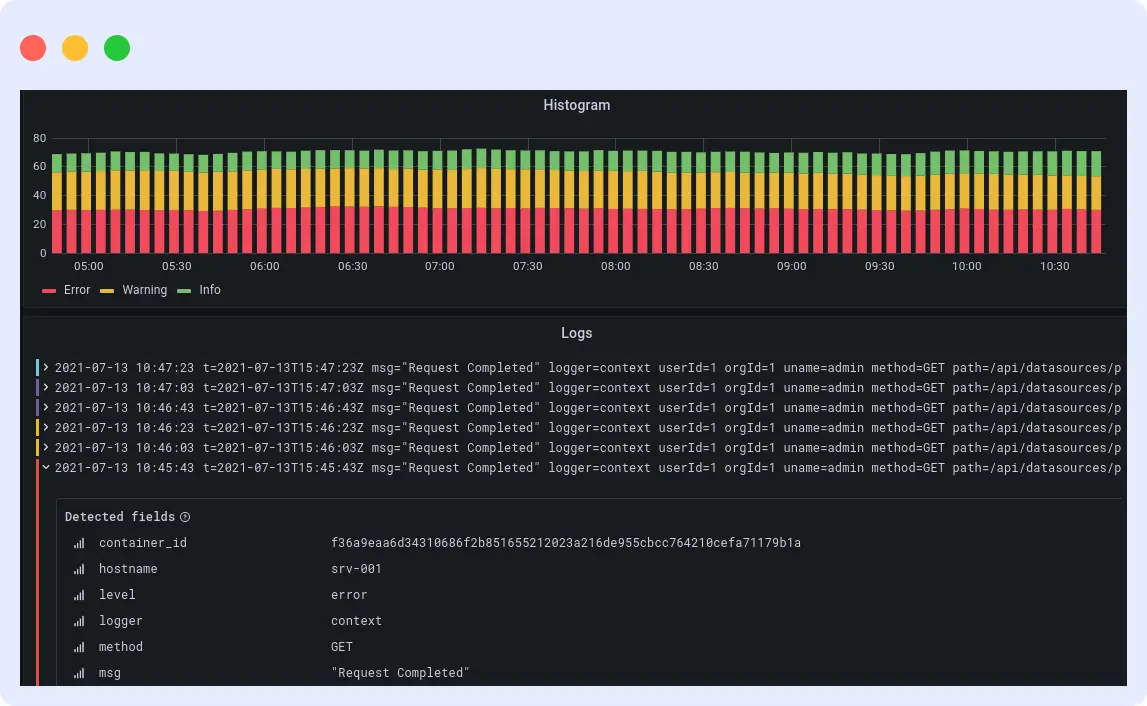
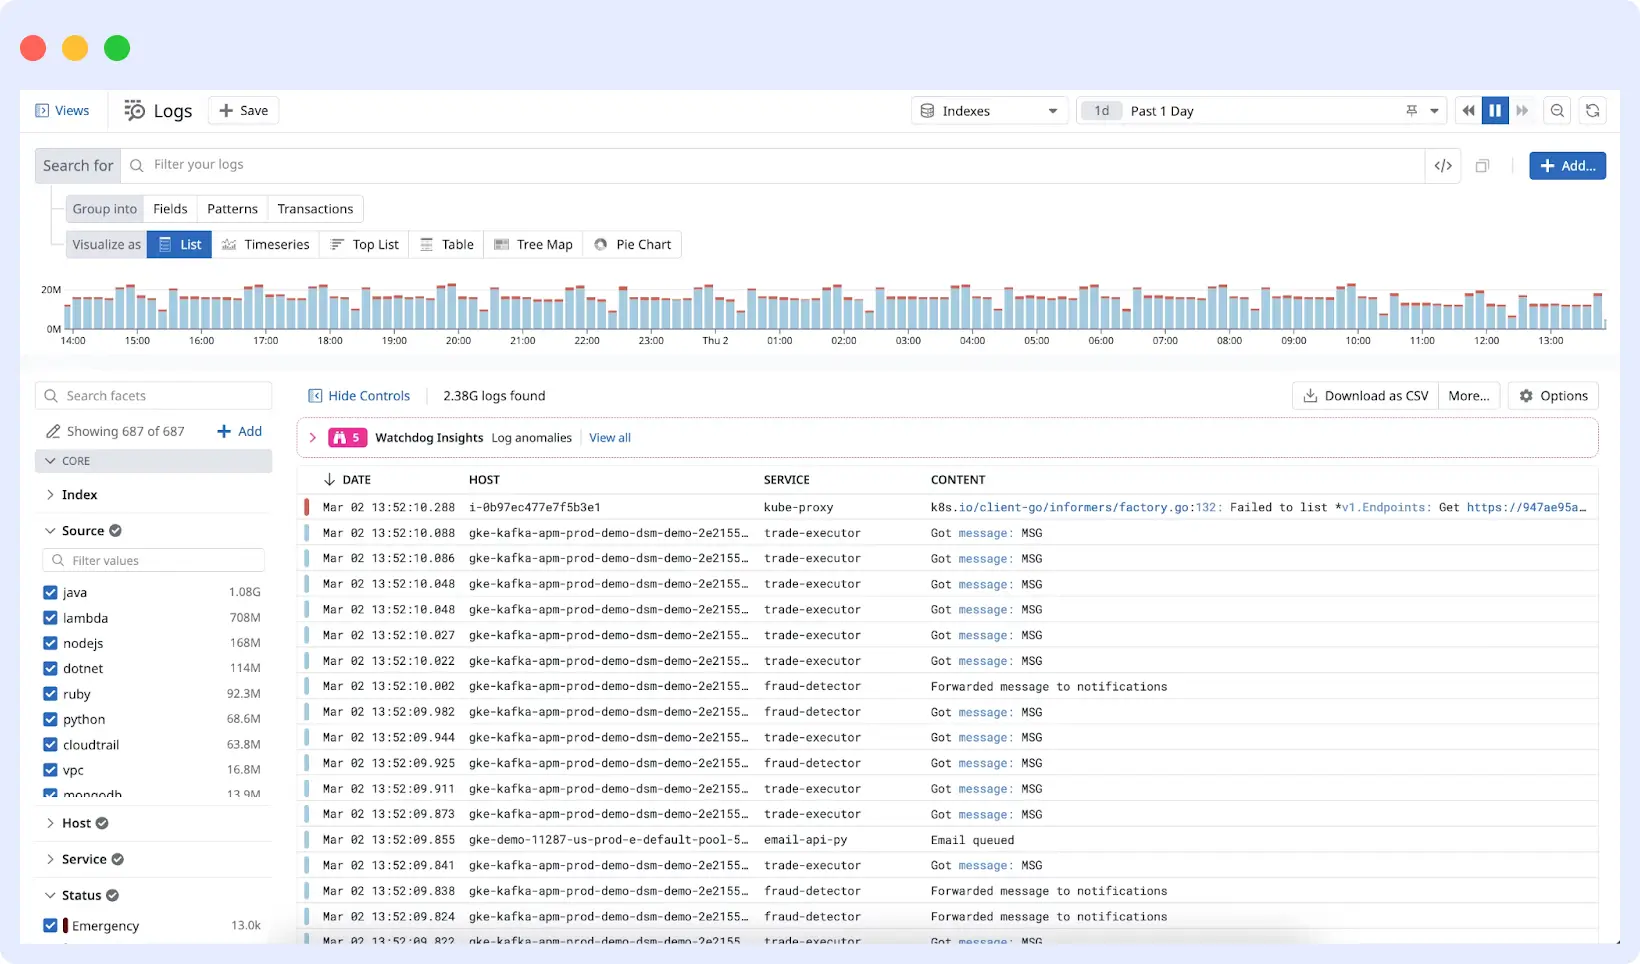
Datadog offers full log management, including automatic parsing, indexing, and analysis. Logs appear alongside metrics and traces, giving complete context for troubleshooting. You can easily search logs at scale and trigger alerts based on patterns.
Winner: Datadog
Datadog offers a fully integrated log management solution with parsing, indexing, and seamless correlation with metrics and traces. Grafana relies on tools like Loki and lacks Datadog’s built-in analytics and unified experience.
Deployment and Scalability
Grafana offers excellent flexibility in deployment, self-hosted, Grafana Cloud, or Enterprise. Its scalability depends on your chosen infrastructure and how you configure your data sources. With the proper setup, Grafana can scale to meet evolving technical needs.
Datadog is fully managed in the cloud, taking care of all infrastructure concerns. It automatically scales to handle large data volumes, eliminating the need for server management, storage planning, or performance tuning. You pay as you go, with no need for capacity planning.
Winner: Datadog
Datadog takes the lead with its fully managed, auto-scaling SaaS solution that eliminates infrastructure concerns. While Grafana offers flexible deployment options, it requires manual effort to ensure scalability and reliability, adding overhead for development teams.
Pricing and Cost Considerations
Grafana’s open-source version is entirely free and is an excellent option if you’re on a budget. Grafana Cloud and Enterprise are more expensive based on usage and other included features. You can also start using Grafana for free, then upgrade down the road if you need to scale up. The overall cost can vary considerably depending on your existing cloud and third-party tool expenses.
Datadog offers subscription pricing based on the features you need and the data you pass on to the platform. It might cost more in a traditional sense, but you will save on infrastructure management, integration work, and the time your team would spend maintaining a self-made solution.
Winner: Grafana
Grafana is the clear winner for cost-efficiency. Being open-source, it’s ideal for teams with existing infrastructure or those comfortable managing their setup. Datadog, while feature-rich, can become expensive at scale, especially with large data volumes.
Smooth setup, real results. MindOrigin onboarded Middleware effortlessly across a complex stack and reduced observability costs by 75%.
👉 See how they did it
User Experience and Community Support
Grafana has a robust open-source community that builds plugins, shares dashboards, and provides documentation. If there is a question, someone’s probably solved it already and shared the solution. The community-driven approach results in innovation and free stewardship resources.
Datadog provides professional support through dedicated customer success teams, extensive documentation, and online communities, offering guaranteed response times and access to training resources.
You also have access to experts when you need help. Datadog does have user communities, but limits their activities to interactions and best practices rather than troubleshooting their problems.
Winner: Grafana
Grafana is backed by a vibrant open-source community contributing plugins, dashboards, and documentation. Datadog offers strong professional support and training, but its technical community is less active compared to Grafana.
Use Cases and Ideal Scenarios
Grafana Best For:
- Use cases requiring advanced dashboard customization and flexibility
- Teams that want full control and customization over their monitoring setup
- Organizations with existing tools like Prometheus, Loki, Jaeger, etc., and want Grafana as the visualization layer
- Companies looking for a cost-effective, open-source solution
- Teams with in-house expertise willing to manage infrastructure and setup
Datadog Best For:
- Organizations needing a quick setup with minimal maintenance overhead
- Teams operating in complex, dynamic environments need end-to-end observability
- Businesses that prefer a fully managed SaaS platform over self-hosting
- Companies that value built-in integrations (700+), automatic discovery, and smart alerting
- Scenarios where scalability, uptime, and simplicity are critical, even at a higher cost
Winner: This is a tie, as the ideal choice depends on the organization’s priorities. Grafana suits tech-savvy teams that are already using tools like Prometheus, Loki, or Tempo, seeking granular control. Datadog is better suited for teams that need a plug-and-play, all-in-one observability solution with minimal setup and maintenance requirements.
How to Choose Between Grafana and Datadog?
Technical Skills & Team Resources
If your team enjoys experimenting with different configurations and can perform basic technical troubleshooting on their own, Grafana enables you to engineer whatever you want.
However, if your developers are busy developing features and don’t have time to “monitor” the monitoring infrastructure, Datadog’s plug-and-play capabilities can save you immeasurable time. Honestly, ask yourself this question: Would you rather have your team spend time building dashboards or building your product?
Budget
The upfront cost of Grafana’s open-source version is $0. Keep in mind that you will incur infrastructure costs, the time required to maintain the open-source project, and possibly additional tools to monitor your infrastructure fully.
“Compared to other observability solutions, Middleware offered similar or even superior capabilities at a much lower cost, eliminating the need for expensive tiered pricing or additional charges for advanced features. This made Middleware a more accessible and scalable solution for a business like ours. In fact, we were able to reduce our costs by 75%.”
Krishna Charan BS, Information Security Head, MindOrigin
Datadog has transparent monthly costs, but it removes any infrastructure costs and reduces the time of your expensive developers on setting up and maintaining your monitoring. Make sure to evaluate both the obvious costs and hidden costs – your team’s time is worth money too.
Data Volume & Complexity
If you have large amounts of data or are dealing with complex, multi-cloud environments, Datadog offers a scalable infrastructure that enables growth without requiring capacity planning. Grafana will work for smaller systems, but scaling is a real coordination and infrastructure management challenge. Think about where you’re going to be, not just where you are today, two years from now.
Customization Needs
If you want dashboards that are customized to your specific workflow or have special visualization demands, no one can beat the flexibility of Grafana. But if standard dashboards and templates are sufficient for your needs, Datadog’s out-of-the-box approach allows you to accomplish your goals faster than customizing everything in Grafana.
Consider whether you want to adapt your monitoring to fit your process or adjust your process to fit standard tracking.
Security & Compliance
If you are in a highly regulated organization with strict data residency requirements or need complete ownership of your monitoring data, you should investigate Grafana’s self-hosted options for the security you need.
Datadog handles security very well, but your data exists in their cloud. This approach may not be suitable for highly regulated industries. Follow the direction of your compliance team on this decision.
Long-Term Goals
If you are building a technology company where a flexible monitoring solution is a competitive advantage, then you will want to assess analytics capabilities with Grafana. Suppose monitoring is necessary in your business, and you want to focus on your core product and company.
In that case, Datadog is a managed solution that provides the flexibility to stay focused on what matters most. Make your decision based on whether monitoring is strategic for your business or operational.
A Better Alternative: Middleware
While Grafana and Datadog are both strong contenders in the observability space, teams often face a tough choice:
- Grafana offers flexibility but requires extensive setup and infrastructure management.
- Datadog is fully managed but comes with a high price tag, especially at scale.
Middleware bridges the gap, providing the flexibility of Grafana and the out-of-the-box power of Datadog, without the complexity or cost overhead.
Built for cloud-native, microservices, and distributed environments, Middleware delivers real-time observability with a unified view of metrics, logs, traces, and events all in a single timeline.
- Fully Managed Platform: No need to manage Prometheus, Loki, or Tempo like in Grafana. And no vendor lock-in like Datadog. Middleware is a fully managed SaaS solution built on open standards, including OpenTelemetry and Prometheus.
- Custom Dashboards with Ease: Like Grafana, Middleware supports custom dashboards and visualizations, but without the backend setup. It’s designed to be plug-and-play across cloud environments and legacy systems.
- Built-in APM + RUM: Get full-stack visibility with Application Performance Monitoring, Real User Monitoring, service maps, and error tracking all included out of the box, unlike Grafana’s add-on model.
- Transparent Pricing & Scalability: Middleware grows with your infrastructure and provides predictable pricing, unlike Datadog, which can become prohibitively expensive with high data volumes.
Grafana vs Datadog vs Middleware
| Feature | Grafana | Datadog | Middleware |
|---|---|---|---|
| Setup & Maintenance | DIY, needs infrastructure | Fully managed | Fully managed + open standards |
| Cost at Scale | Low (self-managed) | High (usage-based) | Transparent & cost-efficient |
| Custom Dashboards | Highly customizable | Easy-to-use | Custom + easy to set up |
| Unified View (Logs + Metrics) | Plugins needed | Separate interfaces | Single timeline |
| Built-in APM & RUM | External tools needed | Yes | Native & integrated |
| Ideal for | DevOps-heavy teams | Teams needing plug-and-play | Modern teams seeking balance |
Middleware brings you the best of both worlds: Grafana’s flexibility without the setup, and Datadog’s simplicity without the cost.
If you’re tired of managing infrastructure or worrying about unpredictable billing, Middleware gives you a single, powerful, and developer-friendly platform to monitor everything that matters.
Conclusion
Grafana is ideal if you want flexibility, customization, and an open-source stack, provided your team can handle the setup and maintenance. Datadog is suitable for teams seeking a ready-to-use, all-in-one monitoring platform that requires minimal effort, although it comes at a higher cost and offers less flexibility. Want the best of both? Try Middleware, a modern observability solution that combines Grafana’s control with Datadog’s ease of use, without the heavy lift or vendor lock-in.