In the world of microservices, service-level metrics often act like a “check engine” light. They tell you something is wrong under the hood, but they don’t tell you which specific part is failing. A service might report a healthy 99% success rate while a critical /checkout endpoint is silently failing for every user.
Traditional APM tools aggregate data at the service level, which smooths out the very spikes you need to see. This “average” performance often hides “outlier” disasters, leaving engineers to hunt through logs and trace spans to find the culprit.
Today, we are excited to announce the launch of Endpoint Monitoring, a core pillar of our APM suite. This feature moves beyond broad service averages to provide granular, route-level observability. By merging real-time trace traffic with your OpenAPI (Swagger) specifications, Middleware provides a single source of truth for both the design and the performance of your APIs.
👉 Try Endpoint Monitoring to see route-level insights in real time, or read endpoint docs to learn how to get started.
The Missing Link in API Observability
Most documentation fails because the “proof” (live data) rarely lives with the “plan” (the API spec). This gap creates friction in the moments that matter most. When an incident occurs, time is wasted switching between documentation repositories and observability dashboards just to understand what a specific endpoint was supposed to do versus what it is actually doing.
Middleware Endpoint Monitoring changes the experience immediately. Instead of treating requests as anonymous strings, we match real-world traffic to your documented operations, giving you a 360-degree view of your API health, performance, and compliance.
How it Works: From Discovery to Deep-Dive
Middleware helps you move from raw data to a structured API inventory in seconds.
Watch the walkthrough below to see how to connect your specs and explore your endpoint signals:
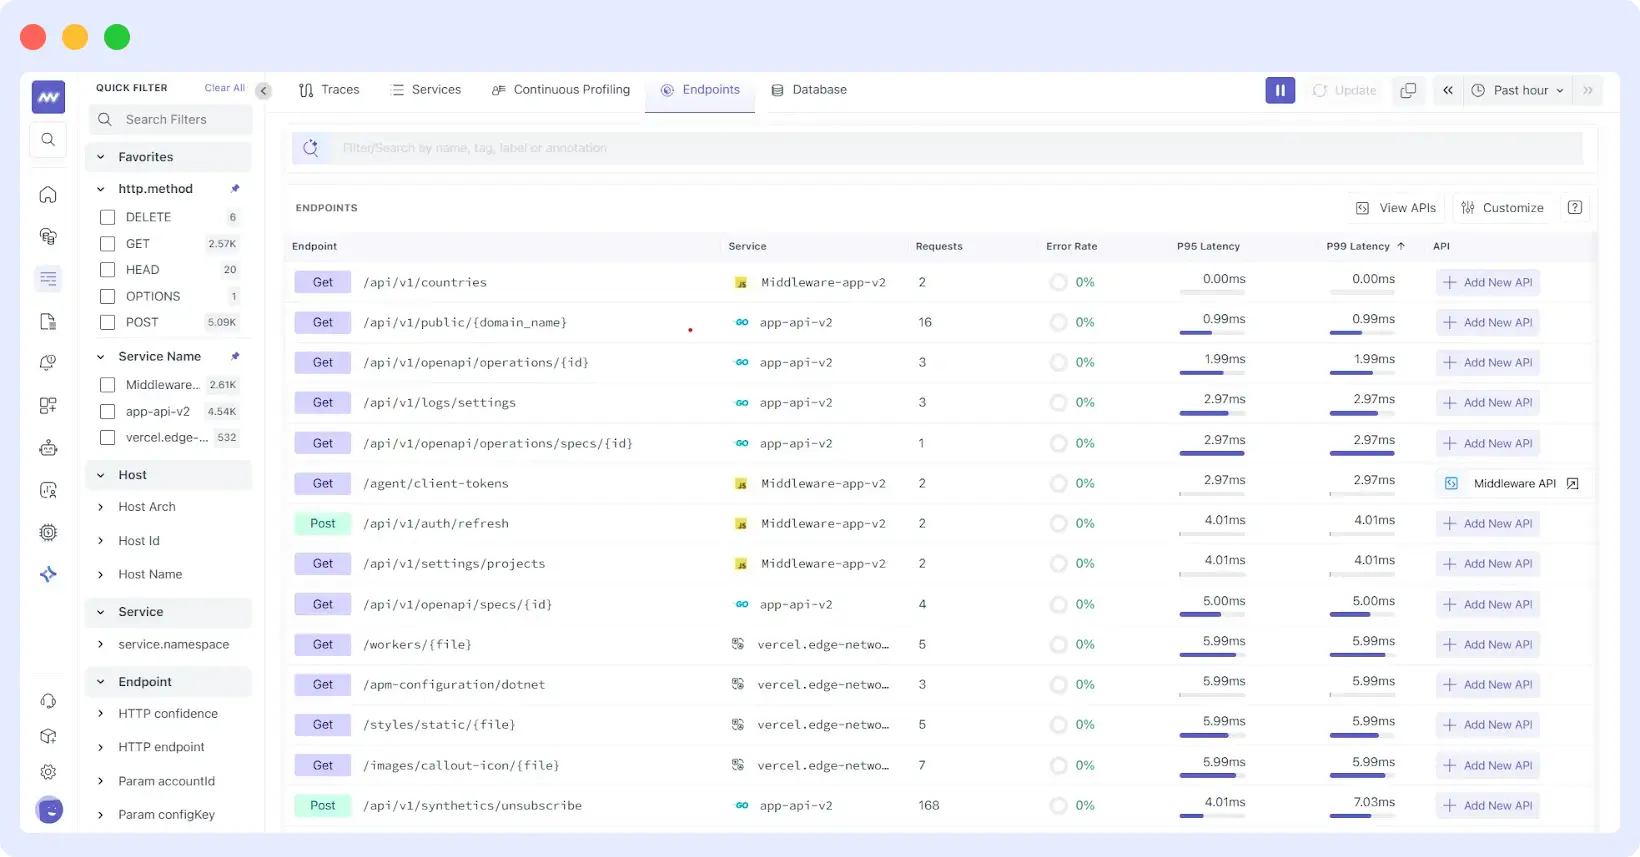
1. Automatic Discovery via Trace Traffic
Middleware uses real-time trace data to automatically discover your API endpoints as they are hit in production. There is no manual configuration required.
- Instant Inventory: Every Method + Route combination is identified and mapped to its serving service.
- Live Health Signals: See request volume, error rates, and P95/P99 latency. These tail latencies highlight the slowest requests, the ones your customers feel first.
Explore more insights on detecting, analyzing, and reducing API latency to ensure faster performance and better user experiences across your services.
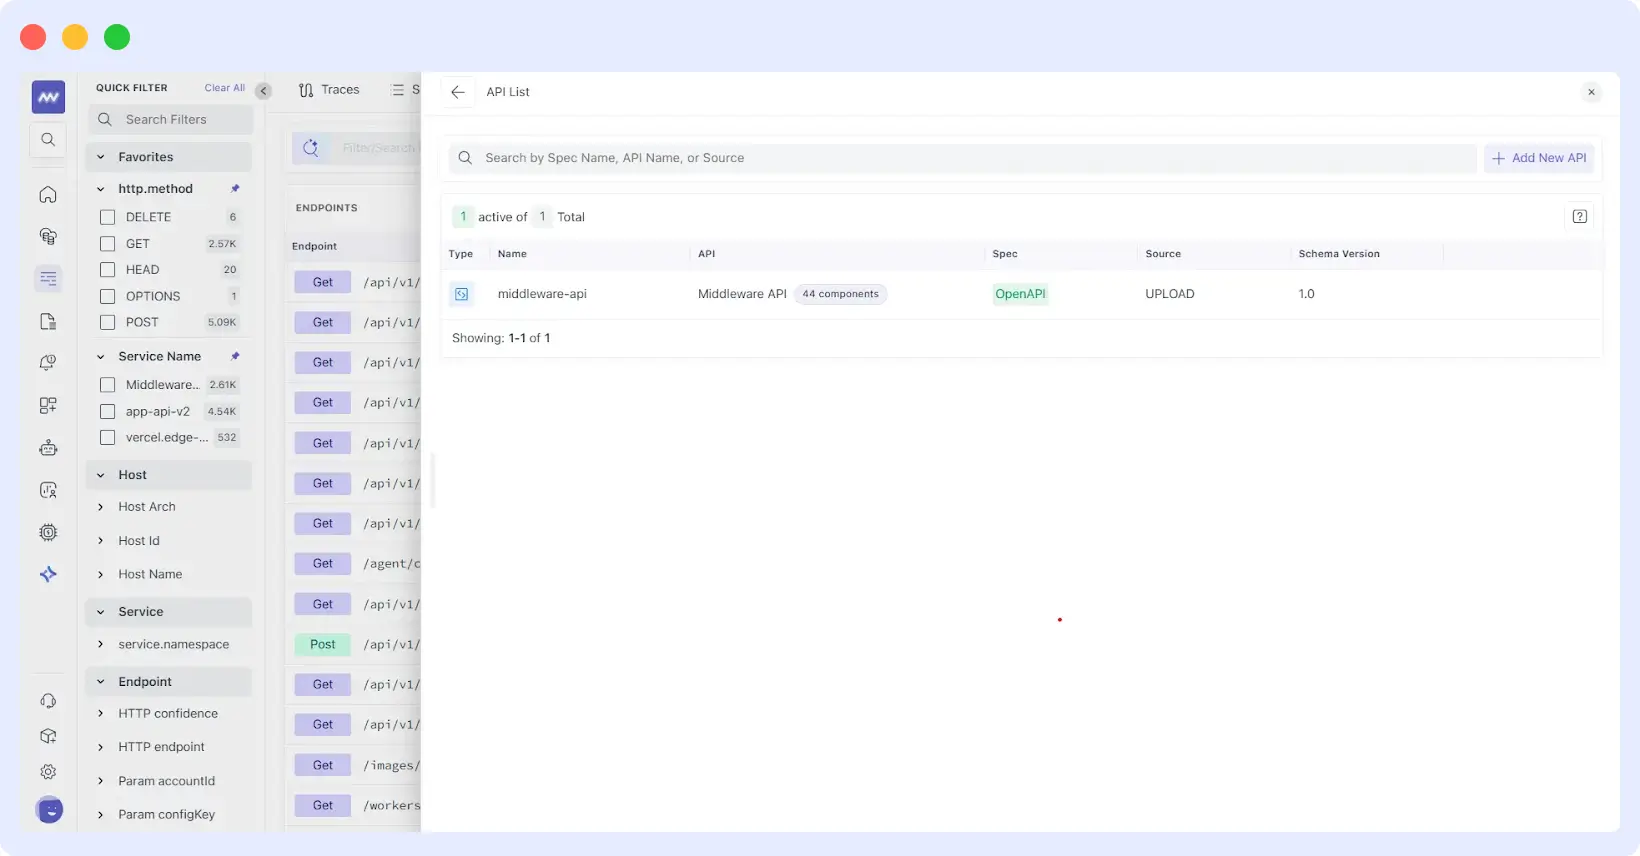
2. Activating Your OpenAPI Specs
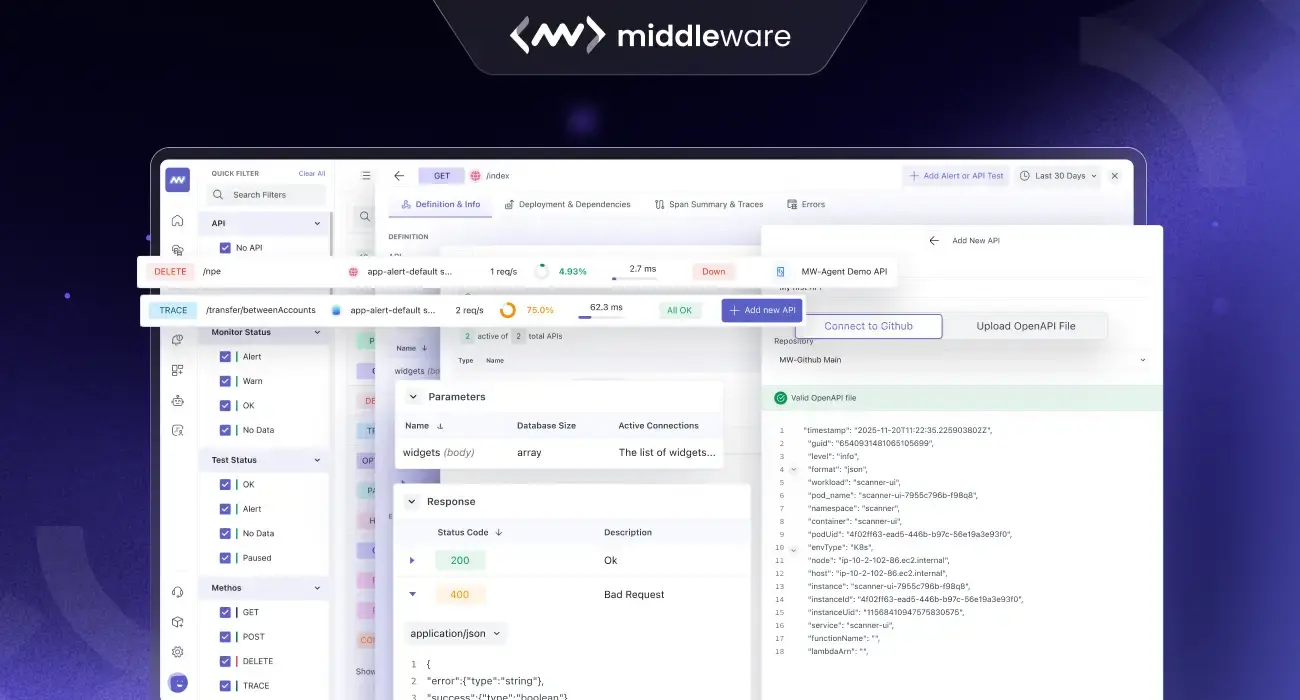
Documentation shouldn’t be static. By linking an OpenAPI spec via GitHub sync or file upload, Middleware transforms your blueprints into an active monitoring tool.
- Contract Context: Middleware matches endpoints to documented operations, adding parameter definitions and response codes.
- Component Tracking: Monitor the complexity of your API using “Components” counts to ensure your reusable schemas are performing as expected.
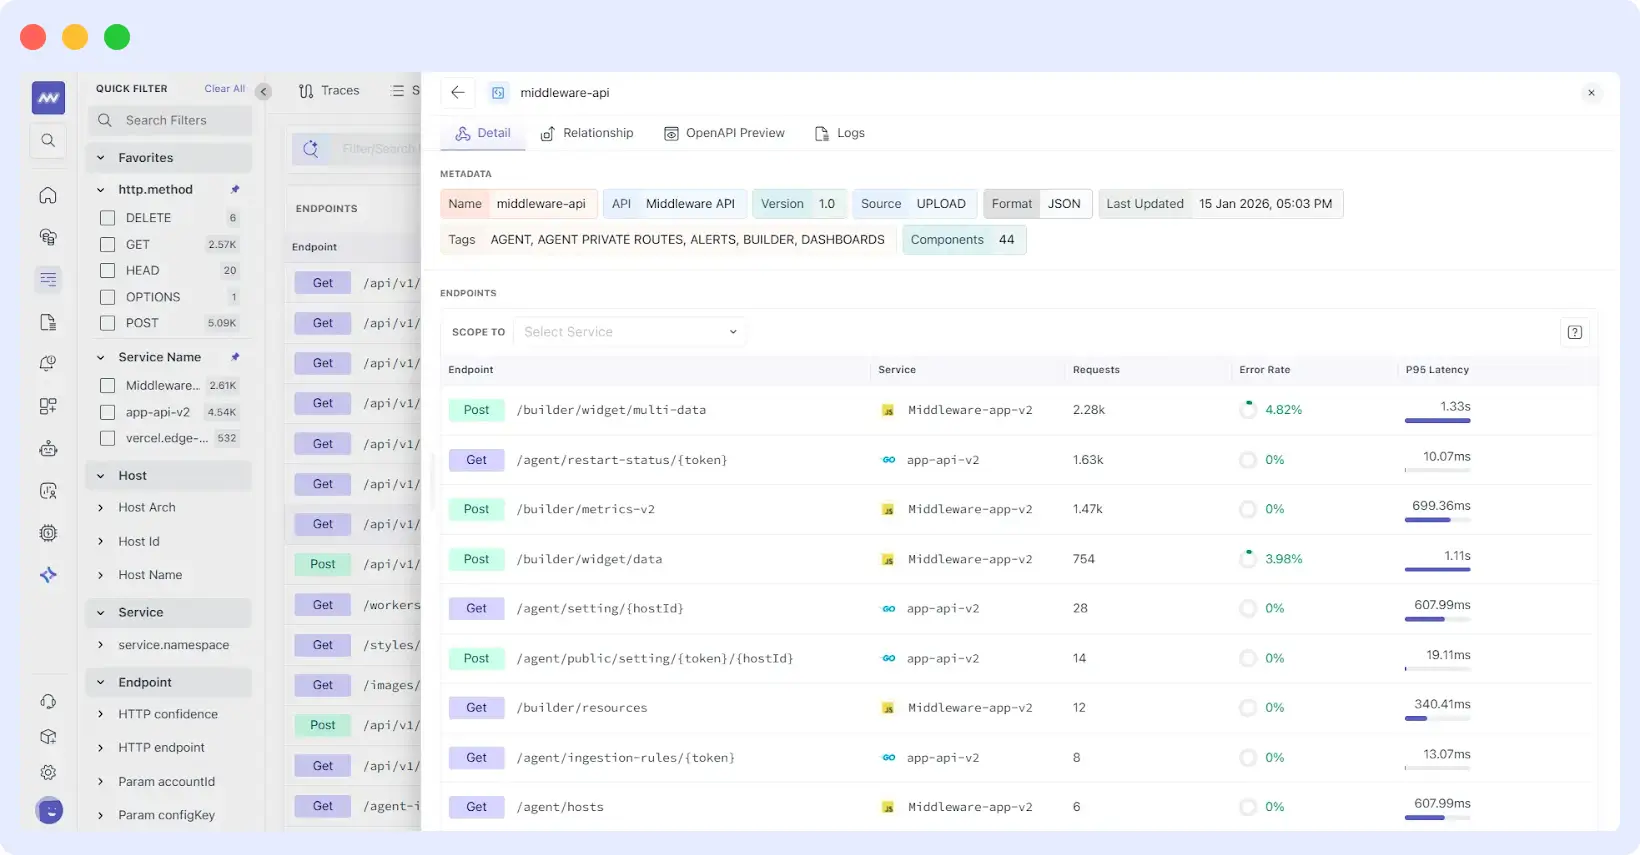
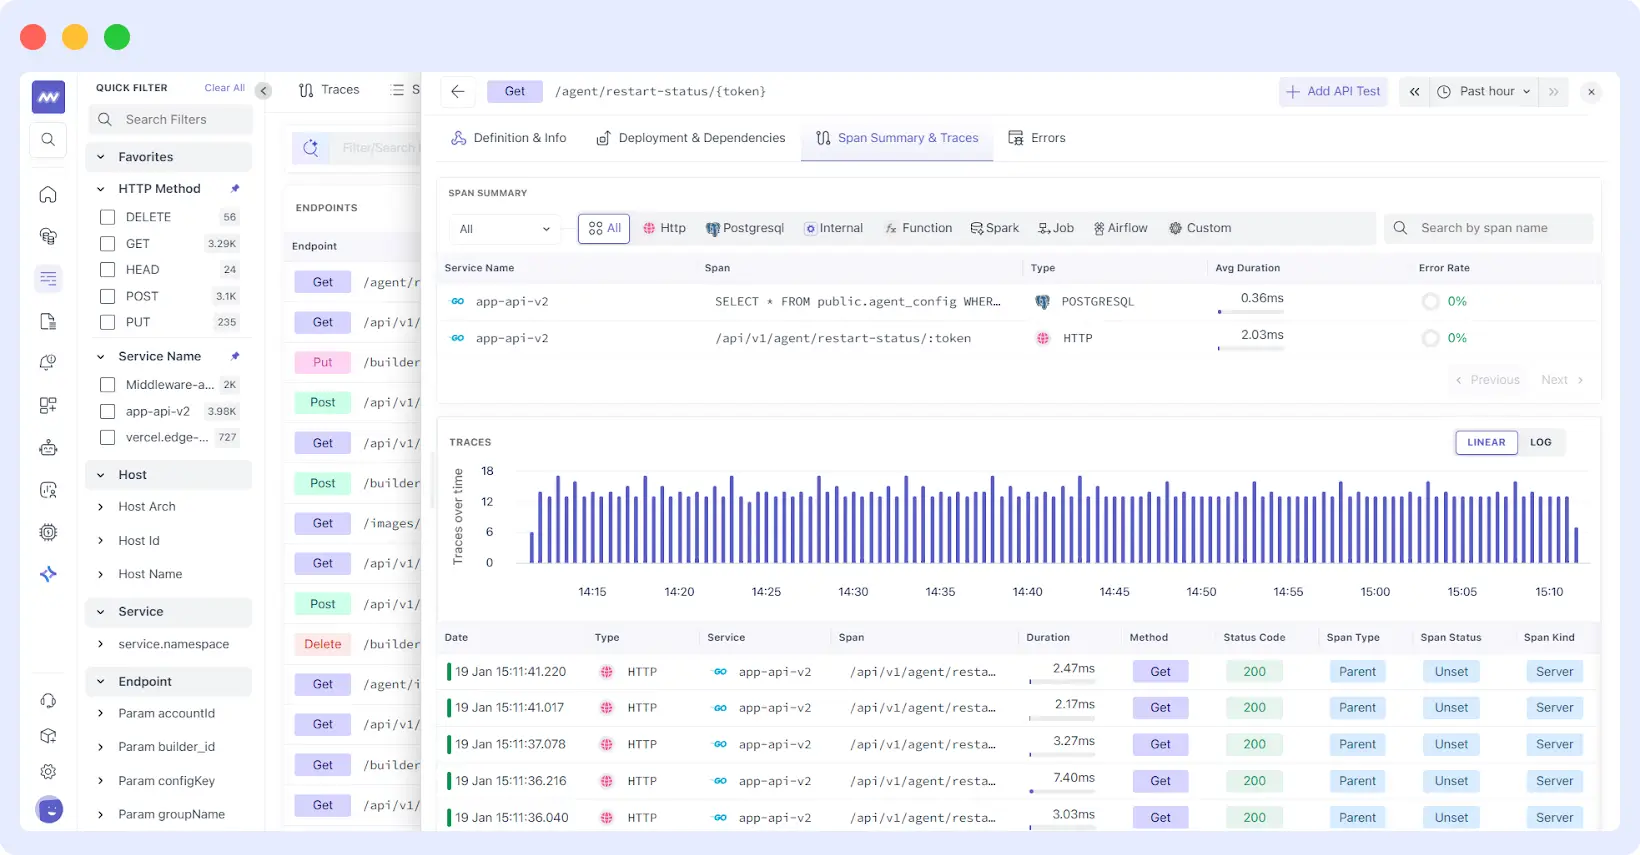
3. Single-Endpoint Intelligence
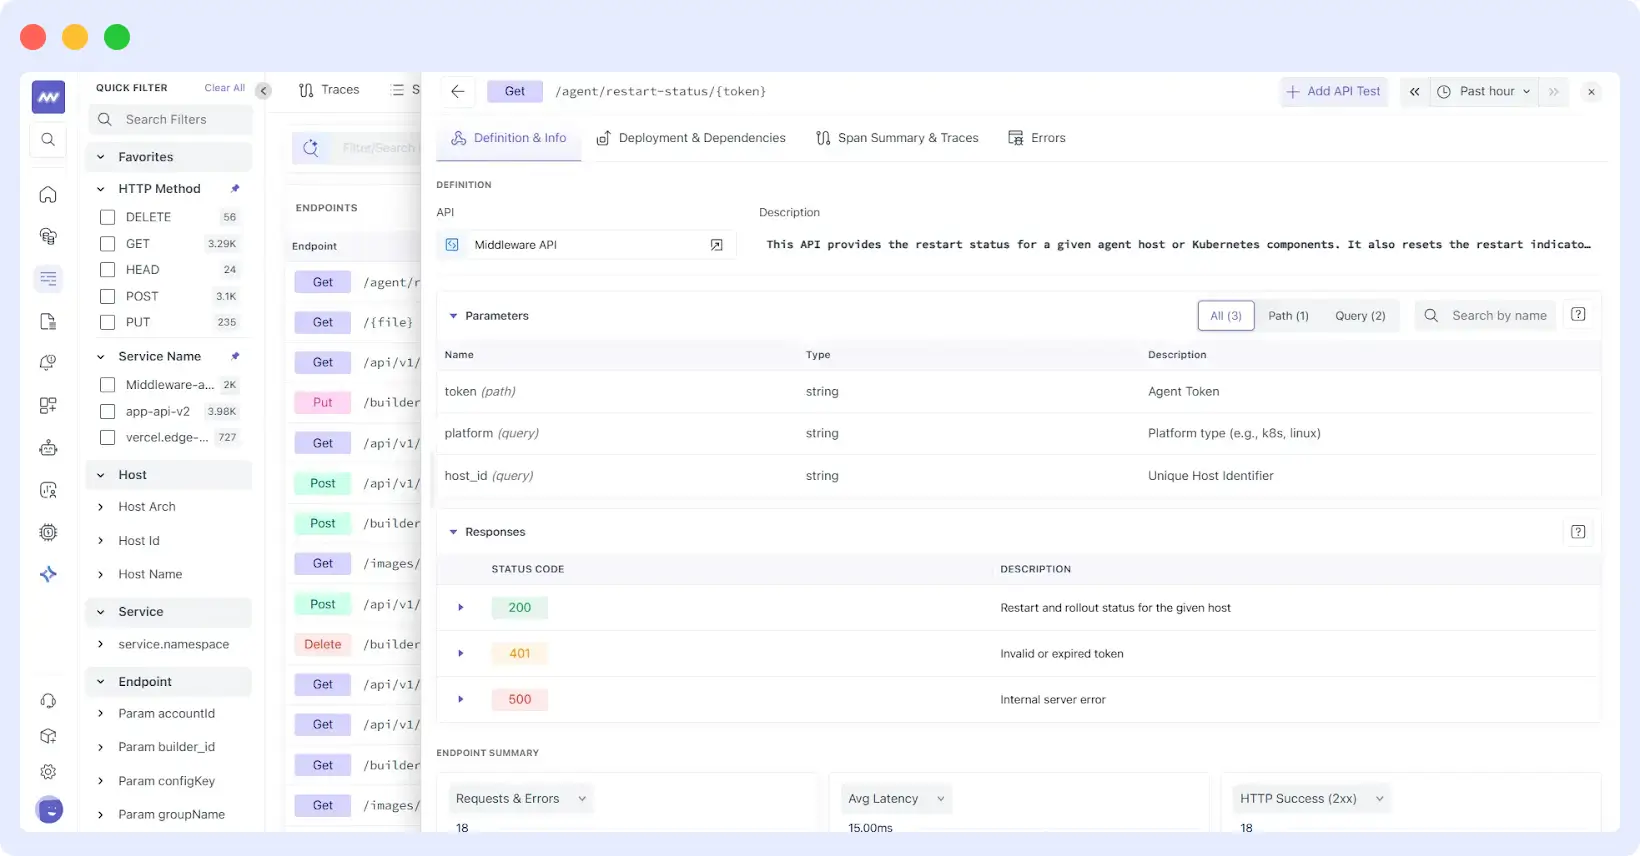
Clicking into an endpoint opens a dedicated command center that separates the “what” (the definition) from the “how” (the performance):
- Definition & Info: Explore parameters (Path, Query, Header, Body) and documented response codes directly alongside live data.
- Span Summary: A breakdown of where time is spent, whether in PostgreSQL queries, downstream HTTP calls, or internal functions.
Where Endpoint Monitoring Helps the Most
Slashing MTTR during Incidents
When a service alert fires, the fastest way to respond is to pinpoint the exact failing route. Endpoint Monitoring lets you sort your API list by “Error Rate” or “P99 Latency” instantly. Instead of triaging a whole service, you start your investigation from the impacted route, reducing the time spent in “war rooms.”
⭐ Learn how OpsAI helps you resolve issues: Once you’ve identified a failing endpoint, use our OpsAI Co-pilot to instantly analyze traces and suggest a fix, moving from detection to resolution in seconds.
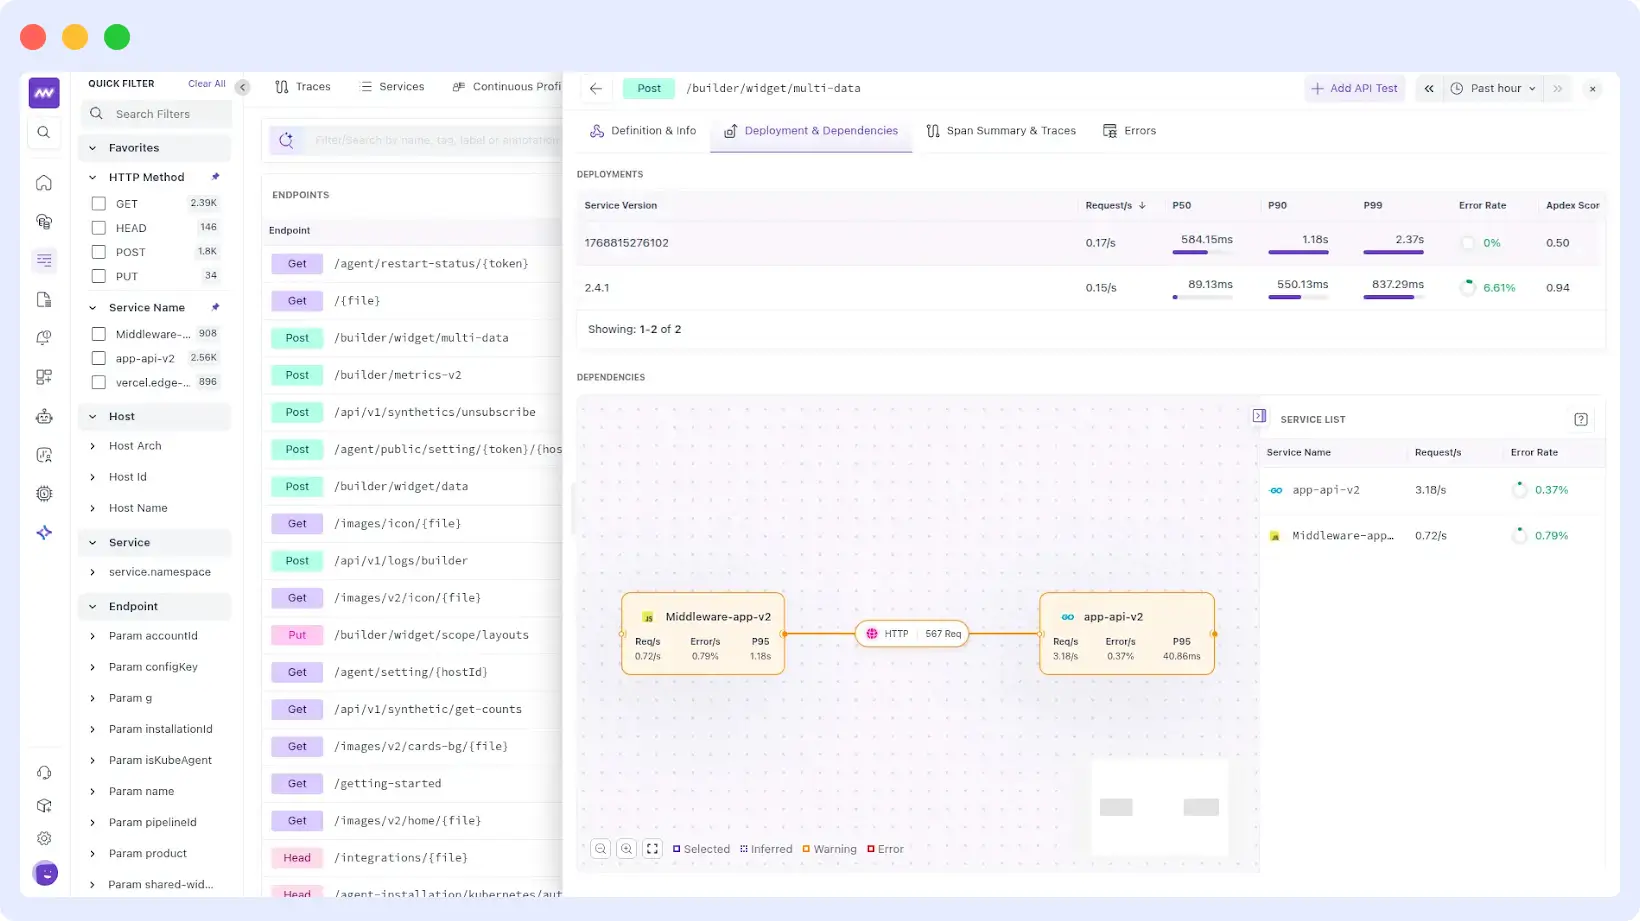
Zero-Regression Deployments
The Deployments view allows you to compare endpoint performance across different service versions. You can validate whether a new release changed the behavior of a specific route by comparing Apdex scores, error rates, and latency percentiles between v1.0 and v1.1.
Pinpointing Bottlenecks (Code vs. DB vs. Network)
The Span Summary groups the work happening under an endpoint by dependency type. If an endpoint is dragging, you can instantly see if 80% of the duration is spent in a database call or an internal function. This eliminates the “blame game” between database and application teams.
Onboarding & API Compliance
For new team members, the Endpoints screen acts as a live map. They can see what endpoints exist, read their descriptions from the OpenAPI spec, and understand real-world traffic patterns without digging through outdated wikis.
Shared Context, Faster Resolution
The value of Endpoint Monitoring compounds when teams share a unified view. The generic dashboard link is useful, but it doesn’t explain the contract. Sharing a trace is granular but lacks context.
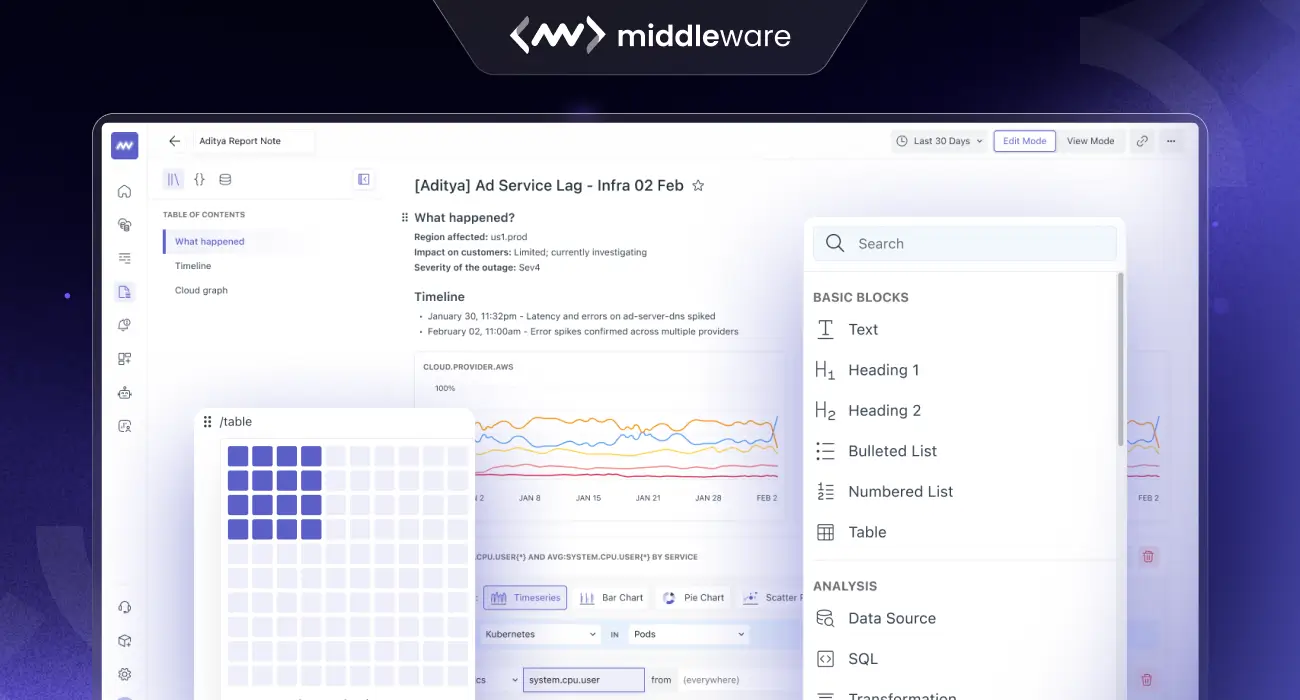
Pro-Tip: Found a performance regression? Click “Add to Notebook” to drop your endpoint charts and trace evidence into a Middleware Notebook for a collaborative incident report.
Sharing an Endpoint Detail view gives your coworkers the narrative: the documented intent of the API, the current performance reality, and the specific spans causing the delay. It turns “I think this route is slow” into “Here is the proof, the contract, and the bottleneck.”
Stop Guessing. Start Monitoring at the Route Level.
Middleware Endpoint Monitoring turns your API documentation into a living, breathing part of your observability stack. By combining the engineer’s intent with the system’s evidence, we’re making API management faster and more reliable.
Ready to see it in action?
- Existing Customers: Navigate to APM → Endpoints in your Middleware sidebar.
- New to Middleware? Experience Middleware for free and see how Endpoint Monitoring brings your entire team onto the same page.