You have built a robust and feature-rich application, and the fate of your entire data operation lies within a PostgreSQL database to ensure seamless interactions, fast data retrieval, and reliable transactions for your users.

However, without proper PostgreSQL monitoring in place, you lack a comprehensive understanding of how your database is performing in real time!
This article discusses PostSQL monitoring and key performance metrics to keep an eye on to gain valuable insights into the health and efficiency of your PostgreSQL instance.
This knowledge enables you to correct slow queries, node failure, and replication errors.
Key PostgreSQL monitoring metrics
When monitoring your PostgreSQL instance, the following are key performance metrics to keep a tab on:
System resource monitoring
Monitoring system resources enables you to keep track of infrastructures and various resources your PostgreSQL instance utilizes.
They help you identify when your system’s resources are being heavily utilized and take proactive measures to prevent system incidents.
The following are metrics to look out for when monitoring system resources:
a. CPU usage
This metric measures the percentage of CPU capacity being utilized by the PostgreSQL database. High CPU usage could indicate inefficient query execution, resource contention, or suboptimal query plans.
To be more effective, set an alert that notifies you whenever the capacity reaches a certain usage threshold, preferably between 70% – 80%.
This will help make proactive decisions that improve CPU utilization. Also, monitor locking activity to prevent potential contention issues and deadlocks.
b. Memory usage
Monitoring memory usage helps you understand how much memory PostgreSQL is consuming and ensures that It has enough memory available to perform operations efficiently.
Low memory availability can lead to swapping, degrading performance. Monitoring memory usage helps you prevent events that could crash the database and slow down the systems it is running on.
You’ll also need to keep a tab on the buffer cache hit ratio, which indicates how often PostgreSQL can fulfill requests from memory instead of disk.
c. Storage
Keep an eye on disk usage, particularly table and index bloat, to ensure that there is enough available space and to maintain optimal database performance. Slow disks impact PostgreSQL’s speed.
The trick is to set up alerts that notify you when your set threshold is surpassed.
d. Network
This metric helps you understand the volume of incoming and outgoing data within your system. It is relevant for troubleshooting network-related issues and planning for network capacity.
When your database network misbehaves, it can result in overflooding of storage with logs. Monitoring the metrics helps you detect the root cause of a network problem, which sometimes is caused by poor network setups and hardware failures.
Database monitoring
Database metrics help you to understand the performance of the PostgreSQL database.
a. Read query throughput and performance
Monitoring the throughput and latency of read query allows you to track and guage how efficiently PostgreSQL is handling SELECT operations. In this metric, you’ll find vital information such as buffer hits, number of fetched rows, and index usage.
It also helps you identify potential issues with fetching data. One of the many ways to detect issues with slow querries
is to run the EXPLAIN command. Oftentimes, dead tuples, invalid queries, and misconfiguration are the causes of slow queries.
b. Write query throughput and performance
Keeping an eye on write query throughput and latency provides you with insights into the efficiency of data modification operations such as INSERT, UPDATE, and DELETE. You’ll know a fast query and ones that take longer times to execute, as well as the number of times they were run.
c. Active Sessions
This metric gives you a snapshot of how many active sessions are currently connected to the database. It allows you to anticipate resource contention and plan for scalability.
The default maximum number of connections configured for PostgreSQL is 100. You may need to change the parameter according to your needs to avoid connection failure when the requests exceed 100.
d. Replication and reliability
Monitoring replication status, lag, and the overall reliability of your replication setup helps you maintain high availability and data consistency across replicated instances.
For production systems, switching to clustering architectures will be helpful as they distribute workload across replicas.
e. Logs
Keeping an eye on PostgreSQL logs helps you identify errors, warnings, and informational messages, which are vital for troubleshooting and auditing database activity.
Within PostgreSQL logs are metrics about connection and disconnection, including long-running queries, authentication issues, deadlock or FATAL errors.
Top 10 PostgreSQL monitoring tools
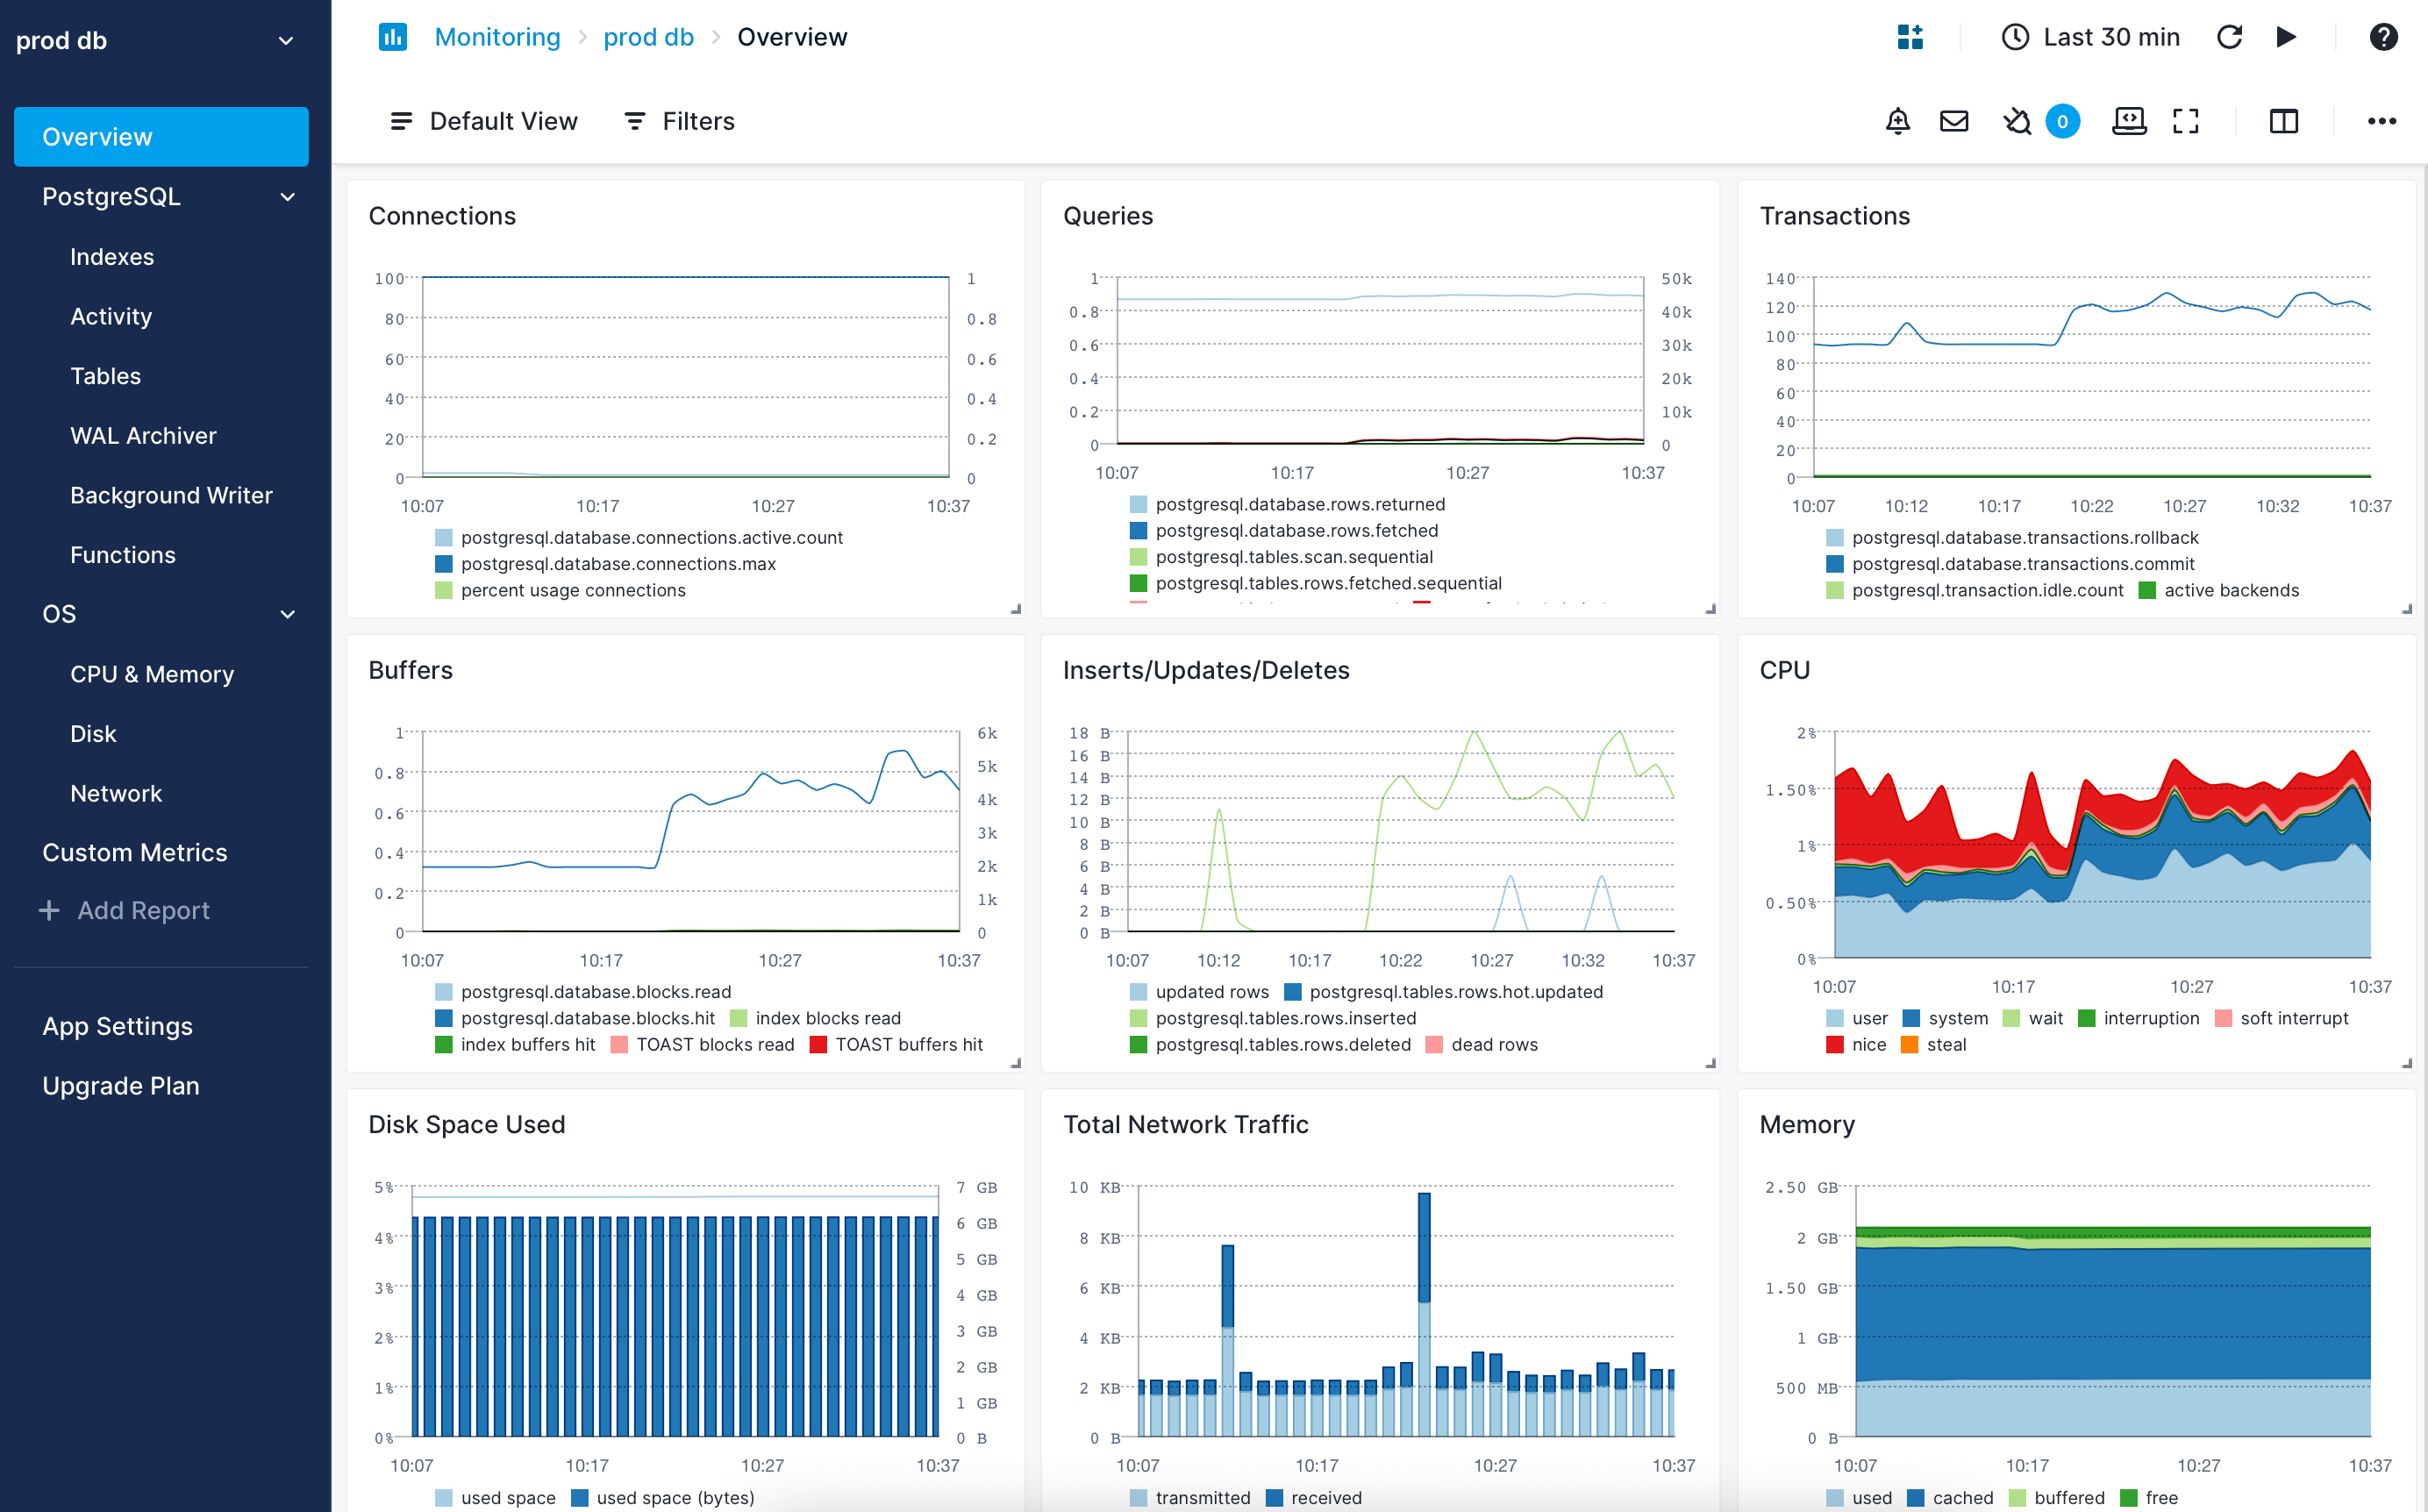
Middleware
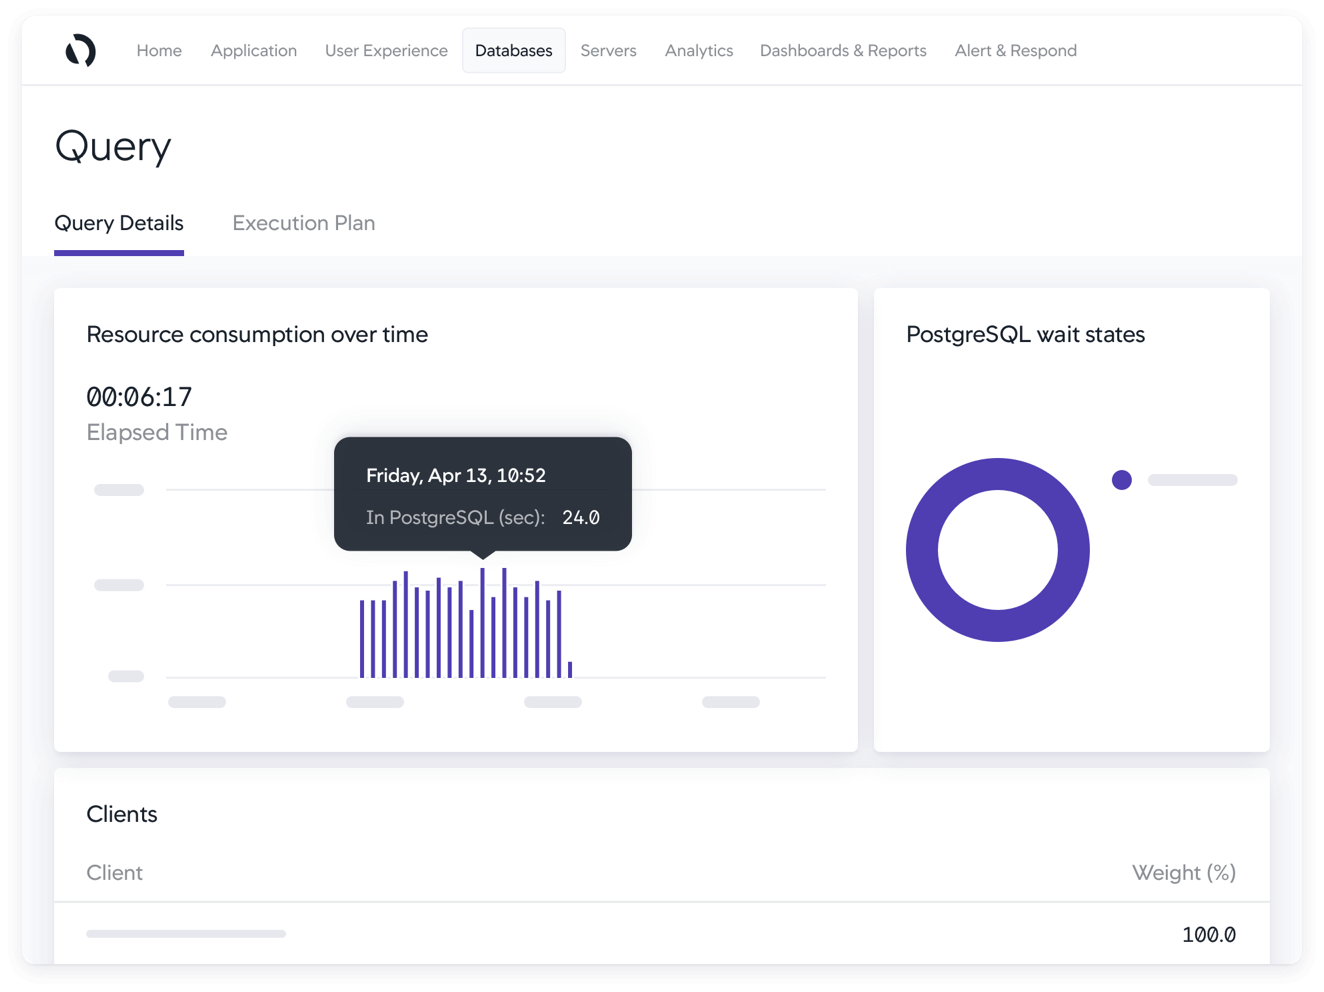
Middleware is a full-stack cloud observability platform with dashboards that offer end-to-end visibility and simplify data analysis for systems and applications. It seamlessly integrates with PostgreSQL for the automatic collection of metrics and their display in a dashboard.
On Middleware, you can create a custom dashboard that meets your needs and eases your monitoring exercise. You can also configure alerts to trigger anomaly detection and notify you when certain conditions are met.
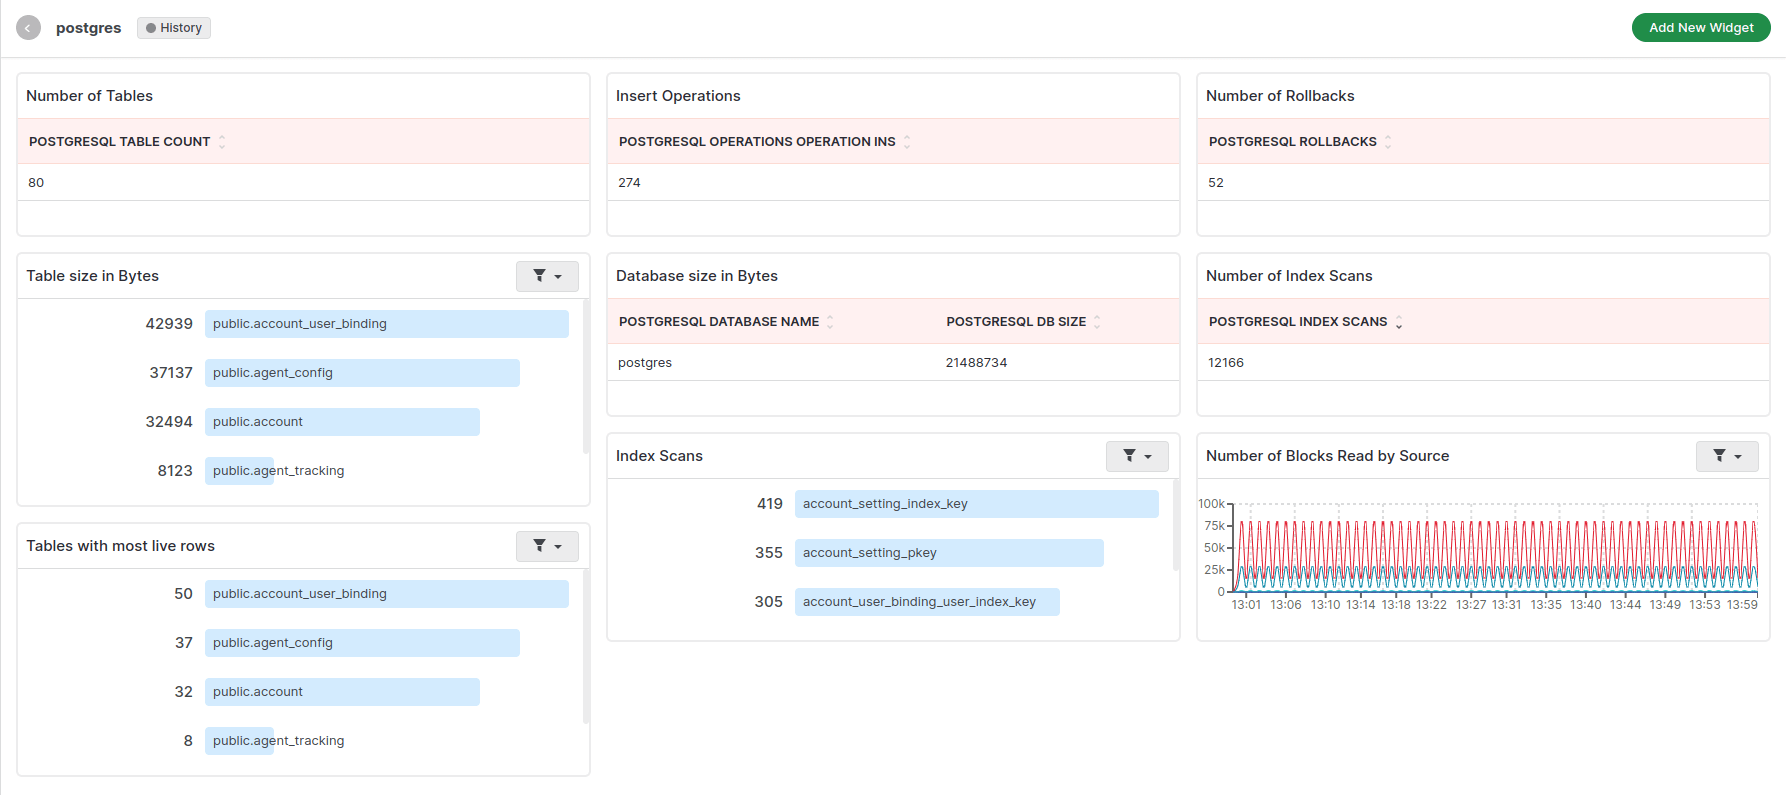
Middleware is an efficient PostgreSQL monitoring software that supports all the key PostgreSQL metrics in addition to postgresql.backends, postgresql.bgwriter.duration, postgresql.commits, postgresql.rows, et al.
You’ll swiftly identify and fix issues across your PostgreSQL instances with Middleware. On the Middleware PostgreSQL integration page, you’ll find a simple guide to installing the Middleware PostgreSQL agent and getting it working in a few minutes.
Features
- Centralized monitoring.
- Provides end-to-end visibility into your PostgreSQL instance.
- Automatic correlation of metrics, logs, and traces.
- Smart alerts with algorithms for root-cause analysis and recommendations.
- Offers enterprise-level security and complies with GDPR, CCPA, and SOC 2.
- Provides 24/7 technical support.
Pricing
Middleware offers a 14-day free trial with unlimited data ingestion. After the trial, users can opt for the pay-as-you-go plan at $0.30/GB for metrics, logs, and traces. Middleware also offers custom pricing for enterprises. Check Middleware pricing.
Start your 14-day free trial and monitor your PostgreSQL database today.
Datadog
With Datadog, PostgreSQL metrics are collected automatically and displayed in one place for your observation. This visualization enables you to correlate metrics for in-depth analysis.
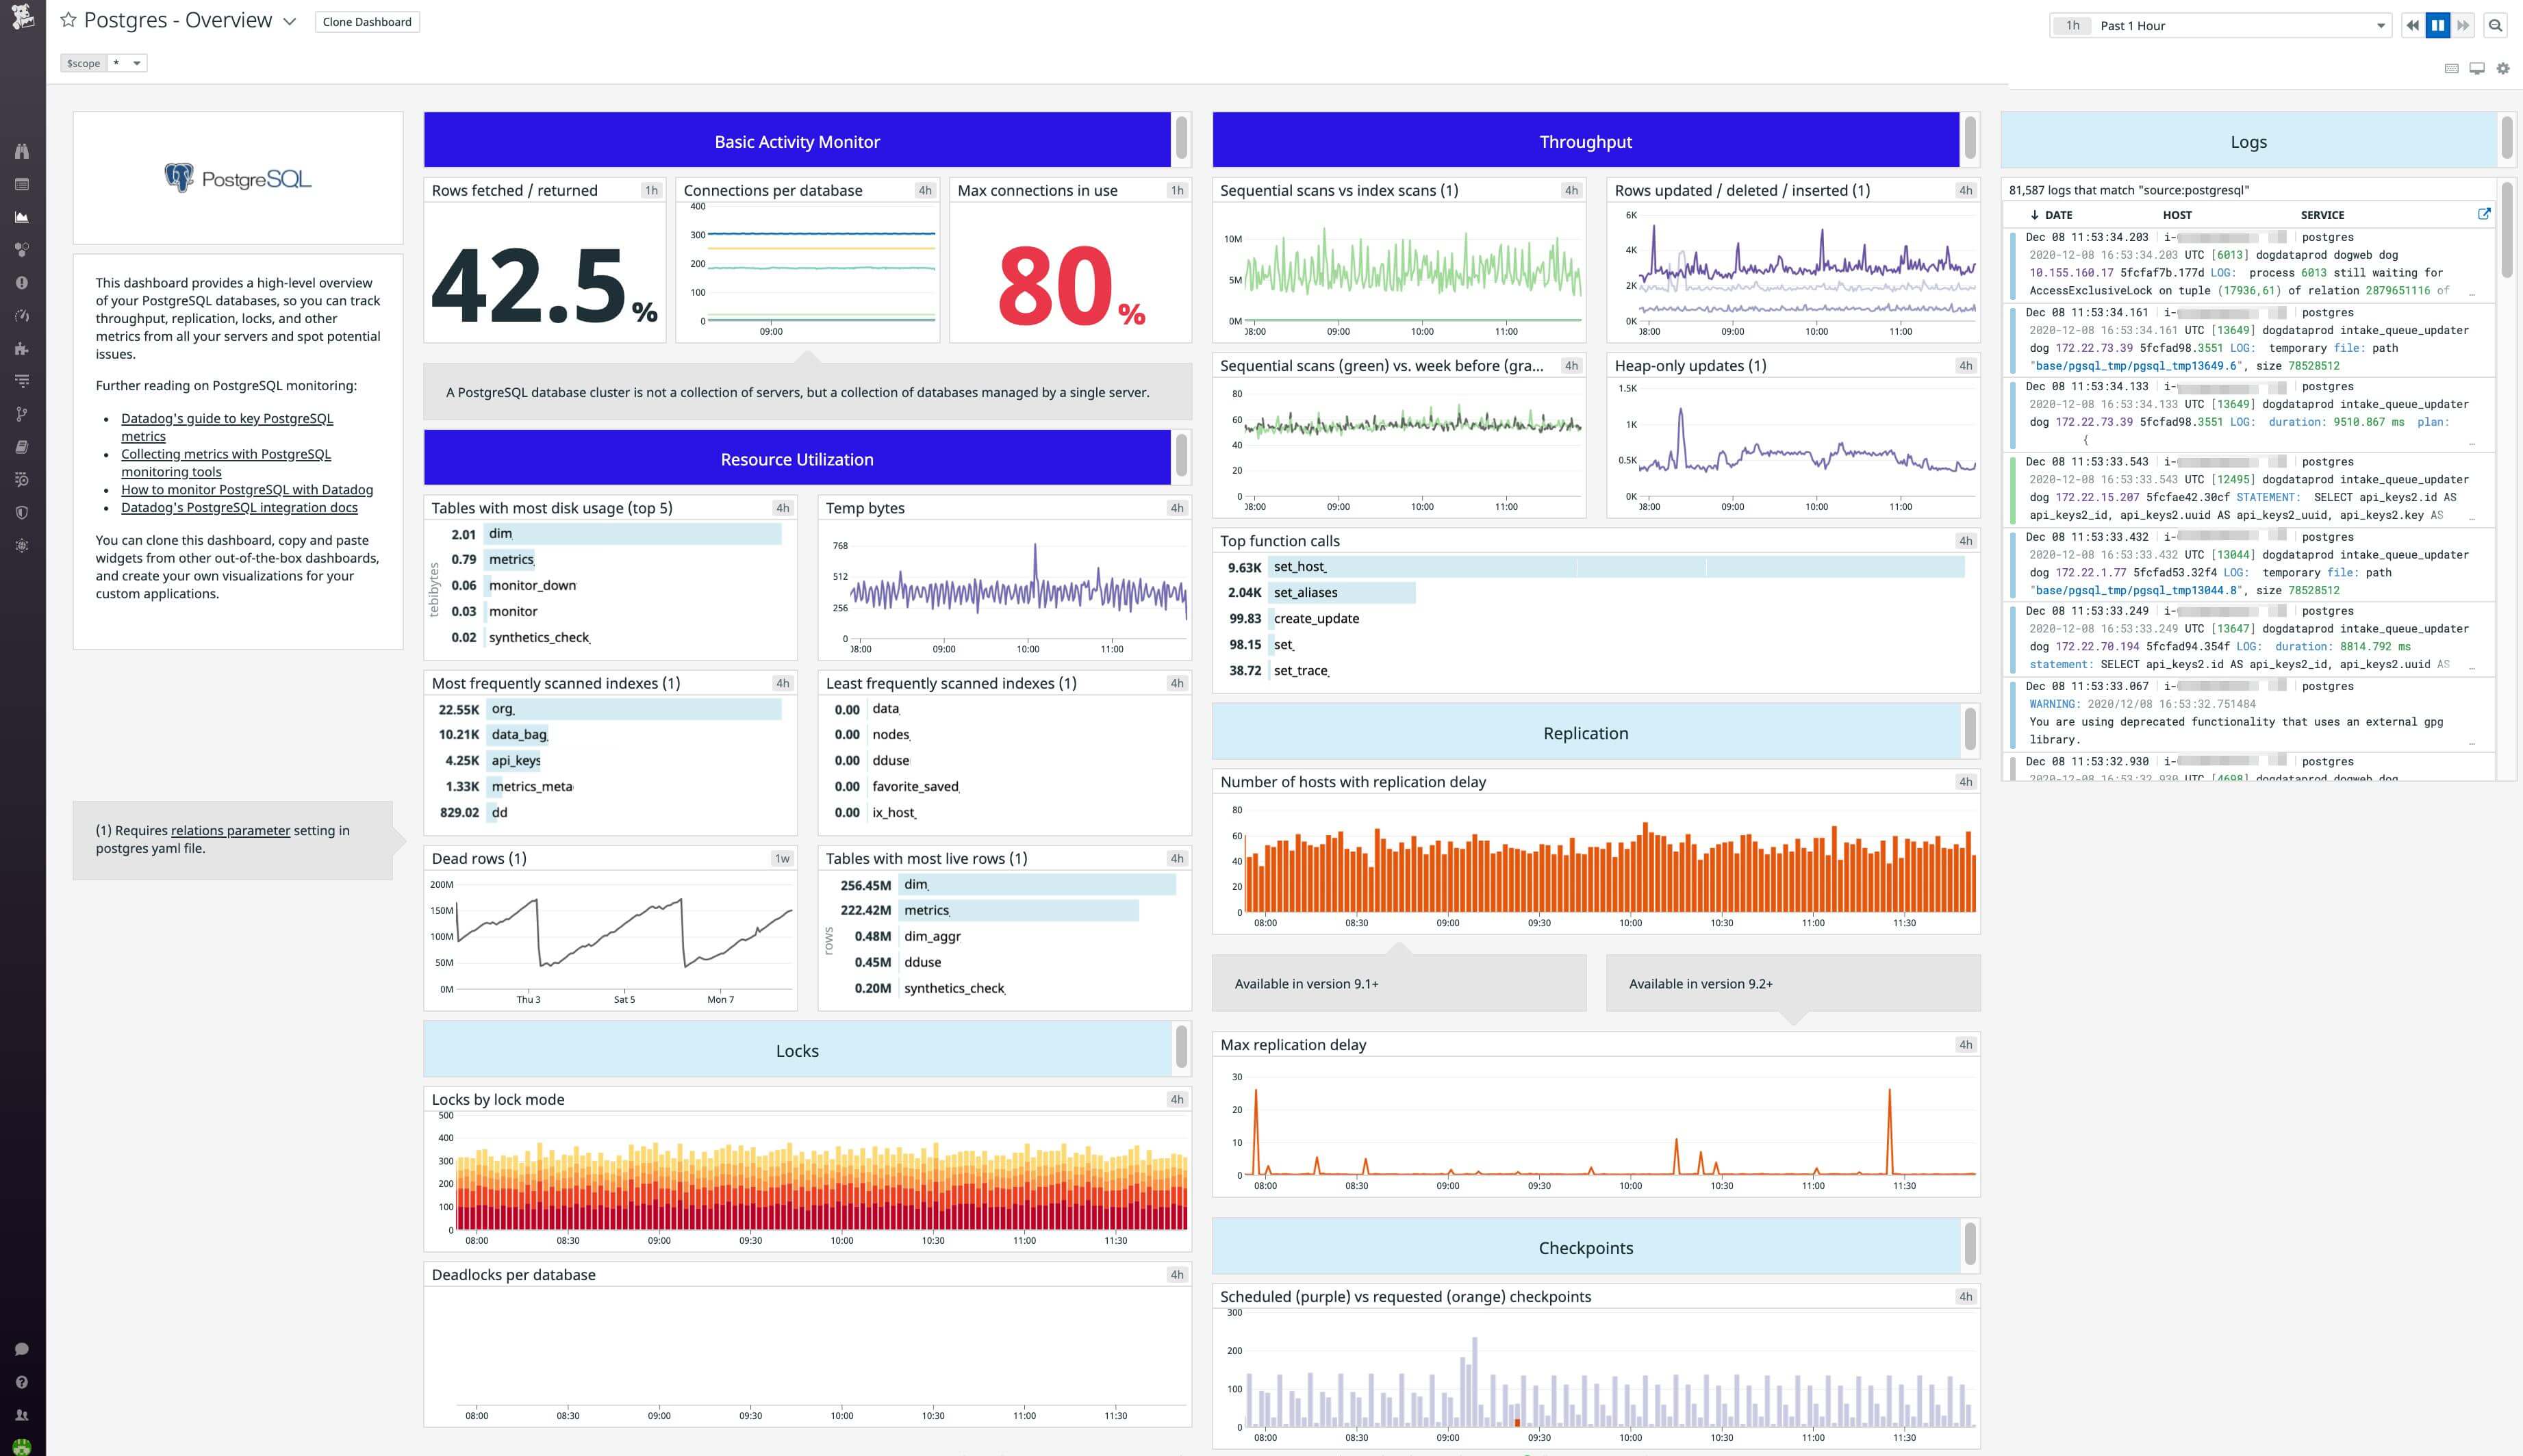
In addition to this, Datadog supports tracing with your database queries, allowing you to pinpoint which service is malfunctioning as well as the cause of the issue.
Pros
- End-to-end application tracing.
- In-depth query and log analysis.
- Supports system and database metrics.
- Allows metrics correlation for rapid issue identification.
Cons
- No self-hosted option.
- Advanced query optimization is not supported for PostgreSQL.
- Limited reporting and analytics.
Pricing
Datadog charges based on the number of agents or hosts. You will pay $70/per agent and have to pay extra for logs, traces, and any other features you want. It has a 14-day free trial without limitations.
See yourself why teams choose Middleware over Datadog.
Prometheus and Grafana
Prometheus and Grafana are open-source monitoring tools for monitoring applications, systems, and databases. While Prometheus collects data from the system, Grafana is integrated with it to visualize the collected data.
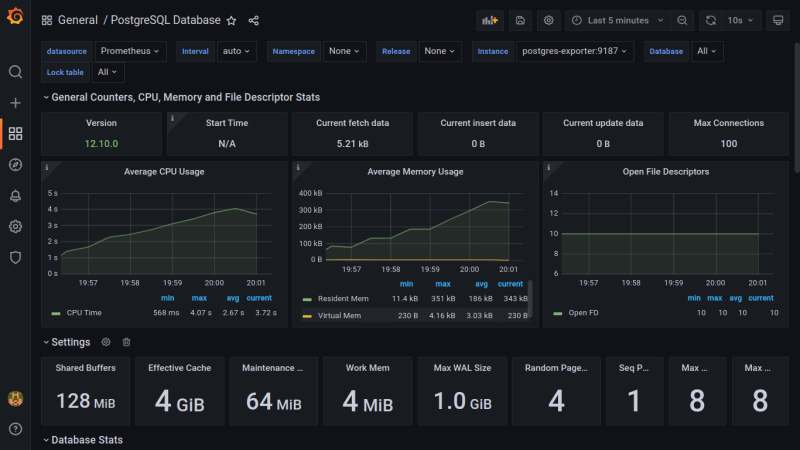
The collaboration of these tools is well-suited for monitoring PostgreSQL metrics.
Pros
- Automatically discover services.
- They have strong community support.
- Monitors both system and database performance metrics.
- Allows configuration of custom •PostgreSQL metrics not included by default.
Cons
- Managing Prometheus instances is complex.
- Manual setup and maintenance of Prometheus exporters.
- Time-consuming.
- Lack of log analysis features.
Pricing
Prometheus is free while Grafana has a freemium model. They offer 10k metrics, 50GB logs and other features for free and post that limit, you need to pay for every feature which at the end, piles up just as equal to any other observability tool.
Sematext
Sematext is a performance monitoring tool that analyzes logs, metrics, and traces. It seamlessly integrates with PostgreSQL for performance monitoring.
In the Sematext control plane, you can set up features such as visualizations, alerts, and insights for proper visibility into and analysis of all your PostgreSQL metrics. Sematext also possesses an inbuilt PostgreSQL Log integration where you can discover warnings, errors, and slow queries.
Pros
- Support queries analysis.
- Log analysis.
- Supports both system and database performance metrics.
- Correlation between metrics.
- Real-time database performance monitoring.
Cons
- Lack of support for custom PostgreSQL metrics from extensions like pg_stats_statments.
- Limited support for transaction tracing.
Pricing
Sematext charges per node or agent in your PostgreSQL cluster, and there’s a 14-day free trial with no limitations regarding its features.
Pganalyze
Pganalyze is a monitoring tool created for the PostgreSQL database. It gives automatic insights into Postgres query plans and enables you to perform query drill-down analysis.
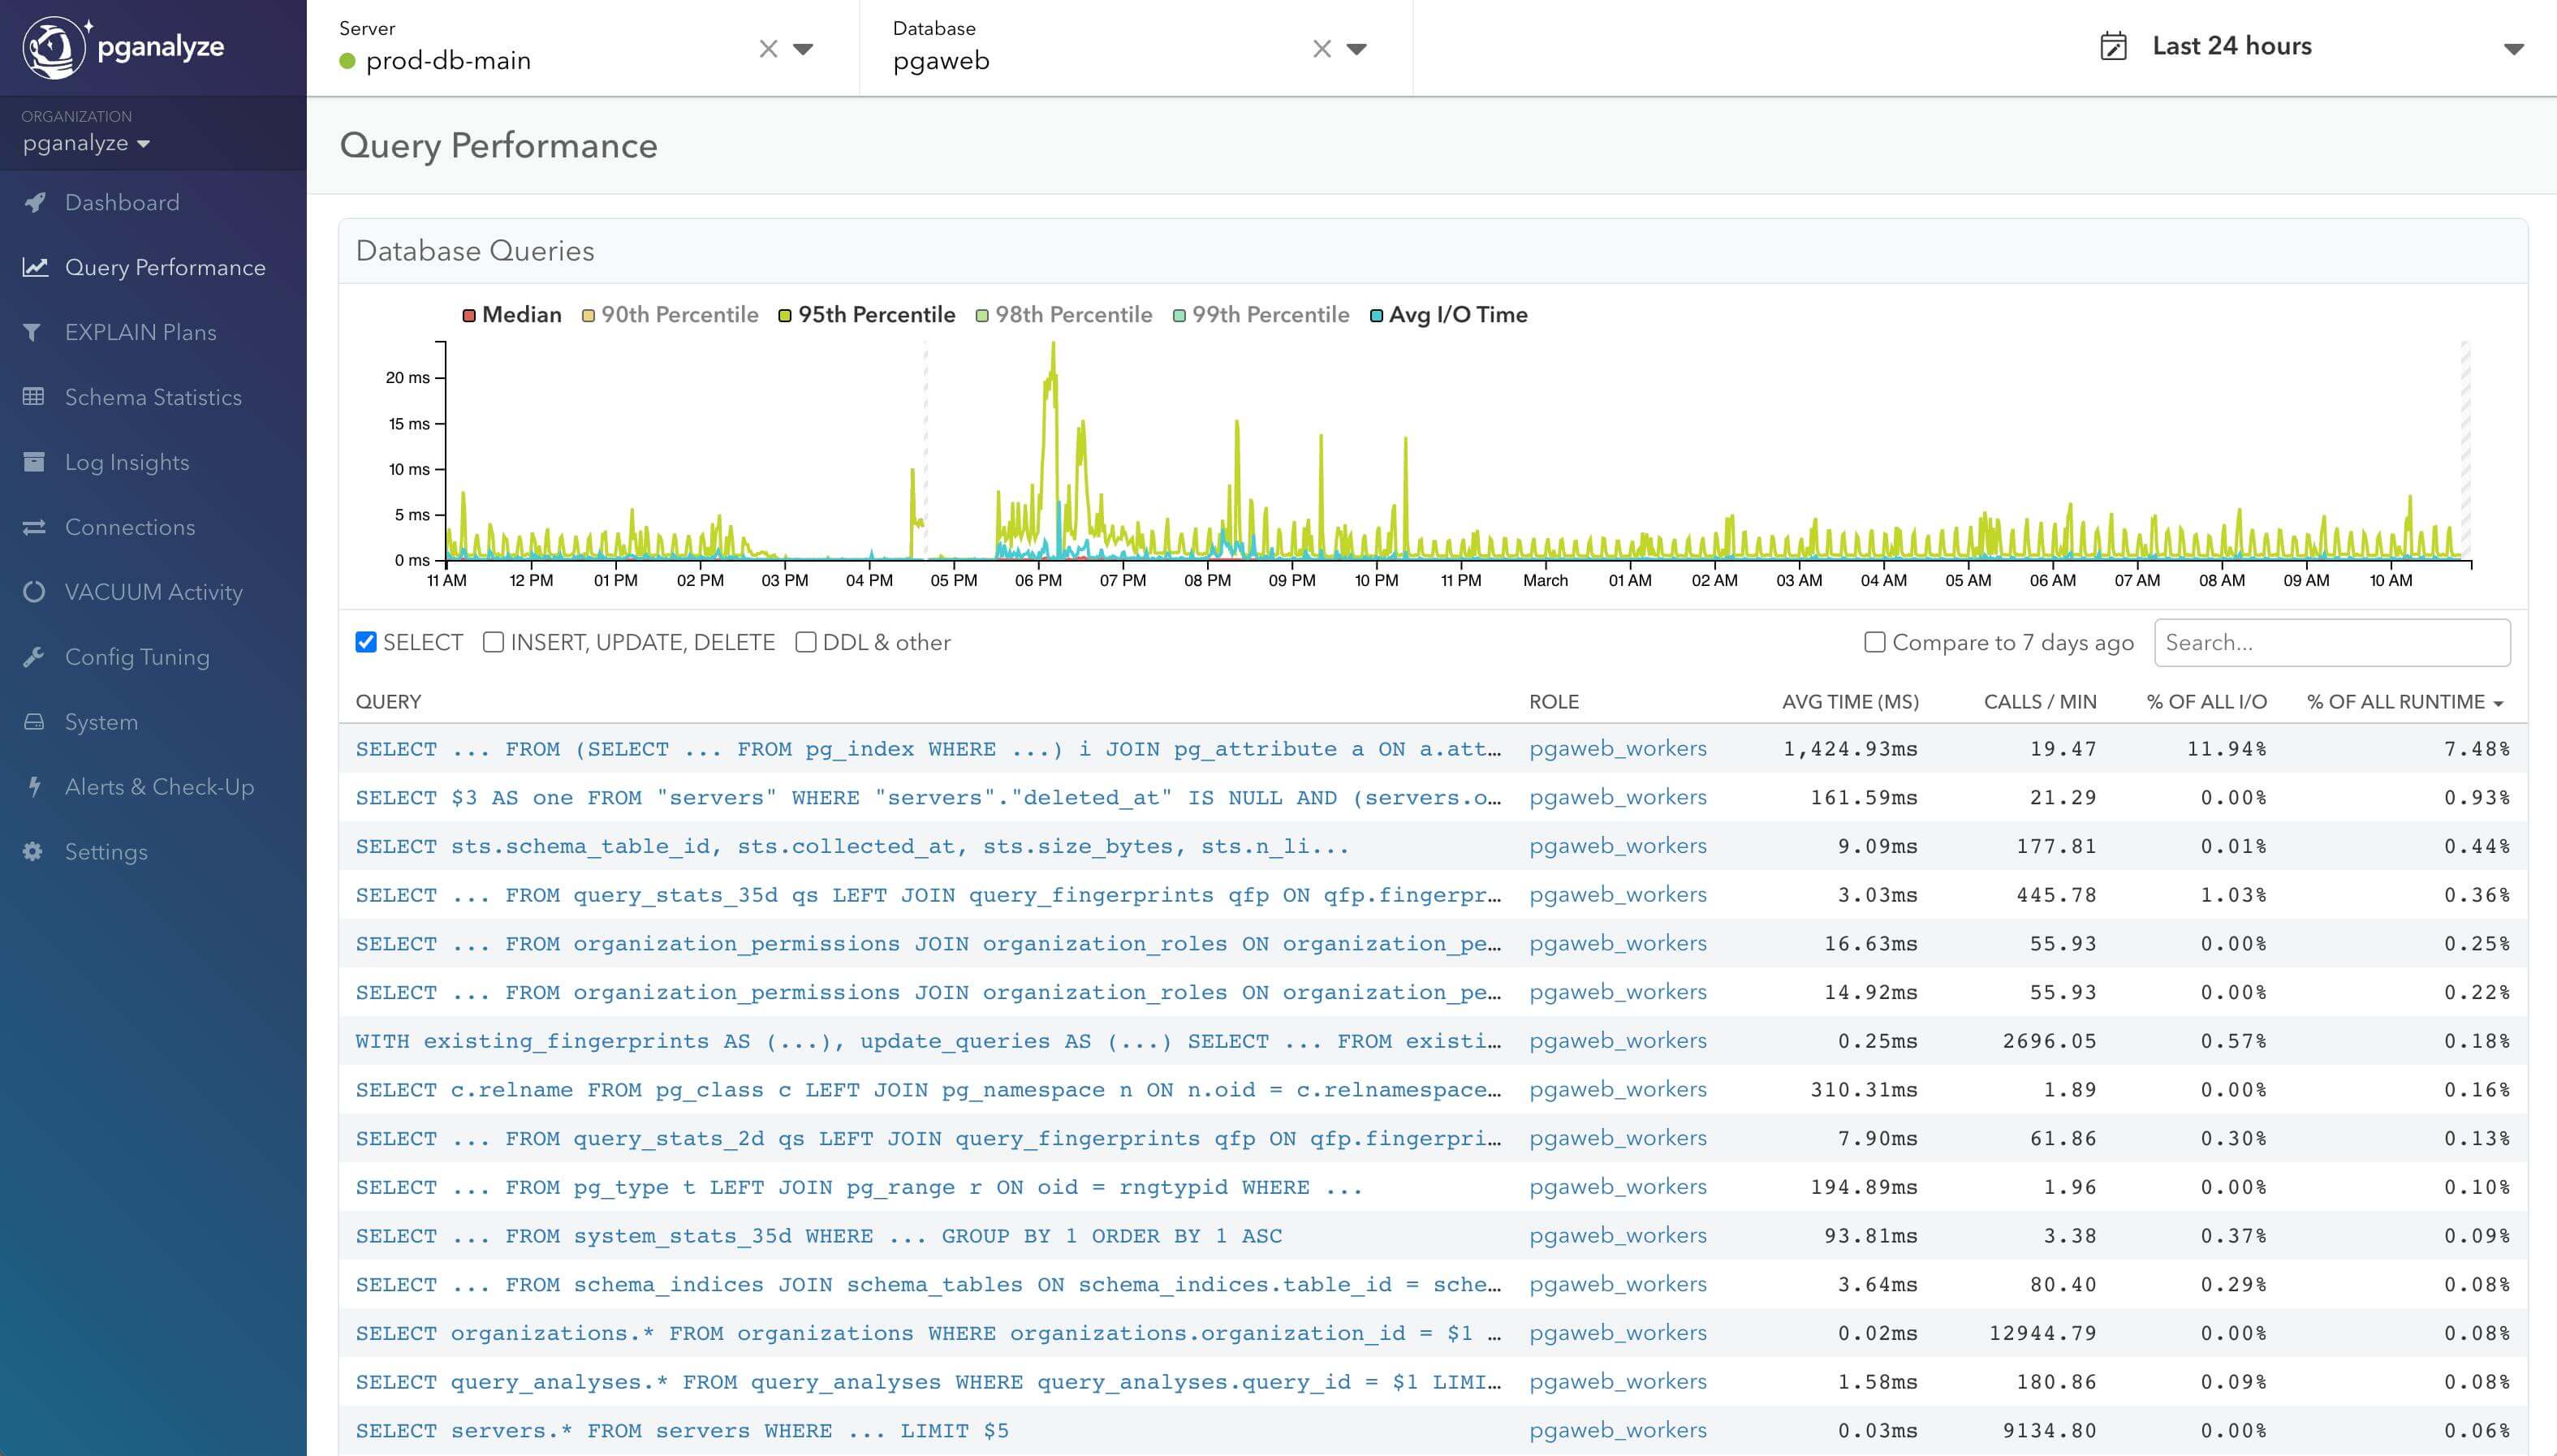
You can also observe per-query statistics and conduct trend analysis through one platform.
Pros
- Tailored specially for Postgres.
- Detailed query execution analysis.
- Offers log analysis.
Cons
- Lacks support for system-level metrics.
- Not a comprehensive monitoring tool.
- No alert support.
Pricing
Pganalyze charges per database with Production Plan, Scale Plan, and Enterprise Plan options. It comes with a 14-day free trial.
pgDash: Great PostgreSQL monitoring tool
Also designed specifically for PostgreSQL monitoring, pgDash displays every metric that relates to PostgreSQL at the database level.
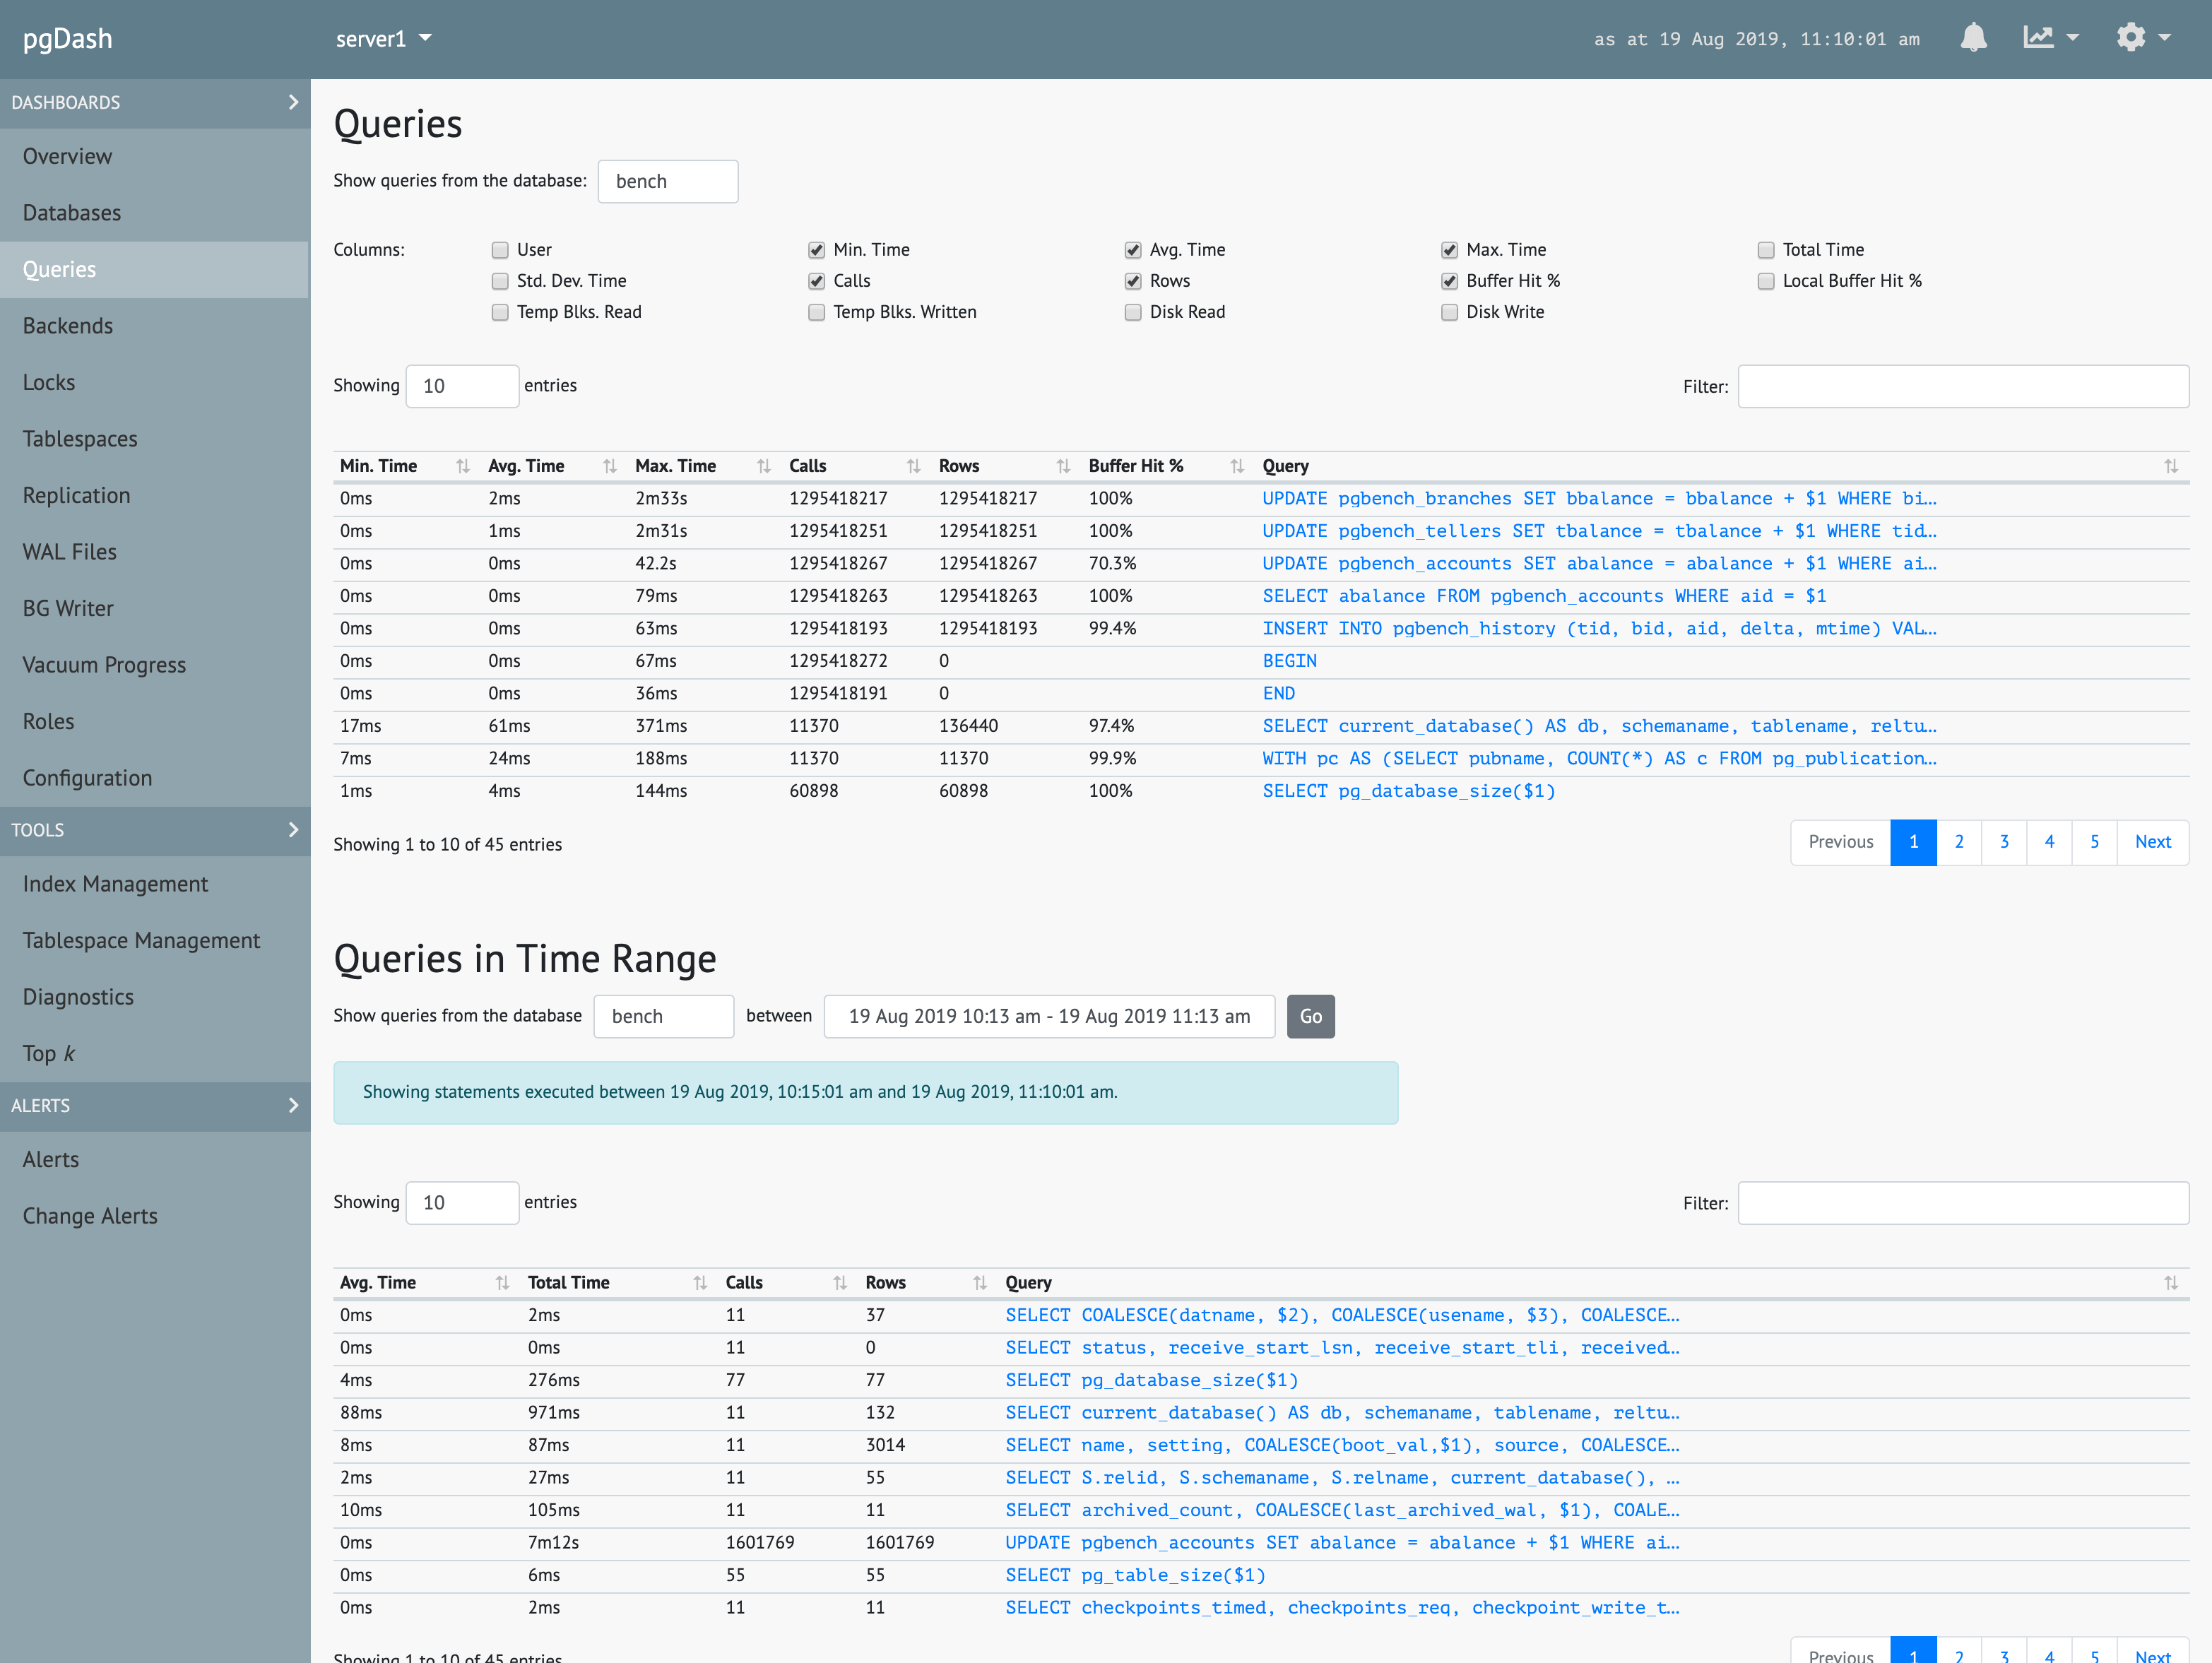
Its alerting feature integrates with various alert tools such as Slack, PagerDuty, Webhooks, among others.
Pros
- Specially built for PostgreSQL.
- Provides query analysis.
- Offers recommendations for optimization.
- Built with alerting features.
Cons
- Only database-level metrics.
- No metrics correlation.
Pricing
PgDash charges per database with Basic Plan, Pro Plan, and Enterprise Plan options. It also comes with a 14-day free trial.
AppDynamics
AppDynamics is a monitoring tool for observing system and application performance. It works with PostgreSQL and gathers enormous metrics for insight and analysis.
Pros
- Supports both system and database-level metrics.
- Correlates application performance metrics with database metrics.
- Provides query performance optimization suggestions.
- Employs AI for anomaly detection and alerts.
Cons
- No self-hosted version available.
- Limited tutorials and documentation.
- Its complex UI requires training to use effectively.
Pricing
AppDynamics charges per CPU core and has a 15-day free trial.
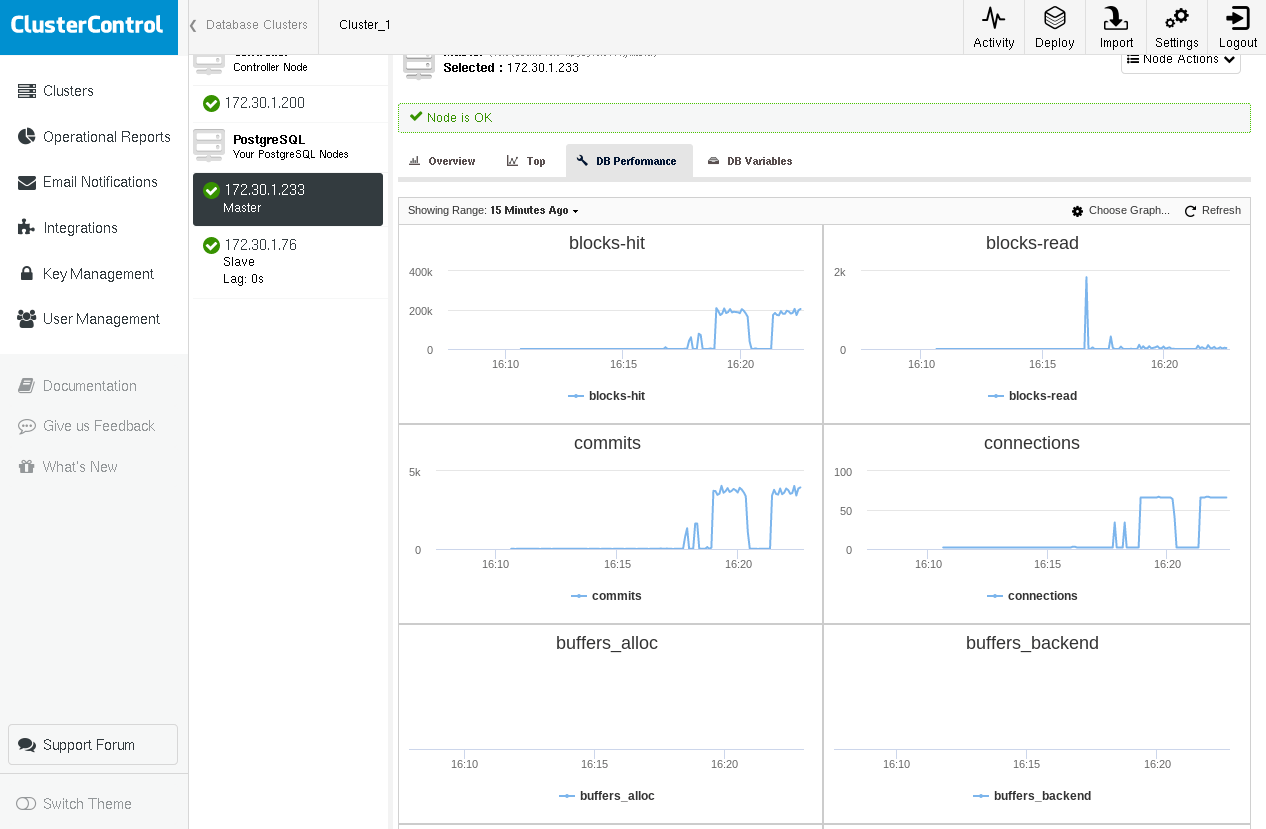
ClusterControl
ClusterControl is a database management system that allows you to deploy, monitor, manage and scale your database environments. It works seamlessly with PostgreSQL.
Pros
- Simplifies the creation and management of PostgreSQL clusters.
- Supports database-level and system-level metrics.
- Enables instant deployment of production-ready databases.
- Provides query performance analysis.
Cons
- Has more management features than monitoring.
- Lacks log analysis features.
- Lacks metrics correlation ability.
Pricing
Although it runs free services, it has limited features that can only be enjoyed with its Enterprise plan.
Nagios
Nagios is an open-source monitoring tool for monitoring hosts, networks and services. Integrated with PostgreSQL, it enables you to configure alerts with different states and thresholds.
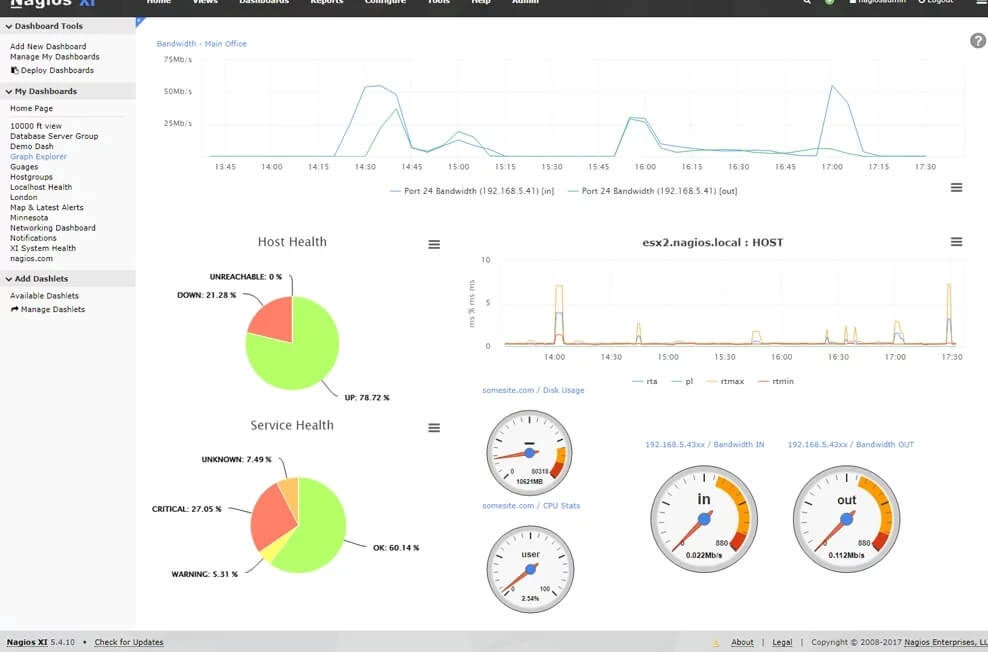
Nagios offers the implementation of various plugins for seamless database monitoring.
Pros
- Enables self-hosted mode in a private network.
- Supports system-level metrics.
- Integrates with third-party solutions.
Cons
- Not PostgreSQL-specific.
- Lacks query analysis.
- Lacks optimization recommendations.
- It has operational overhead.
Pricing
Although free to use, it has an Enterprise version with additional features. The enterprise version is also free until you exceed seven nodes.
Zabbix: Open-source PostgreSQL monitoring tool
Zabbix is an enterprise-class open-source monitoring tool for monitoring networks and applications.
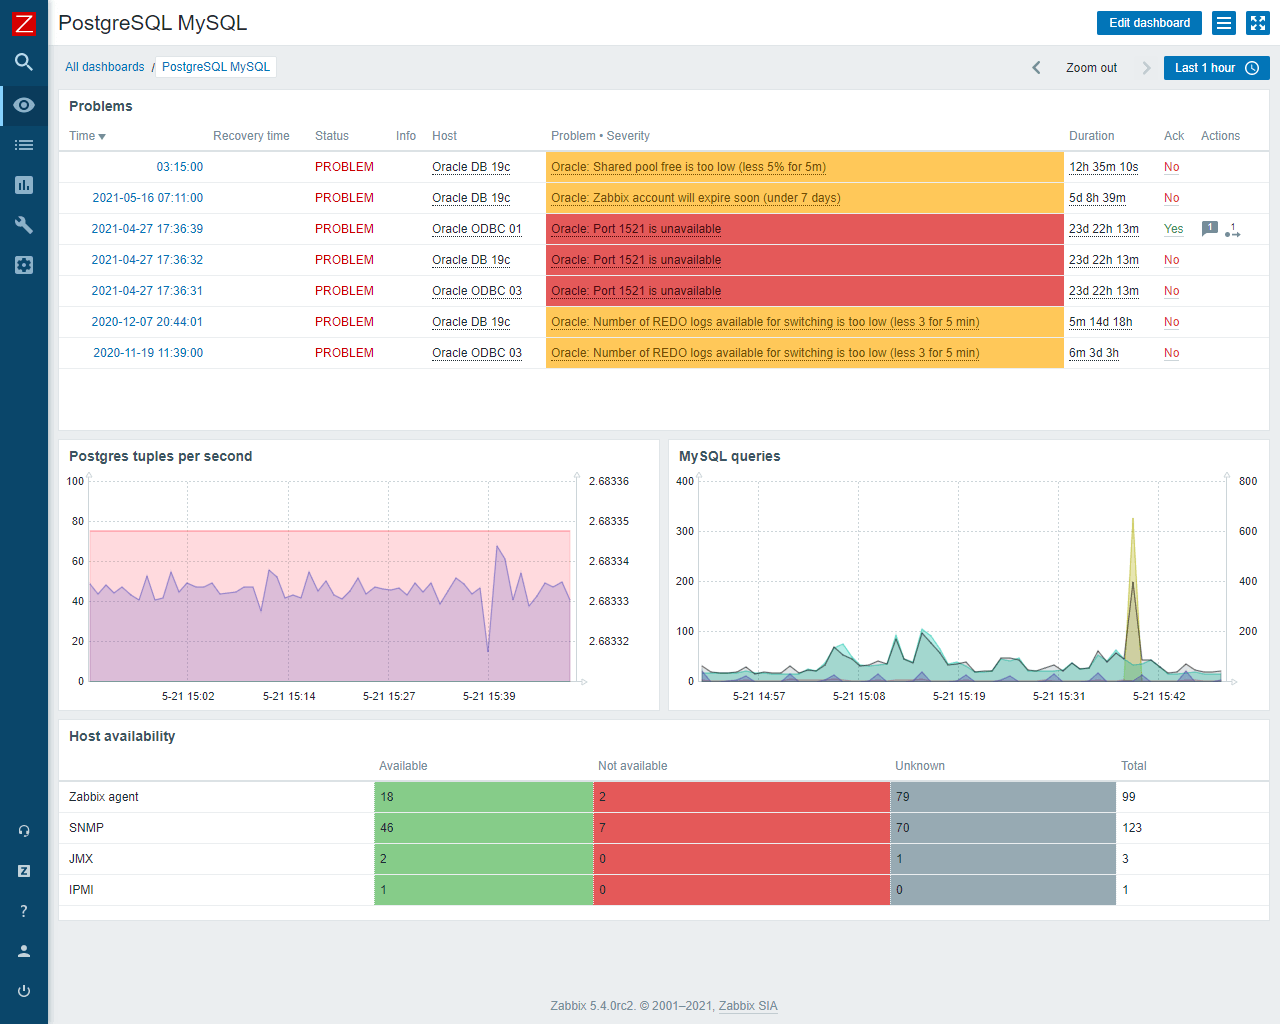
Once set up with PostgreSQL, it automatically collects its metrics and displays them on a single dashboard with customizable charts for visibility and analysis.
Pros
- Centralized monitoring with performance graphs.
- Trigger and alert customisation.
- Vast integration and collaboration.
Cons
- Steep learning curve.
- Incomprehensive documentation.
Pricing
Totally free without limitations.
Best Practices for Monitoring PostgreSQL Performance
While it is vital to understand key metrics to observe while monitoring PostgreSQL performance, it is equally important to follow PostgreSQL monitoring best practices for effective monitoring exercise.
The following are some crucial best practices to know:
- Keep a watchful eye on the critical system and database metrics to gauge the overall health of the system.
- Regularly analyze slow queries, query execution times, and index usage to identify and address any bottlenecks in the system.
- Monitor the utilization of database resources such as connections, locks, and temporary files to ensure efficient allocation and usage.
- Set up proactive alerts for critical thresholds such as high CPU usage, low disk space, or database connection limits being reached to respond swiftly to any potential issues.
- Regularly analyze database logs to identify abnormal events, errors, or performance degradation.
- Monitor database growth patterns to plan for future capacity needs and avoid unexpected resource constraints.
- Regularly monitor the status and performance of database backups and always ensure the ability to recover data in case of failure.
- Stay updated with PostgreSQL’s latest releases and patch updates, as each new release often includes performance improvements, bug fixes, and security enhancements. This ensures that your database is running on the most stable and secure version of PostgreSQL available.
- Utilize an efficient PostgreSQL monitoring software that enables you to track database performance, correlate metrics, analyze query execution, and set up alerts against triggers and thresholds.
Conclusion
Knowing the right PostgreSQL metrics to observe is one thing; using the right monitoring solution is another. Middleware contains every feature and functionality you need for your PostgreSQL monitoring.
From automatic correlation of metrics to metric segmentation for both system and database-level metrics to its smart alerting system that is armed with predictive algorithms, Middleware is a comprehensive solution for monitoring PostgreSQL.
See for yourself. Try Middleware now!