The process of monitoring large data volumes serves multiple essential purposes, including system maintenance, early anomaly detection, and informed decision-making. The process of data understanding becomes simpler through visualization tools, which transform raw logs, metrics, and traces into dashboards and charts that users can easily understand and take action on.
The open-source tools Kibana vs Grafana are among the most frequently used tools for data visualization. The two tools share comparable objectives, yet they operate with different data types and application scenarios.
This article presents a comprehensive comparison between Kibana and Grafana to help operational teams select the most suitable tool for their needs.
What is Kibana?
Kibana, an open-source data visualization platform, is part of the Elastic Stack (formerly known as ELK Stack), which comprises Elasticsearch, Logstash, and Kibana. Through its visual interface, Kibana enables users to search and interact with Elasticsearch data storage.
The system connects directly to Elasticsearch clusters, translating user interactions into Elasticsearch queries. Through Kibana, users can develop dashboards while performing searches and applying filters to visualize patterns in logs, metrics, and other indexed data.
Key Features of Kibana
Visualizations: The platform enables users to create various visualization types, including bar charts, line graphs, pie charts, heatmaps, data tables, and geospatial maps.
Dashboards: Enables users to merge multiple visualizations into a single view for real-time monitoring of key metrics and system status. These dashboards can be filtered, edited, and shared.
Canvas: Enables users to create pixel-perfect presentations and infographics from real-time data with complete control over layout and styling.
Lens: Users can create visualizations by dragging and dropping elements into the interface. The interface makes it easier for users who do not want to write queries, and no knowledge of Kibana is needed.
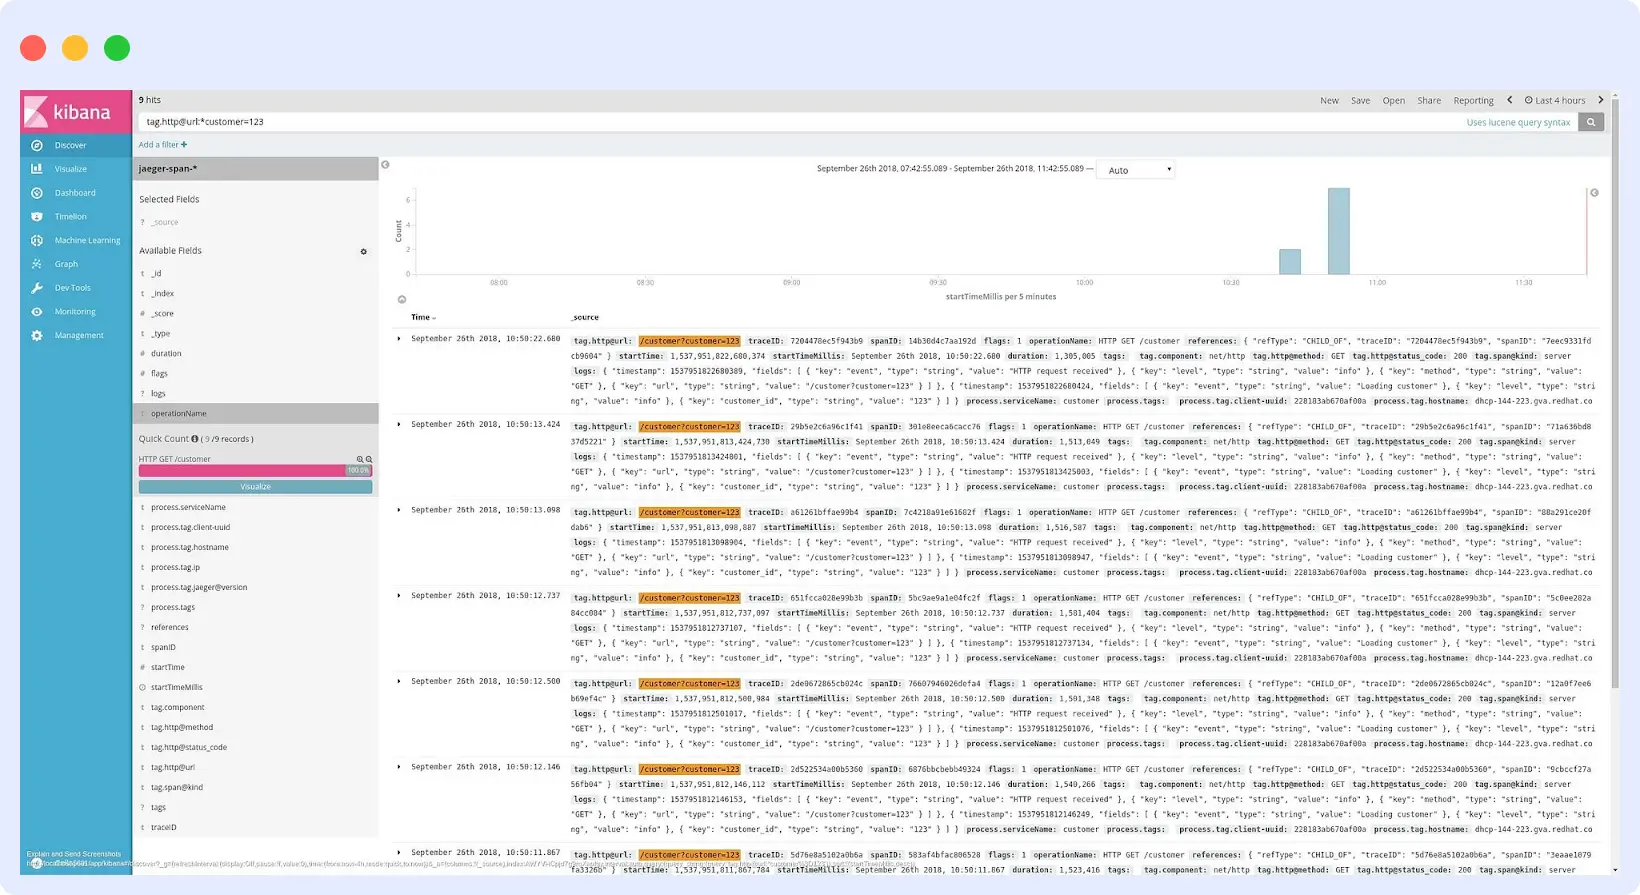
Data Exploration: Allows users to interactively search, filter, and analyze large volumes of log and event data in Elasticsearch using the Discover interface.
Powerful Search and Query: Use Kibana Query Language (KQL) or Lucene query syntax to perform advanced searches and filter large datasets with precision.
Use Cases of Kibana
- Log analysis and fixing application issues
- Monitor application performance and user activity
- Explore large datasets stored in Elasticsearch
- Visualize the time-series data using various tools like Time Series Visual Builder and Timelion
- Create business intelligence dashboards from Elasticsearch data
What is Grafana?
Grafana is an open-source observability platform for metrics visualizations and monitoring. The platform was initially designed for use with time-series data but has since been expanded to accommodate various data sources, providing customized dashboards to monitor infrastructure, business, and application metrics.
Grafana executes queries against bound data sources, such as Prometheus, InfluxDB, MySQL, PostgreSQL, and Elasticsearch, in the source’s native language. The results are presented in tunable dashboard panels for different use cases. You can create dashboards that display rolled-up data from multiple systems in a single view, enabling end-to-end monitoring after configuring the data sources.
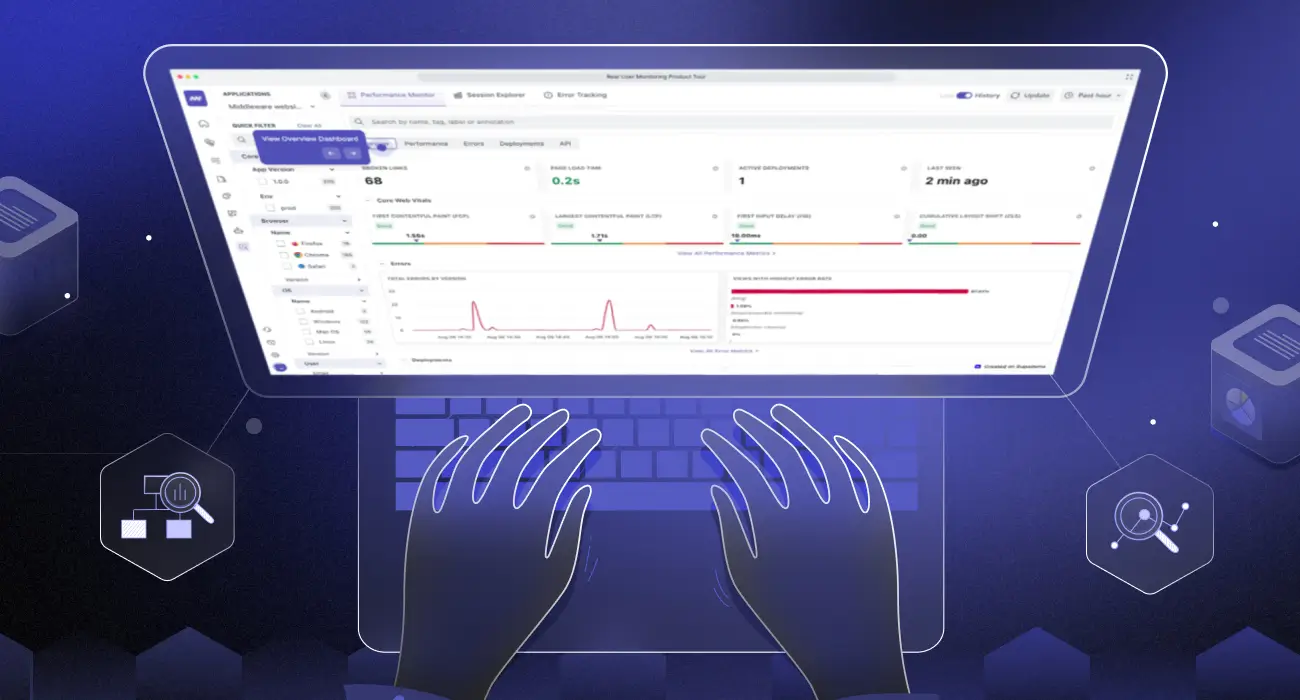
According to users who switched, Middleware delivers 3× better data correlation and 4× faster troubleshooting compared to Grafana — all with a one‑minute installation.
Key Features of Grafana
Multi-Data Source Support: Integrate with various data sources, including Prometheus, InfluxDB, MySQL, PostgreSQL, Elasticsearch, and cloud monitoring tools such as AWS CloudWatch and Google Cloud Monitoring.
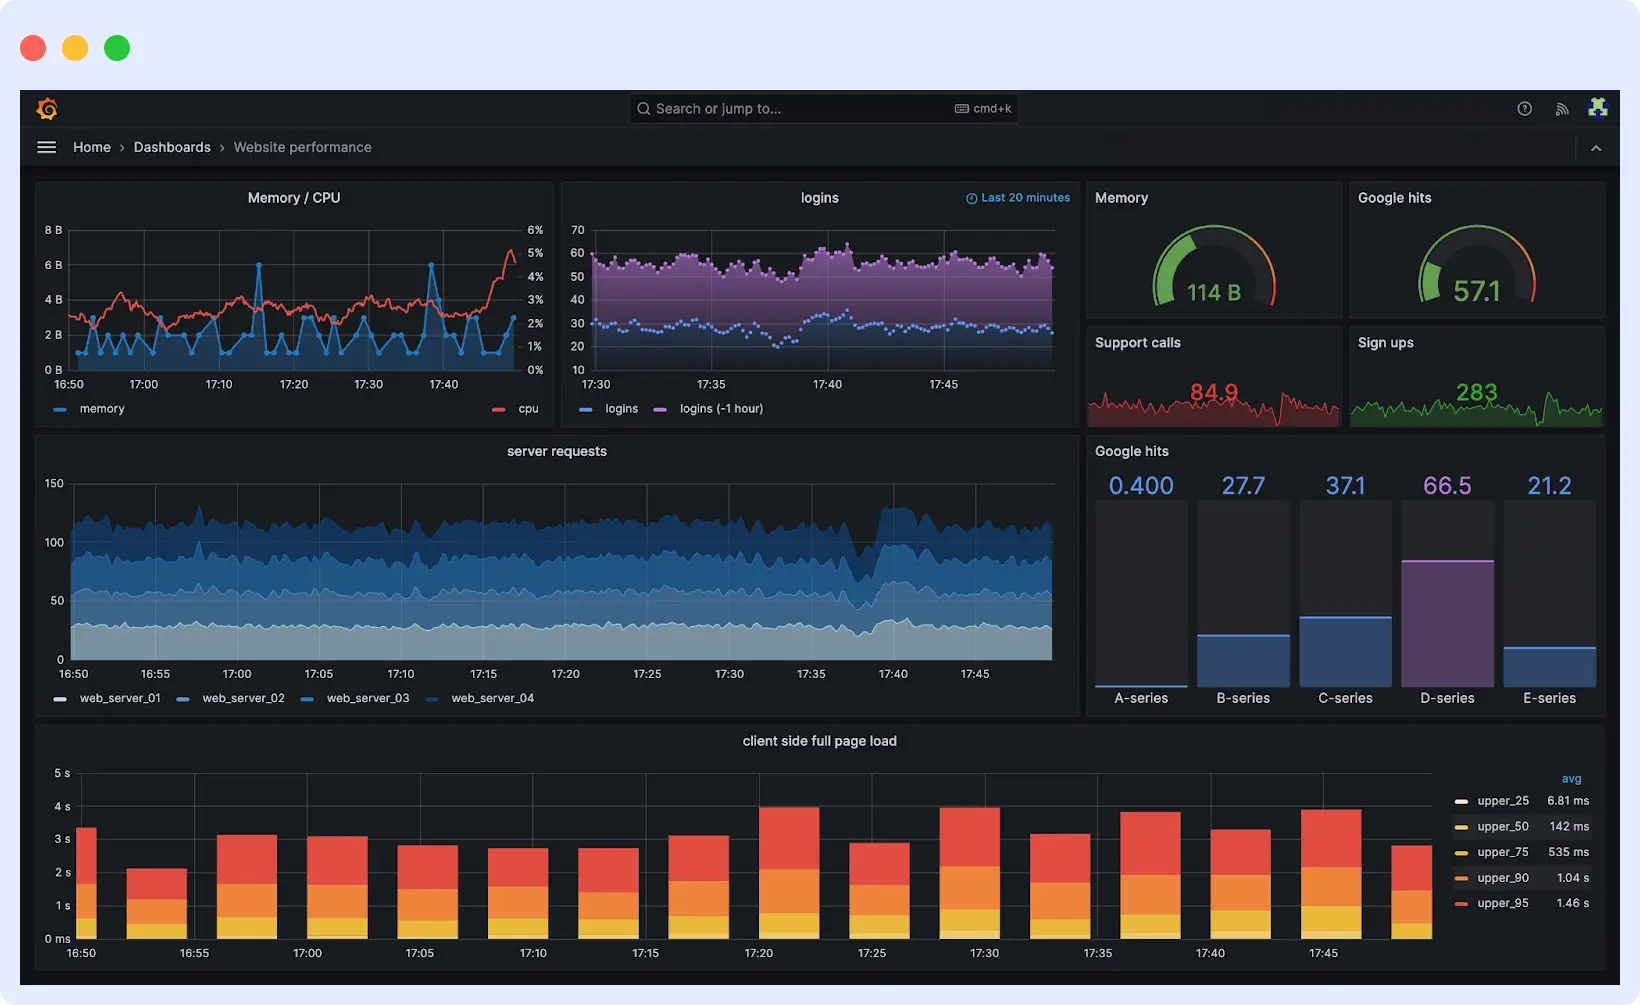
Visualizations: Offers various panels, including time-series graphs, bar charts, heatmaps, gauges, and tables, which are customizable to meet different monitoring needs.
Dashboards: Create multiple panels in the same dashboard view. Dashboards are shareable, duplicable, filterable, and configurable with variables to support dynamic exploration of the data.
Annotations: Add notes to the graphs to highlight important events and deployments.
Plugin Ecosystem: Offers an extensive marketplace of community and commercial plugins for data sources, visualizations, and app integrations.
Use Cases of Grafana
- Monitor infrastructure performance using metrics from systems and servers
- View time-series data across multiple sources in a single unified dashboard
- Set up alerts for crucial measures and limits
- Create business and operational dashboards for different teams
- Analyze trends across cloud services, containers, and microservices
If you’re also comparing tools like Prometheus or Middleware, check out this detailed comparison of Prometheus vs Grafana vs Middleware to get a broader perspective.
Kibana vs Grabana Comparison
Here’s a quick side-by-side comparison of Kibana vs Grafana to highlight their core differences:
| Feature | Kibana | Grafana |
| Primary Focus | Log and data exploration | Metrics monitoring and time-series visualization |
| Data source | Elasticsearch | Multi-source (Prometheus, InfluxDB, MySQL, etc.) |
| Query Language | Elasticsearch Query Language,Kibana Query Language (KQL) and Lucene. | Data source-specific (PromQL, InfluxQL, SQL) |
| Dashboard | Visual dashboards built on saved searches with support for filtering and interactivity | Customizable dashboards with templating, variables, and mixed data panels |
| Alerts | Rule-based alerts on data visualizations and thresholds | Built-in, highly flexible, with extensive notification channels |
| Plugins | Limited support | Extensive marketplace with 100+ plugins |
| Security | Role-based access control with support for LDAP and SSO | Role-based and team-based access control, with support for LDAP, OAuth, and SAML |
| Community & Ecosystem | Large, active community centered around Elastic Stack. | Large open-source community with active contributions |
| Licensing/ Pricing | Open-source with free basic features, advanced features are part of commercial subscriptions | Open-source with a generous free version. Commercial offerings like Grafana Cloud and Grafana Enterprise |
Detailed Comparison: Kibana vs Grafana
Kibana vs Grafana: Data Sources & Integrations
Kibana integrates tightly with the Elastic Stack and works best when data is stored in Elasticsearch. It visualizes data ingested through tools such as Logstash, Beats, or the Elastic Agent. This deep integration makes Kibana ideal for log management, security analytics, and APM use cases.
Grafana supports a wide range of data sources, including time-series databases like Prometheus and InfluxDB, SQL databases such as PostgreSQL and MySQL, and cloud services like AWS CloudWatch and Elasticsearch. It can connect to multiple sources within a single dashboard, making it ideal for monitoring mixed infrastructures. Its extensive plugin ecosystem further enhances flexibility, allowing integration with various data stores and services tailored to specific monitoring needs.
Verdict: Kibana is best suited for teams that operate entirely within the Elastic Stack. Grafana is better for installations that possess multiple/versatile data sources.
Kibana vs Grafana: Visualizations & Dashboards
Kibana offers a variety of visualization options, including line graphs, bar charts, pie charts, tables, heatmaps, and geospatial maps. It also supports time-series analysis through Timelion. Users can build dashboards by combining saved searches and custom visualizations.
Kibana enables users to explore data in real-time using the Discover interface and default dashboards. It also includes features like Lens, a drag-and-drop tool for creating visualizations, and Canvas for building presentation-style custom dashboards. The Discover interface supports interactive data exploration and ad-hoc queries.
Grafana offers highly customizable visualizations, including graphs, tables, gauges, and heatmaps. It excels at displaying time-series metrics and can aggregate data from multiple sources within a single dashboard.
Grafana supports dynamic dashboards through templating and variables, allowing users to adapt views for different servers or environments. Features like panel linking, layout control, and advanced styling make it ideal for both technical monitoring and high-level reporting.
Verdict: Both Kibana and Grafana excel at visualization. Kibana is best for Elasticsearch-based search and analytics, while Grafana offers more flexibility across multiple data sources and real-time metrics.
“There was a point where I had to use a separate tool just to log into our Kubernetes (K8) cluster and check if any pods had crashed. Now, I simply rely on Middleware’s alerts, which are reliable and fast”
Elijah Smith, Software Engineer III at Generation Esports
Kibana vs Grafana: Alerting & Notification
Kibana enables users to generate rule-based alerts based on conditions within logs, metrics, and other Elasticsearch data. Users can set up alerts through the interface, which can then be connected to channels, including email, Slack, and webhooks, via connectors. The advanced alerting capabilities of the Elastic Stack are primarily available within commercial subscriptions, which establish a strong connection to the paid ecosystem.
Grafana includes a built-in alerting system that works across all supported data sources. Users can create alert rules directly from panels, group alerts, and manage notification policies in one place. They can define multiple conditions, set thresholds, and specify test periods. Grafana also integrates with tools like Slack, Microsoft Teams, PagerDuty, and email, allowing for fully customizable alert distribution and escalation.
Verdict: Grafana offers stronger native alerting, even in its free version. Kibana’s advanced alerting usually needs paid Elasticsearch features.
Kibana vs Grafana: Ease of Use
Kibana has a clean interface, especially for users familiar with the Elastic Stack. Tools like Lens and Discover make it easier to explore and visualize data without needing to write complex queries. However, for teams new to Elasticsearch, the learning curve can be steep. Understanding how Elasticsearch indexes and stores data is crucial for effectively using Kibana.
Grafana is also easy to use in creating dashboard panels. The user interface is drag-and-drop, minimalist, and reusable-template-based, with clear onboarding directions. Setting up the data source is quick, and most operations provide in-context help. Querying is data source-specific, but creating basic dashboards and getting started is uncomplicated, even for beginners.
Verdict: Grafana is more flexible and beginner-friendly. Kibana suits users familiar with the Elastic Stack, but can be more challenging to adopt without an Elasticsearch background.
Kibana vs Grafana: Querying Language
Kibana uses KQL and Lucene to query Elasticsearch. KQL is user-friendly, featuring autocomplete and suggestions, while Lucene supports more advanced searches. For complex visualizations, users can also write JSON-based queries using Elasticsearch’s DSL. The query options are powerful but come with a learning curve.
Grafana doesn’t use a unified query language. Instead, it relies on each data source’s native language, like PromQL for Prometheus, SQL for MySQL, Flux for InfluxDB, or Lucene for Elasticsearch. This offers flexibility but creates a varied querying experience. To help less technical users, Grafana includes visual query builders for many sources.
Verdict: Kibana provides a consistent search experience for Elasticsearch, but it requires specialized syntax. Grafana supports multiple sources, but users must learn the query language for each source to utilize advanced features.
Kibana vs Grafana: Performance and Scalability
Kibana’s performance and scalability depend heavily on the underlying Elasticsearch setup. It handles large datasets well if the cluster is sized correctly and tuned. However, performance can suffer with complex dashboards or poorly indexed data. Scalability is also limited by Elasticsearch’s architecture, including shard and node management.
Grafana is lightweight and fast, with performance depending on the connected data source. Since it doesn’t store data, it’s highly scalable. Heavy workloads can be offloaded to the data source, and features such as caching, query optimization, and asynchronous loading help keep dashboards responsive, even at scale.
Verdict: Both tools are scalable, but in different ways. Kibana scales with Elasticsearch, making it ideal for large log volumes. Grafana scales horizontally and relies on the performance of its connected data sources.
Kibana vs Grafana: Security & Access Control
Kibana’s security features are built on the Elastic Stack’s model. It includes user authentication, role-based access control (RBAC), and audit logging. Users can isolate dashboards and data using Spaces, ideal for multi-team environments. Advanced features, such as SSO, LDAP, SAML, and field- or document-level security, require a commercial Elastic license.
Grafana supports role-based team access control. Users are assigned roles, such as Viewer, Editor, or Admin, and grouped into teams to manage shared permissions. Authentication methods include built-in user management, LDAP, OAuth, and SAML. While Grafana Enterprise adds features like advanced LDAP support and audit logging, the open-source version covers most standard security needs.
Verdict: Kibana is suitable for team use of the Elastic Stack but requires commercial features for advanced controls. Grafana offers flexible access controls to accommodate teams of all sizes, including the open-source version.
Kibana vs Grafana: Community & Ecosystem
Elastic maintains Kibana and is part of the larger Elastic Stack ecosystem. It benefits from strong official documentation, a growing set of integrations, and an active user community. Most plugins and features come directly from Elastic, with fewer third-party extensions compared to Grafana. Kibana’s ecosystem is tightly aligned with use cases like log management, observability, and security analytics.
Grafana has a large and active open-source community. It supports a broad plugin ecosystem, featuring hundreds of community- and vendor-built plugins for data sources, panels, and apps, as well as extensive community support through forums, GitHub, and various online resources. The Grafana Labs team actively supports community contributions and hosts events, such as GrafanaCON.
Verdict: Grafana boasts a more diverse and active community ecosystem, offering extensive plugin options. Kibana’s community is strong, but more focused on Elasticsearch-specific use cases.
Kibana vs Grafana: Pricing & Licensing
Kibana is available as part of the Elastic Stack under the Elastic License, which includes both open and proprietary features. The basic features are free to use, but many advanced capabilities, like machine learning, advanced alerting, security features, and specific integrations, are available only through paid tiers. Elastic also offers a managed cloud service for those who prefer not to self-host.
Grafana utilizes the Apache 2.0 license for its open-source version, granting users complete freedom to use, modify, and distribute the software. Most core features, including its visualization engine, support for multiple data sources, and built-in alerting, are available at no cost.
Grafana Labs also offers commercial options: Grafana Cloud, a fully managed service, and Grafana Enterprise, designed for on-premise deployments that need premium features, advanced scaling, and dedicated support.
Verdict: Grafana’s open-source offering is generous and widely usable without restrictions. Kibana is free for basic use, but many of its advanced features are tied to Elastic’s commercial subscriptions.
“Middleware reduced our observability costs by nearly 75%, which is massive for a company like ours”
Aaron Hawkey, Co-Founder & CTO, Generation Esports
When to Choose Grafana vs Kibana?
Use Kibana if your data is already in Elasticsearch and you’re focused on log analysis, security analytics, or application performance monitoring. It’s a solid choice for teams deeply invested in the Elastic Stack and looking for powerful search, filtering, and visualization tools tightly integrated with Elasticsearch.
Use Grafana if you need to monitor metrics from multiple systems or want a flexible dashboarding tool that works with a wide variety of data sources. Grafana is ideal for infrastructure monitoring, performance tracking, and building unified dashboards that pull data from different places.
Want one tool that combines Grafana’s flexibility with Prometheus metrics and alerting? Try Middleware no manual setups, no hidden cost.
A better alternative to Kibana vs Grafana: Middleware
While Kibana and Grafana are excellent in their respective domains, modern observability often requires a more unified and simplified approach. Middleware combines the strengths of both tools while addressing their key limitations.
Middleware offers integrated logs, metrics, and traces in a single platform, eliminating the need to manage multiple tools for different data types. It comes with out-of-the-box integrations for popular technologies, intelligent alerting with notifications, and cost-effective pricing that scales with your usage.
Middleware eliminates the need to choose between log analysis and metrics monitoring by providing both capabilities in a seamlessly integrated environment. With Middleware, teams can reduce tool sprawl, simplify their observability stack, and focus on building better software.
Experience unified observability with Middleware. Start your free trial today.
FAQs
Can Kibana and Grafana be used together?
Yes. Many teams use them side by side; Grafana for visualizing metrics from systems like Prometheus or InfluxDB, and Kibana for exploring logs stored in Elasticsearch.
Is Kibana better than Grafana for log analysis?
Yes. Kibana is tightly integrated with Elasticsearch and offers powerful tools for searching and analyzing logs. Grafana supports logs but relies on additional tools like Loki for similar functionality.
Which tool is easier to learn for beginners from Kibana vs Grafana?
Grafana is generally more manageable for beginners. Its interface is intuitive, and it supports many data sources with built-in query builders. Kibana is straightforward if you’re already familiar with Elasticsearch, but it has a steeper learning curve for new users.
Which tool is better for infrastructure monitoring?
Grafana. It’s built for time-series data and connects easily to data sources like Prometheus, InfluxDB, and cloud monitoring services, making it ideal for tracking server performance, application uptime, and system metrics.
What is the major difference between Kibana and Grafana?
Kibana is explicitly designed for data stored in Elasticsearch and excels at log analysis and search. Grafana supports a broader range of data sources and focuses on flexible, real-time dashboarding for metrics.