Longtime Kubernetes users have probably encountered many errors, some of which are unclear. Kubernetes errors can be frustrating; therefore, troubleshooting is crucial. A single misconfiguration, missing environment variables, or insufficient resources might damage the entire program, leaving the team confused.
Understanding these errors and why they occurred is more important than solving them. Errors like OOMKilled, CrashLoopBackOff, and ImagePullBackOff are usually unclear and complicated to fix. This tutorial covers these errors, their causes, and fixes.
Pod and Container Lifecycle Errors
These are the most common Kubernetes errors, as they affect the foundation of your apps. The entire app will be unavailable if your pod or container fails.
These type of errors happens because of
- Complex dependencies
- Resource constraints
- Configuration problems
- Image issues.
Normally, Kubernetes will try to restart automatically when a container fails, but when there’s a foundational problem (like a missing configuration), it creates a loop:
Container starts → Fails → Kubernetes restarts it → Fails again…
Examples of pod and container lifecycle errors include:
1. CrashLoopBackOff Error
When Kubernetes repeatedly fails to start a container, this error occurs. Most often, missing environment variables cause it, improper Dockerfile startup instructions, or dependency issues that prohibit the application from connecting to databases or services.
Your app may still get this issue if it uses the same port as another.
How to Fix CrashLoopBackOff Error in Kubernetes
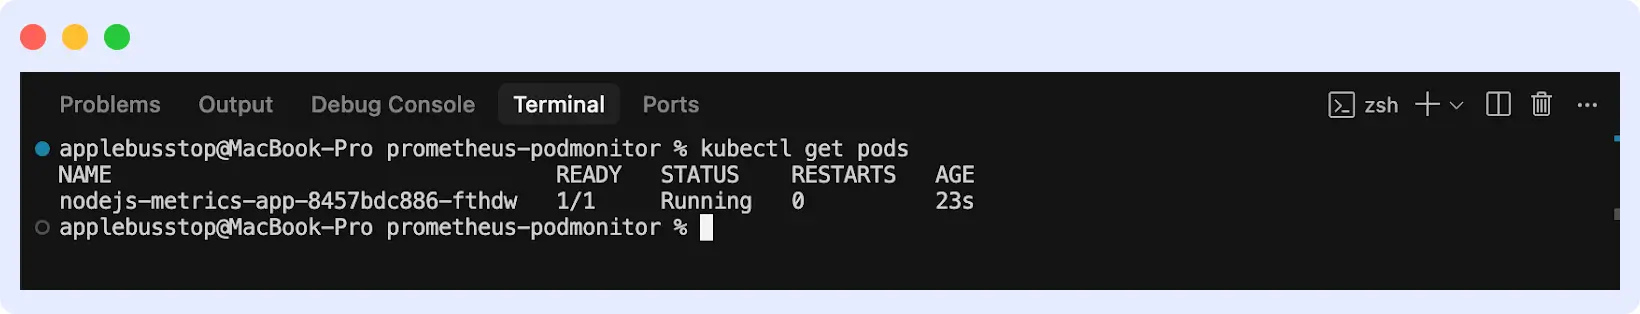
To fix this, start by identifying pods with the problem. Run “kubectl get pods” to do that. You should see the list of pods.
Look at the pod’s logs to find out what’s wrong:
kubectl logs pod-name --previousGet more information with the command:
kubectl describe pod <pod-name>If you find out the issue is a missing environment variable, update your Deployment. Run “kubectl edit deployment <deployment-name> -n <namespace>” to open the Deployment in your editor. Under the container spec, add the missing environment variables:
Check for resource-related crashes if the container needs longer startup time. Adjust liveness, readiness, or startup probes to delay health checks. This prevents Kubernetes from restarting the container too soon after initialization.
For insights into handling exit code 137 errors, refer to our detailed guide on diagnosing and fixing these issues.
2. OOMKilled (Out of Memory) Error
OOMKilled is a situation where a container was forcefully terminated because it tried to use more memory than Kubernetes allowed it to have. This happens when your app’s memory usage exceeds your pod specification or when a memory leak causes it to grow.
Setting memory limits too low can cause it. Operations like processing huge files, caching data, or managing numerous concurrent requests need a lot of memory.
How to Fix OOMKilled (Out of Memory) Error in Kubernetes
To solve this, identify the OOMKilled pod with “kubectl get pods,” then check for reasons for error:
Monitor the current memory usage of running pods:
Increase deployment limitations if your app needs additional memory (a common OOMKilled problem).
containers:
  - name: my-app
    image: my-image:latest
    resources:
      requests:
        memory: "256Mi"   # minimum guaranteed memory
      limits:
        memory: "512Mi"   # maximum memory allowed
3. ImagePullBackOff/ErrImagePull
Two similar errors occur when Kubernetes is unable to download your container image. ImagePullBackOff occurs when Kubernetes pulls again. When it fails to draw initially, you receive an ErrImagePull error.
Pulling from a private registry without authentication credentials will result in this error. Other causes include an image that may not exist in the registry, have the wrong name or tag, or lack network access.
How to Fix ImagePullBackOff / ErrImagePull Error in Kubernetes
Check for error messages in the particular pod with issues. If it’s a private registry authentication issue, create a Docker registry secret:
kubectl create secret docker-registry my-registry-secret \
  --docker-server=private-registry.com \
  --docker-username=myuser \
  --docker-password=mypassword \
  --docker-email=my@email.com
Then reference this secret in your deployment:
apiVersion: apps/v1
kind: Deployment
metadata:
  name: my-app
spec:
  template:
    spec:
      imagePullSecrets:
      - name: my-registry-secret
      containers:
      - name: my-app
        image: private-registry.com/my-app:v1.2.3
4. CreateContainerConfigError
If the setting is wrong, Kubernetes will get the image but not build the container. Container setup involves configuring environment variables, volume mounts, secrets, and config maps. Breaking any of these references causes this error.
How to Fix CreateContainerConfigError in Kubernetes
Check the pod description for error details with “kubectl describe pod <pod-name>.” Verify if referenced secrets and config maps exist:
# List secrets in the current namespace
kubectl get secrets

# List config maps
kubectl get configmaps
If the secret is missing, create it:
kubectl create secret generic my-secret \
  --from-literal=DATABASE_PASSWORD=mypassword \
  --from-literal=API_KEY=myapikey
For config map issues:
kubectl create configmap my-config \
  --from-literal=database.url=postgresql://localhost:5432/mydb #inline values
  --from-file=config.properties #from file
Then, verify your references in the deployment/pod YAML and make sure they are correct.
5. ContainerCannotRun/RunContainerError
This happens when Kubernetes creates the container but fails to run its primary process. The container exists, but cannot run the command or entrypoint. This differs from application crashes; the container runtime cannot start the process.
What can cause this error are missing shared libraries or dependencies, improper executable paths, permission issues where the executable doesn’t have execute permissions, and incorrect pod specification endpoint/command syntax.
How to Fix ContainerCannotRun / RunContainerError in Kubernetes
Start a debug shell in the same image.
Inside the container, check the executable:
ls -la /app/myapp       # Verify file exists and has permission
file /app/myapp         # Confirm binary architecture
ldd /app/myapp          # Check for missing shared libraries
If it’s a permission issue, fix it in your Dockerfile.
Resource and Scheduling Errors
Lack of resources or a suitable location for pods causes resource and schedule issues. When creating a pod, the Kubernetes scheduler looks at all cluster nodes and finds the optimal fit based on resource requirements and node limitations.
These errors are annoying because they indicate fundamental issues, not configuration.
6. Pending Pods
Your pod will be in “Pending” while Kubernetes finds a node to run it on. But it’ll stay like that if there’s no node.
Low CPU or memory resources can cause this, node selectors or affinity rules don’t match any nodes, or a PersistentVolumeClaim can’t be connected to storage. It can also occur when nodes are under heavy resource pressure, tainted without matching tolerations, or marked unschedulable.
Learn the safest and most effective methods for restarting pods to resolve scheduling issues.
How to Fix Pending Pods in Kubernetes
Check all pending pods and how long they’ve been in that state:
Get the details about why the pod can’t be scheduled:
If there are not enough resources, you can reduce requests or add more nodes to the cluster.
7. FailedScheduling
If the scheduler fails to place a pod, a FailedScheduling error will show up. Unlike the general Pending status, this error provides detailed information about why scheduling failed. This makes it easier to fix the problem.
How to Fix FailedScheduling Error in Kubernetes
Inspect the events to find the exact reason for the failure:
- If the problem is resource-related, adjust Pod requests/limits or add nodes.
- If it’s constraint-related, check affinity/anti-affinity, node selectors, and tolerations.
- For taints, make sure pods have the right tolerations:
8. Evicted Pods
The most common cause of this error is node resource pressure. That’s when a node runs low on memory, disk space, or inodes; Kubernetes evicts pods to prevent the node from becoming unstable.
Evicted pod refers to a running pod that was removed from its node by force. Kubernetes ends a pod when it is evicted, safeguarding the cluster or node.
How to Handle Evicted Pods in Kubernetes
The first thing to do when you experience this error is to filter evicted pods and check the message for the reason.
# Filter evicted pods
kubectl get pods --field-selector=status.phase=Failed

# Check the Message field for the eviction reason:
kubectl describe pod <pod-name>
If low resources caused it, you can check resource pressure:
Then monitor resource usage to identify the cause:
# Check current resource usage
kubectl top nodes
kubectl top pods --sort-by=memory
kubectl top pods --sort-by=cpu
Node-Level Errors
Node-level errors affect all worker nodes in your cluster, not just pods. Pods require healthy nodes; therefore, any node issue will certainly impair application scheduling, performance, and availability.
9. NodeNotReady
The name of this error is quite descriptive. It means a cluster worker node failed a health check or stopped responding to the control plane. Kubelet usually stops communicating with the control plane after crashing, losing network access, or a system crash.
How to Fix NodeNotReady Error in Kubernetes
Check for nodes that are not ready:
Then, if there’s any node with problems, get detailed information about it:
- Verify kubelet is running on the node.
- Check the network/DNS between the node and the control plane.
- If it’s permanently down, drain and remove the node:
kubectl drain <node-name> --ignore-daemonsets --delete-emptydir-data
kubectl delete node <node-name>
10. DiskPressure/MemoryPressure
Kubernetes sets warning states when a node is low on disk space or memory. It will limit activities to prevent system failure even if the node is still working.
How to Fix DiskPressure / MemoryPressure Issues in Kubernetes
Identify which nodes are experiencing pressure:
- Free up disk space by cleaning unused images/containers
- Scale the cluster by adding nodes
- Adjust pod resource requests/limits to avoid overcommitting
- For memory issues, optimize apps or increase node size.
11. NetworkUnavailable
NetworkUnavailable comes up when a node’s network fails and it can’t communicate with cluster nodes or services. The issue prevents pods on one node from communicating.
How to Fix NetworkUnavailable Error in Kubernetes
- You can check the CNI plugin logs, as failures in the CNI (Container Network Interface) plugin also cause this error.
- Ensure required ports are open between nodes
- Restart kubelet and networking pods
- If only one node is affected, check its network interface
- Reapply or reinstall the CNI plugin if it’s misconfigured.
Learn more about Kubernetes logging best practices to enhance your troubleshooting workflow.
How Middleware Helps in Fixing Kubernetes Errors
Kubernetes errors are often difficult to diagnose due to their distribution across pods, nodes, and storage. Root causes are usually found by manually running kubectl commands and checking logs. However, Middleware makes troubleshooting easier and faster for you.
Here’s the troubleshooting flow with Middleware:
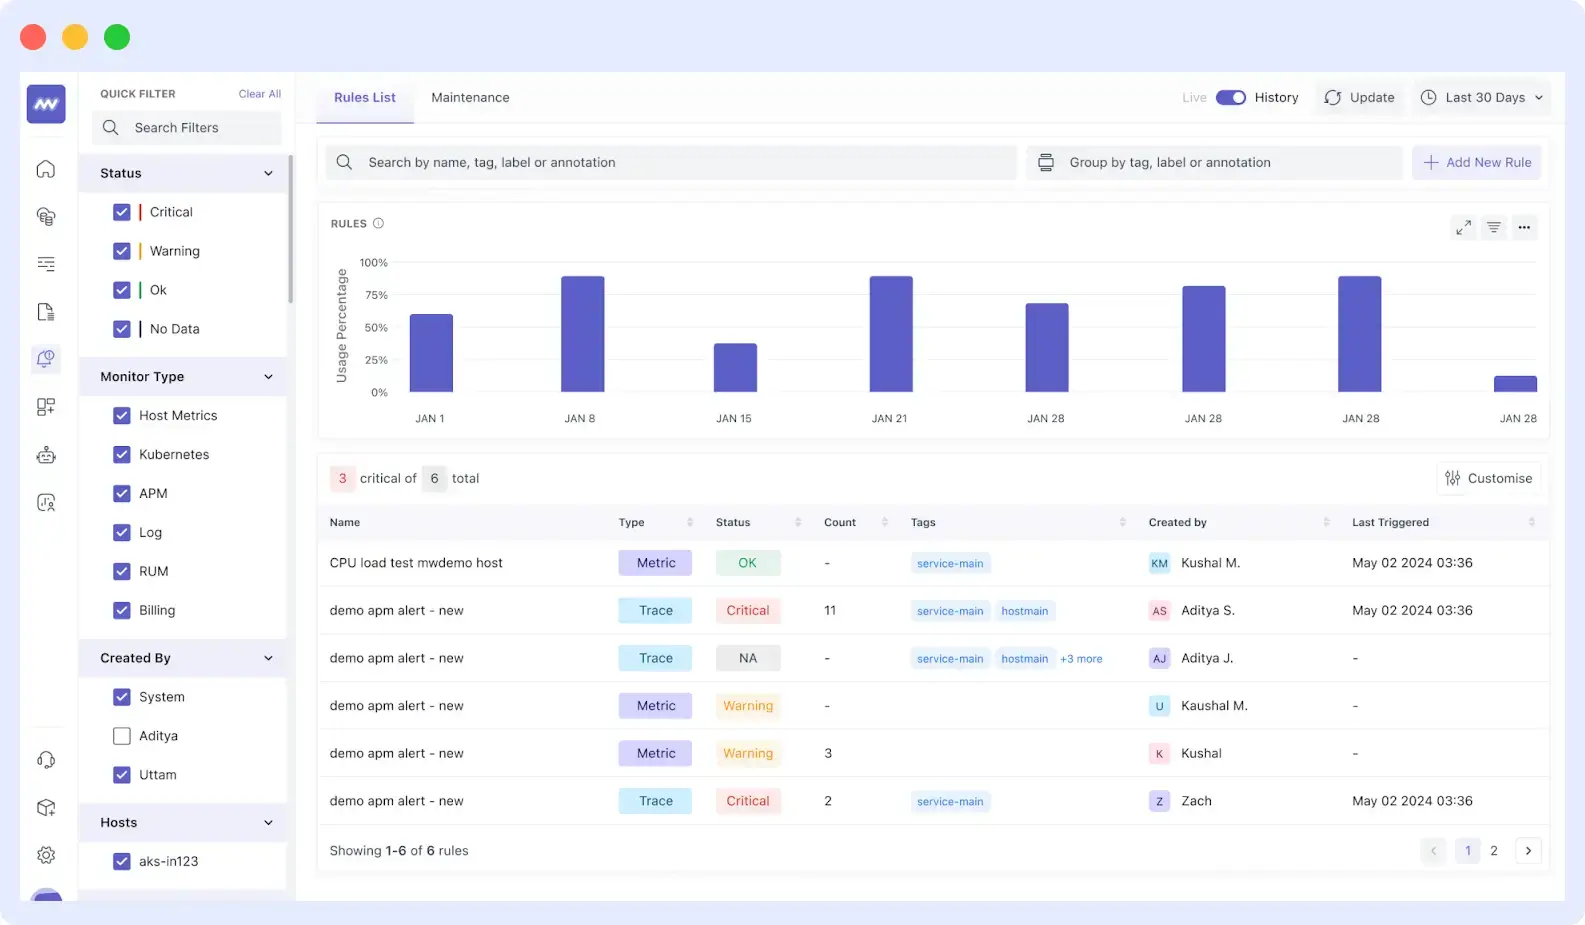
1. Get Notified of the Issue
Middleware will alert you when errors occur, such as high resource usage and pod crashes, after it has been installed in Kubernetes. You can take prompt action and address issues before they worsen.
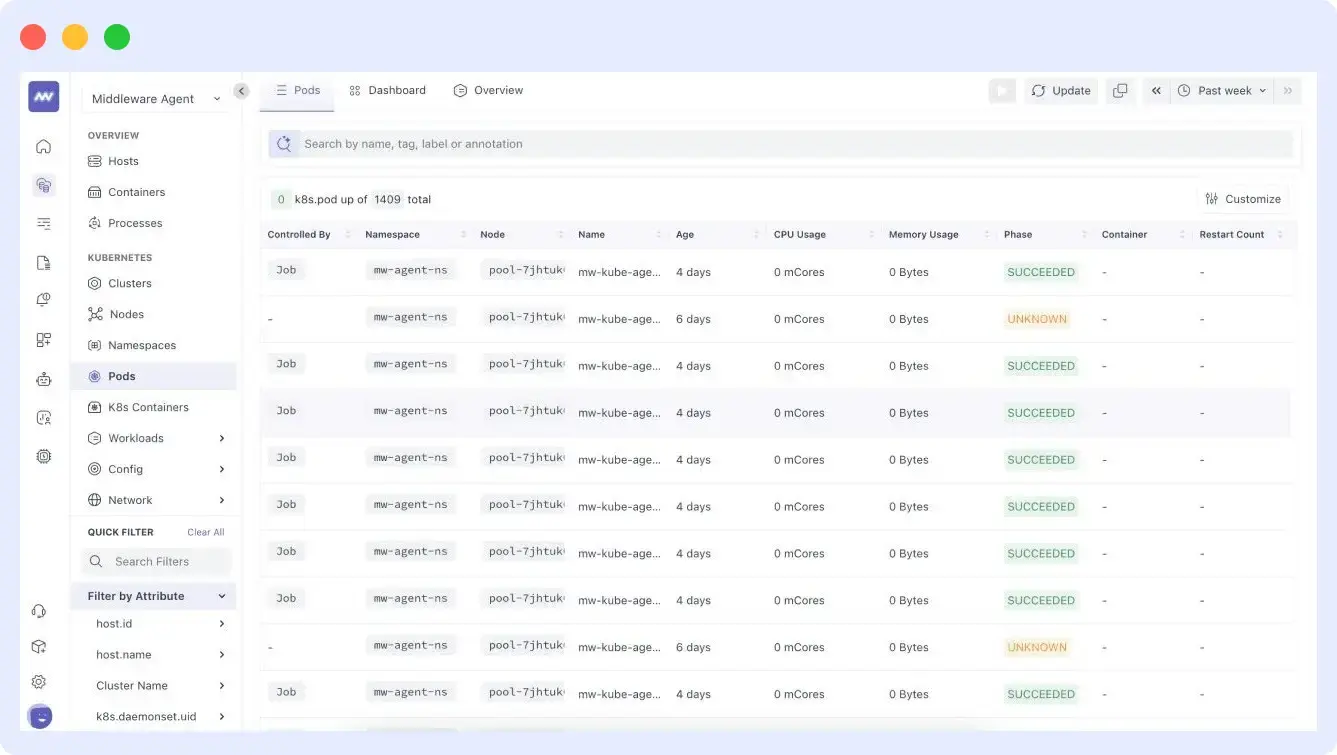
2. Check Pods and Events
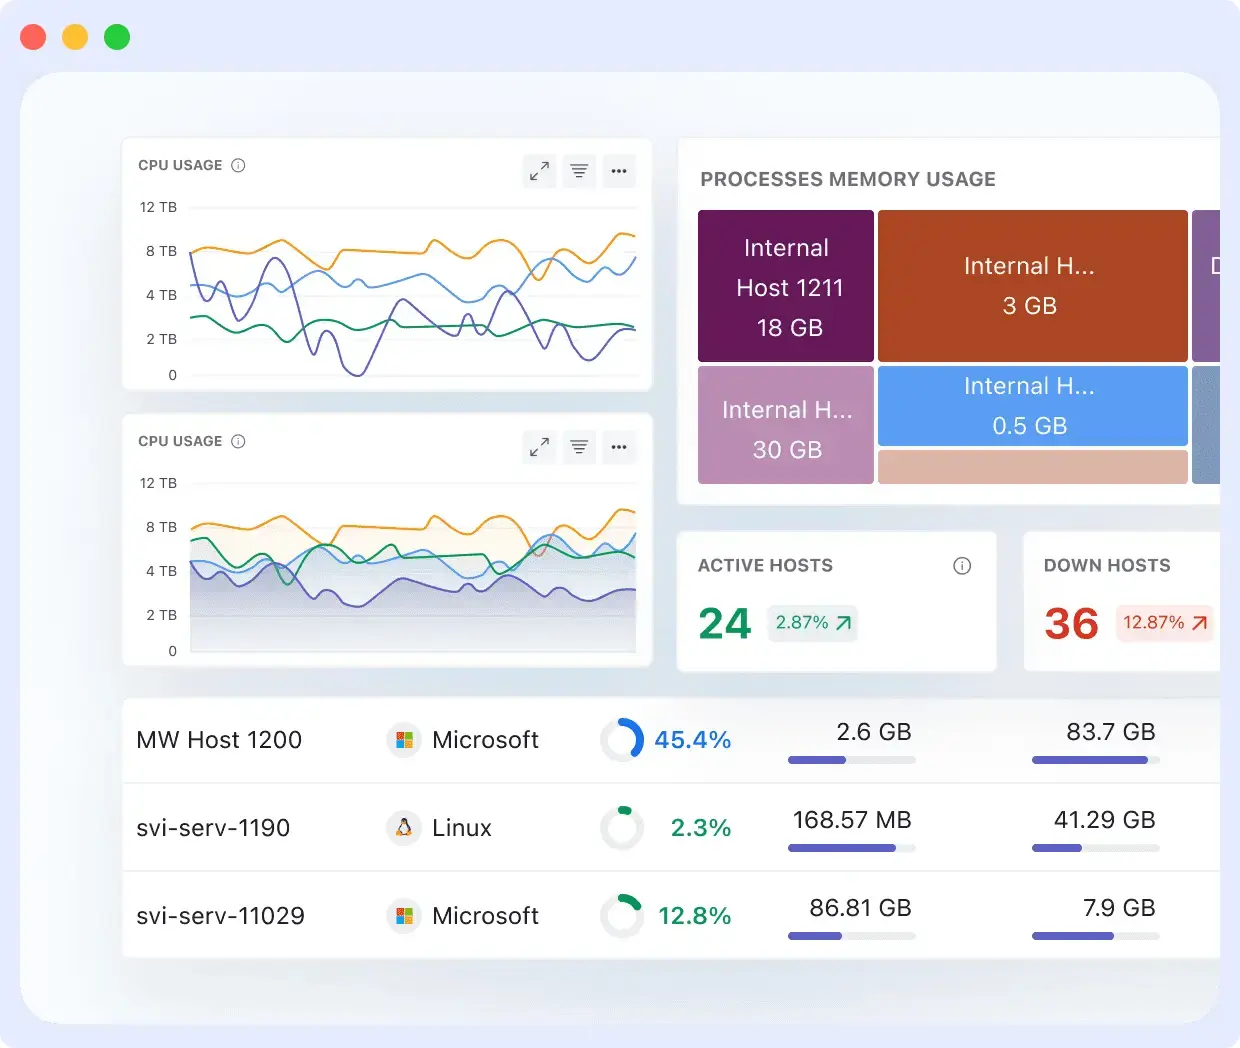
All the metrics from pods, nodes, and clusters are captured in one place. Instead of switching between commands with kubectl, Middleware shows resource usage trends directly on dashboards.
With Middleware, you don’t have to check pod logs manually. It aggregates and indexes them, making it easy to search for the exact error or event across all pods.
3. Review Resource Usage
If your pod was OOMKilled, Middleware will show you the CPU, memory, and network usage, which will tell you why the error occurred. With that, you can optimize usage so that your app runs smoothly.
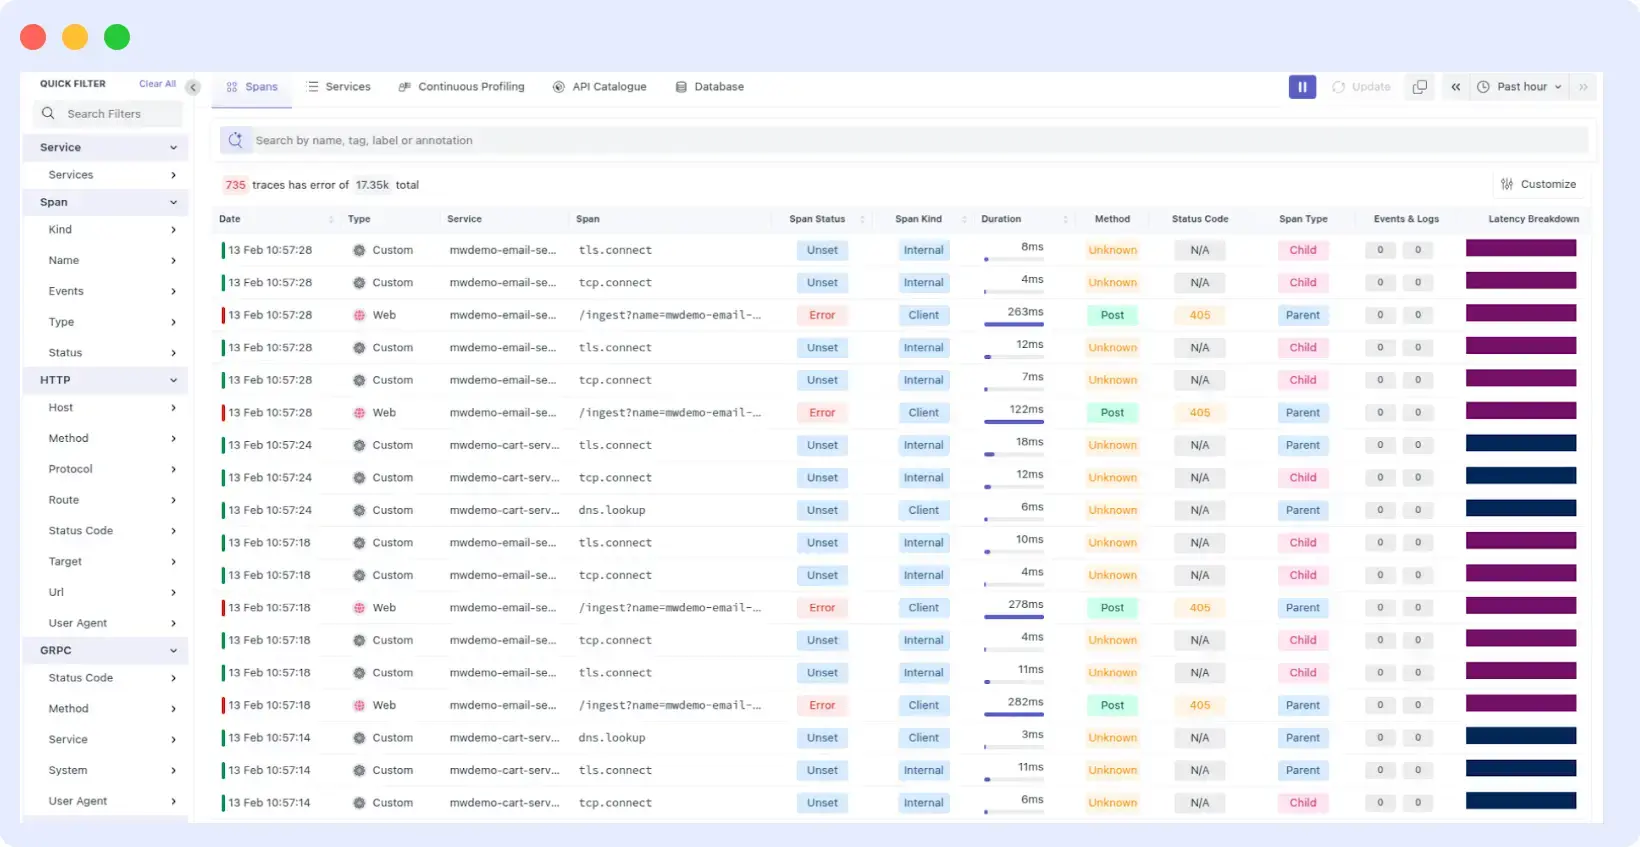
4. Trace the Impact of Issues
With Middleware’s APM and RUM, you can quickly see how the error impacts your system. You’ll know whether a failed pod hampered transactions, requests, or end-user performance. Because of this, determining whether the problem is isolated or a result of a service outage is made simple.
5. Confirm the Fix
After making all the suggested changes, your Middleware dashboard will automatically update to show you if the app performance has returned to normal or if there’s anything else left to look out for.
Conclusion
When you use Kubernetes, these errors will appear. It’s critical to understand their meaning, causes, and preventative measures. Kubectl can manage all of them, although it’s challenging in large clusters.
So you need Middleware. It provides a single platform for Kubernetes-wide monitoring, log analysis, and error tracking across the entire Kubernetes cluster. Middleware helps you find and fix issues faster and maintain app performance.
FAQs
Which Kubernetes error is most common?
Pod-related issues like CrashLoopBackOff, ImagePullBackOff, and Pending are most common.
How can I diagnose and fix pending pods?
Use “kubectl describe pod <pod-name>” to see the cause of the pod not scheduling. If resource issues are the main cause, free resources or resize nodes.
How can I fix Kubernetes ImagePullBackOff errors?
Verify the image name/tag, public repo or private registry secret, and network access to the registry.
How can I fix OOMKilled pod errors?
Increase memory limit, optimize the app to use less memory, or expand horizontally by running additional replicas.


