Kubernetes has become the must-have for large-scale deployment and management of containerized applications. But as the number of containers and nodes increases, monitoring Kubernetes and troubleshooting the applications sectioned into Kubernetes clusters becomes challenging.
Kubernetes logging solves this challenge by providing insights into the behavior and health of the entire architecture. However, it presents unique challenges: managing log volumes, configuring log collection, and securing log data are taxing.
This guide is a complete overview of Kubernetes logging, including the various sources of logs, popular logging solutions, and best practices for log management.
What is Kubernetes logging?
Kubernetes logging is the process of collecting, storing, and analyzing logs generated by the applications and Kubernetes components running in a cluster. It eases troubleshooting and monitoring of applications.
You can generate logs from many sources, including container logs, application logs, Kubernetes components logs, and host logs. Generated logs are aggregated using logging solutions that ease the search, filter, and analysis of logs.
Why is Kubernetes logging important?
Every deployed container generates unique log types and must be monitored. And since Kubernetes is mostly used for large systems, the multiplicity of clusters, nodes, and containers stifles end-to-end visibility of the architecture.
Additionally, when an application hosted in virtual machines dies, its logs remain accessible until they are deleted. In Kubernetes, their logs disappear when pods die, making it hard to investigate the root cause of problems. Kubernetes logging helps preserve crucial information like this in safe, secure databases.
What should you log in Kubernetes?
Logging the correct data is as important as understanding the importance of logging. When you log and process the appropriate logs, you can target components that matter and obtain a root cause analysis of issues.
Below are four crucial logs you should collect:
1. Cluster logs
These logs provide an overview of cluster performance. They are system-level logs from Kubernetes components like the API server, scheduler, controller manager, and logs from the etcd datastore.
2. Node logs
Node logs provide insights into the cluster’s health of individual worker nodes. They may also include logs from Kubernetes components like kubelet and kube-proxy.
3. Container logs
These logs provide insights into the behavior of individual application containers running within the cluster. They include application-level logs, such as log messages generated by an Apache web server or a Python application.
4. Kubernetes Events
These logs capture a historical record of significant changes and events that occur within the cluster—like new deployments or pods scheduled for termination.
They are especially useful during auditing. They record system-level events such as Kubernetes API calls, container lifecycle, and many others.
How to collect and process Kubernetes logs
There are three primary ways to collect and process Kubernetes logs:
i.) Using Logging Agents
Logging agents are software components that collect, aggregate, and forward log data to a central location for analysis and monitoring. You can integrate the logging agents into your Kubernetes architecture using DaemonSets, which runs a copy of the logging agent on each node in the cluster.
Several logging agents are available for Kubernetes, each with a unique set of features and capabilities.
Three of the best are Middleware, Fluentd, and Logstash.
- Fluentd is a logging agent that supports over 300 data input and output plugins. This makes it easy to integrate with various data sources and storage systems.
- Logstash is another popular logging agent with similar capabilities to Fluentd. It can collect log data from Kubernetes nodes, containers, and applications and forward it to various destinations.
- Middleware is a logging agent that helps you to collect logs across multiple sources such as your server, clusters, containers, cloud environment, and application.
Middleware unifies the logging of the Kubernetes infrastructure and applications into a single dashboard.
To use Middleware for Kubernetes logging, you must first install the agent. Follow these steps:
1. Create a free account, and log in.
2. Install the agent on Kubernetes by copying the Installation command and pasting it into the command prompt. Here is an example command that includes your API key:
MW_API_KEY=xxxxxxxxxxxxxxxxxx TARGET=https://uid.middleware.io:443 bash -c "$(curl -L https://install.middleware.io/scripts/yaml-install.sh)"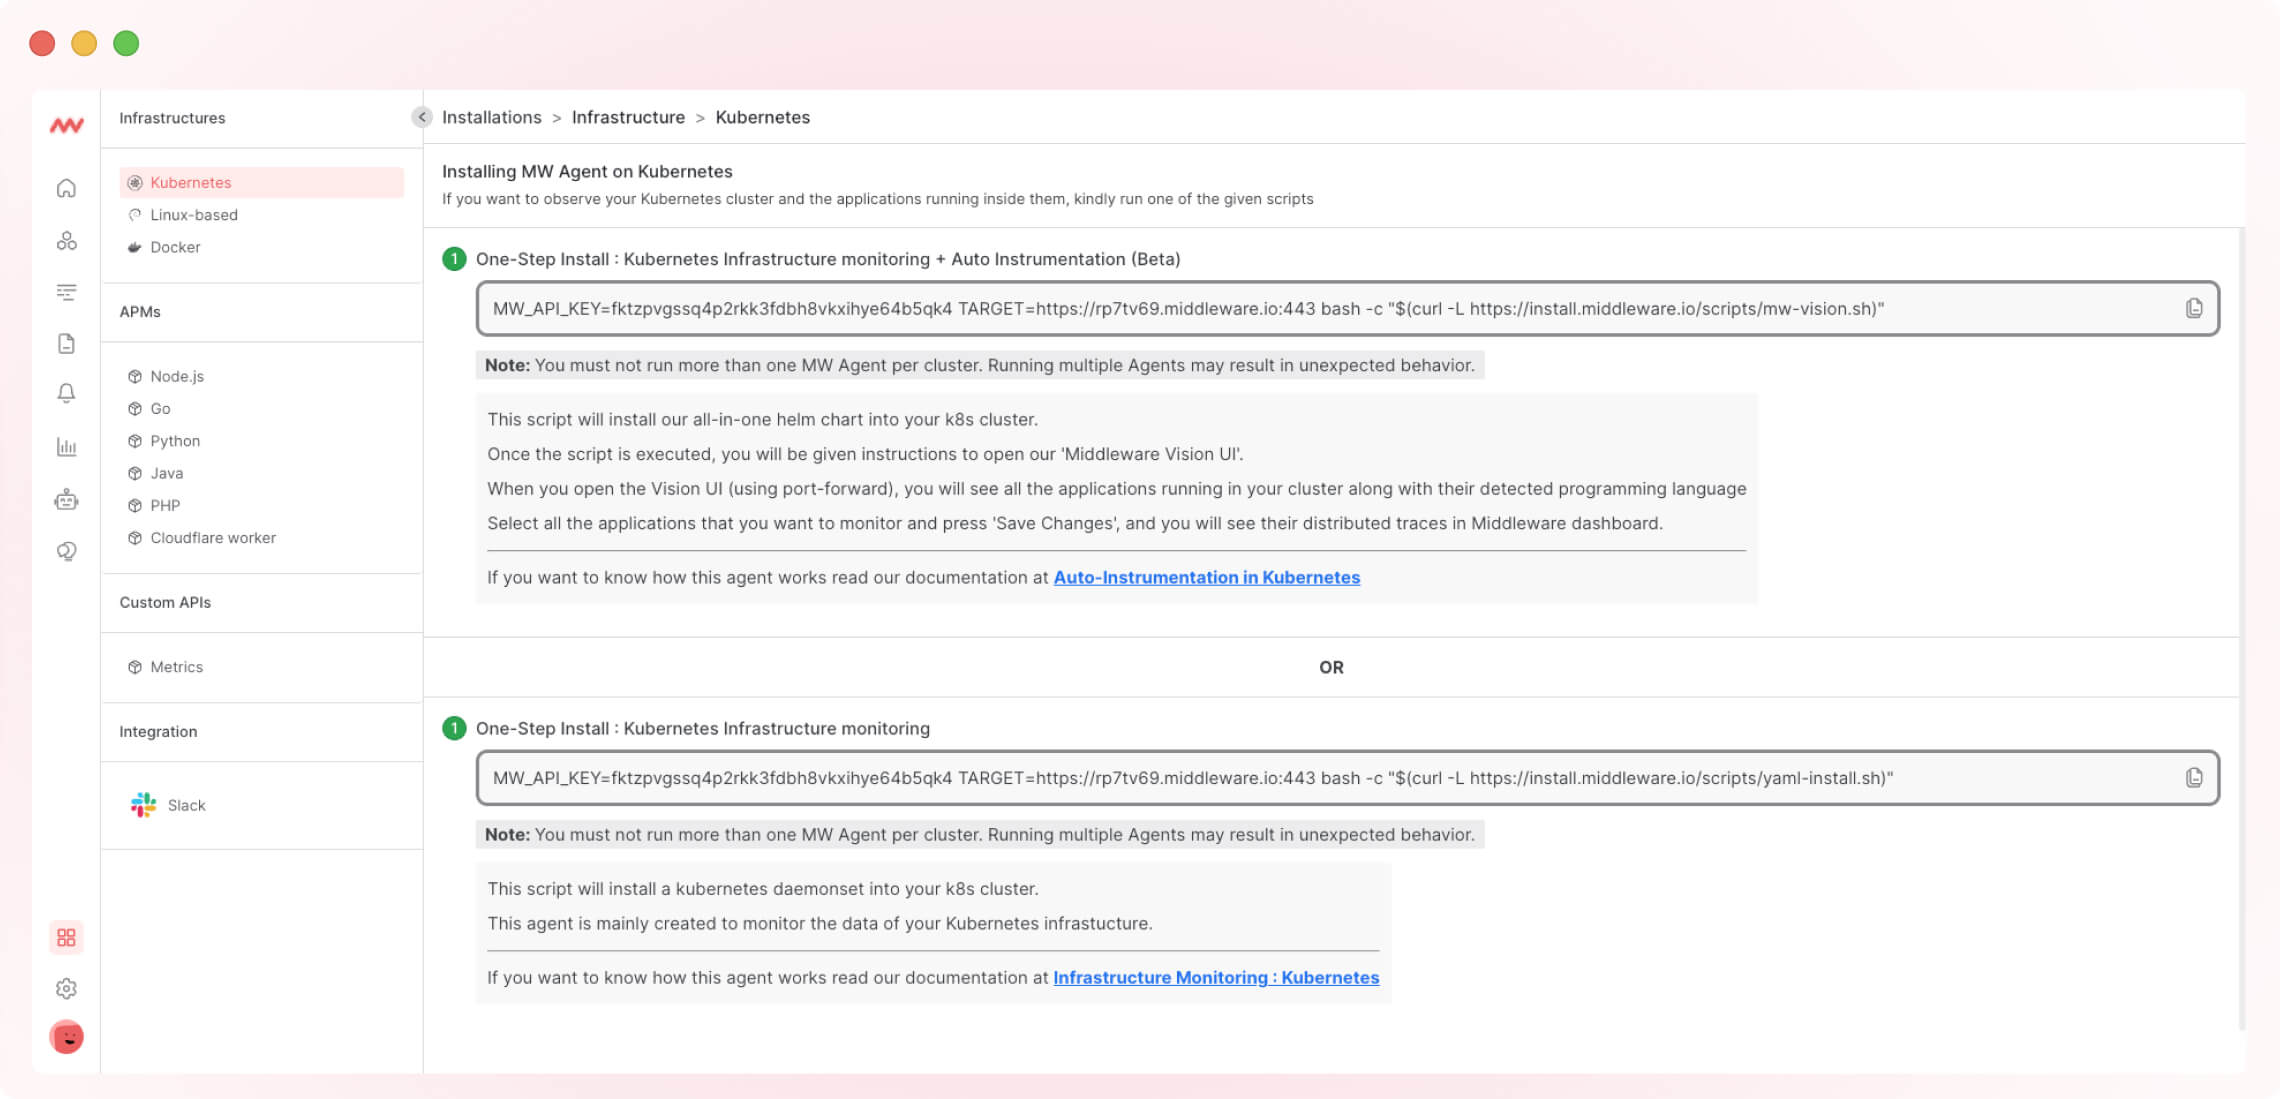
Replace MW_API_KEY value with your API Key, “uid” with the text in the URL (ex URL is “s05zpimz.middleware.io”, here s05zpimz is uid.)
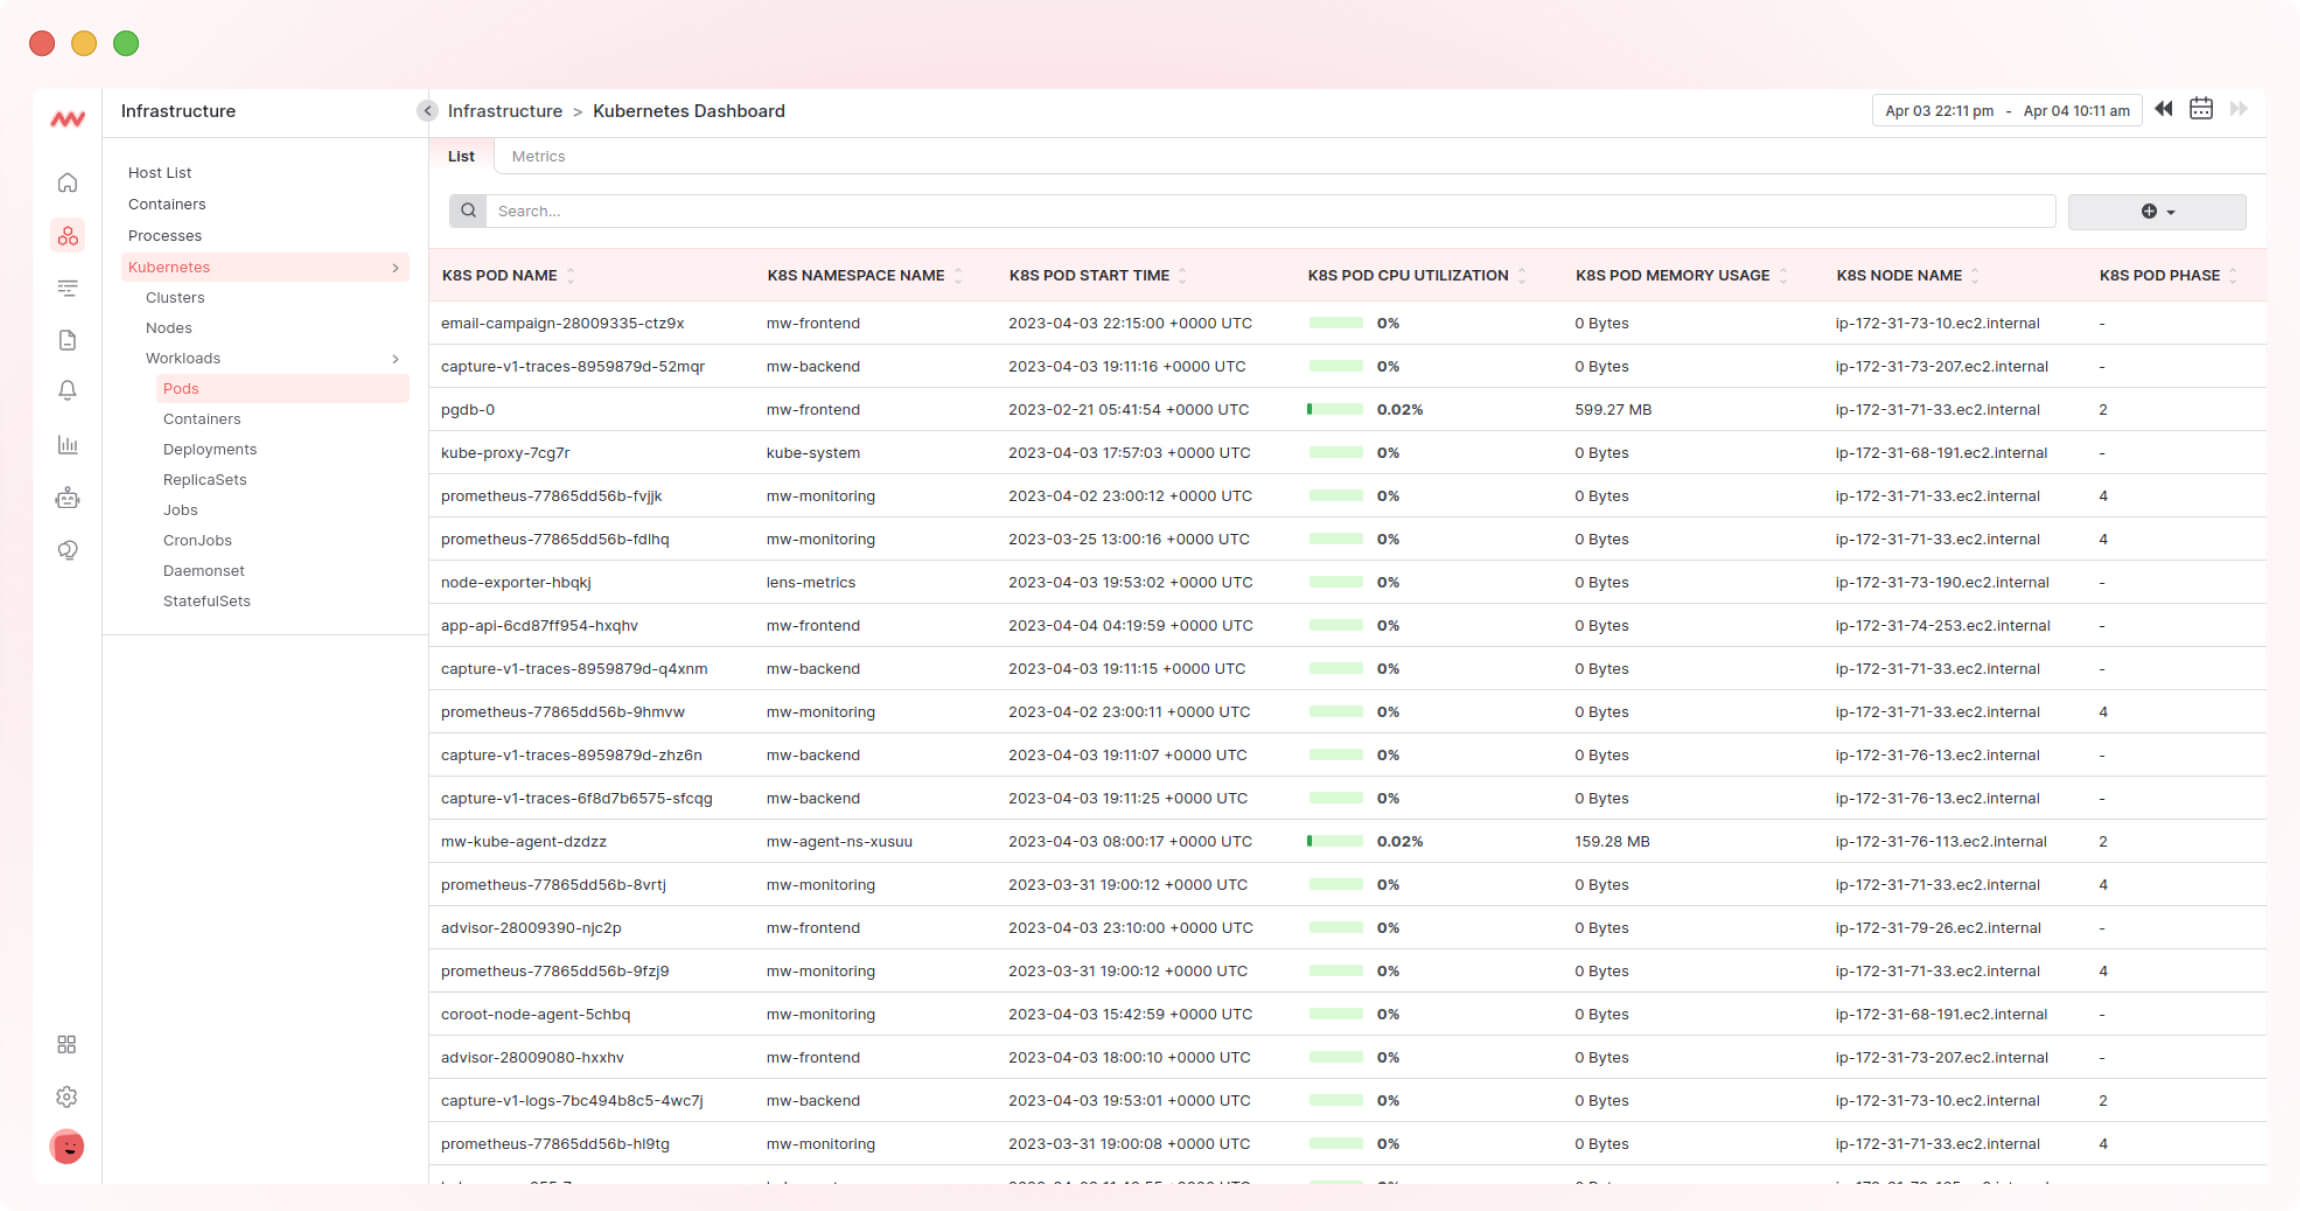
3. Run the agent’s status command below to verify the installation:
kubectl get pods -n mw-agent-nsA successful installation will create a pod in your infrastructure under the “mw-agent-ns” namespace, and you can make one entry with the current status (ex “running”)

An unsuccessful installation will display a “no resource found” message when you run the above command:

4. In case of unsuccessful installation, you can uninstall the agent and install it again. To uninstall, use the following command:
bash -c "$(curl -L https://install.middleware.io/scripts/yaml-uninstall.sh)"5. Upon a successful installation, you can log in to your account to access your logs in the log section of your unified dashboard.
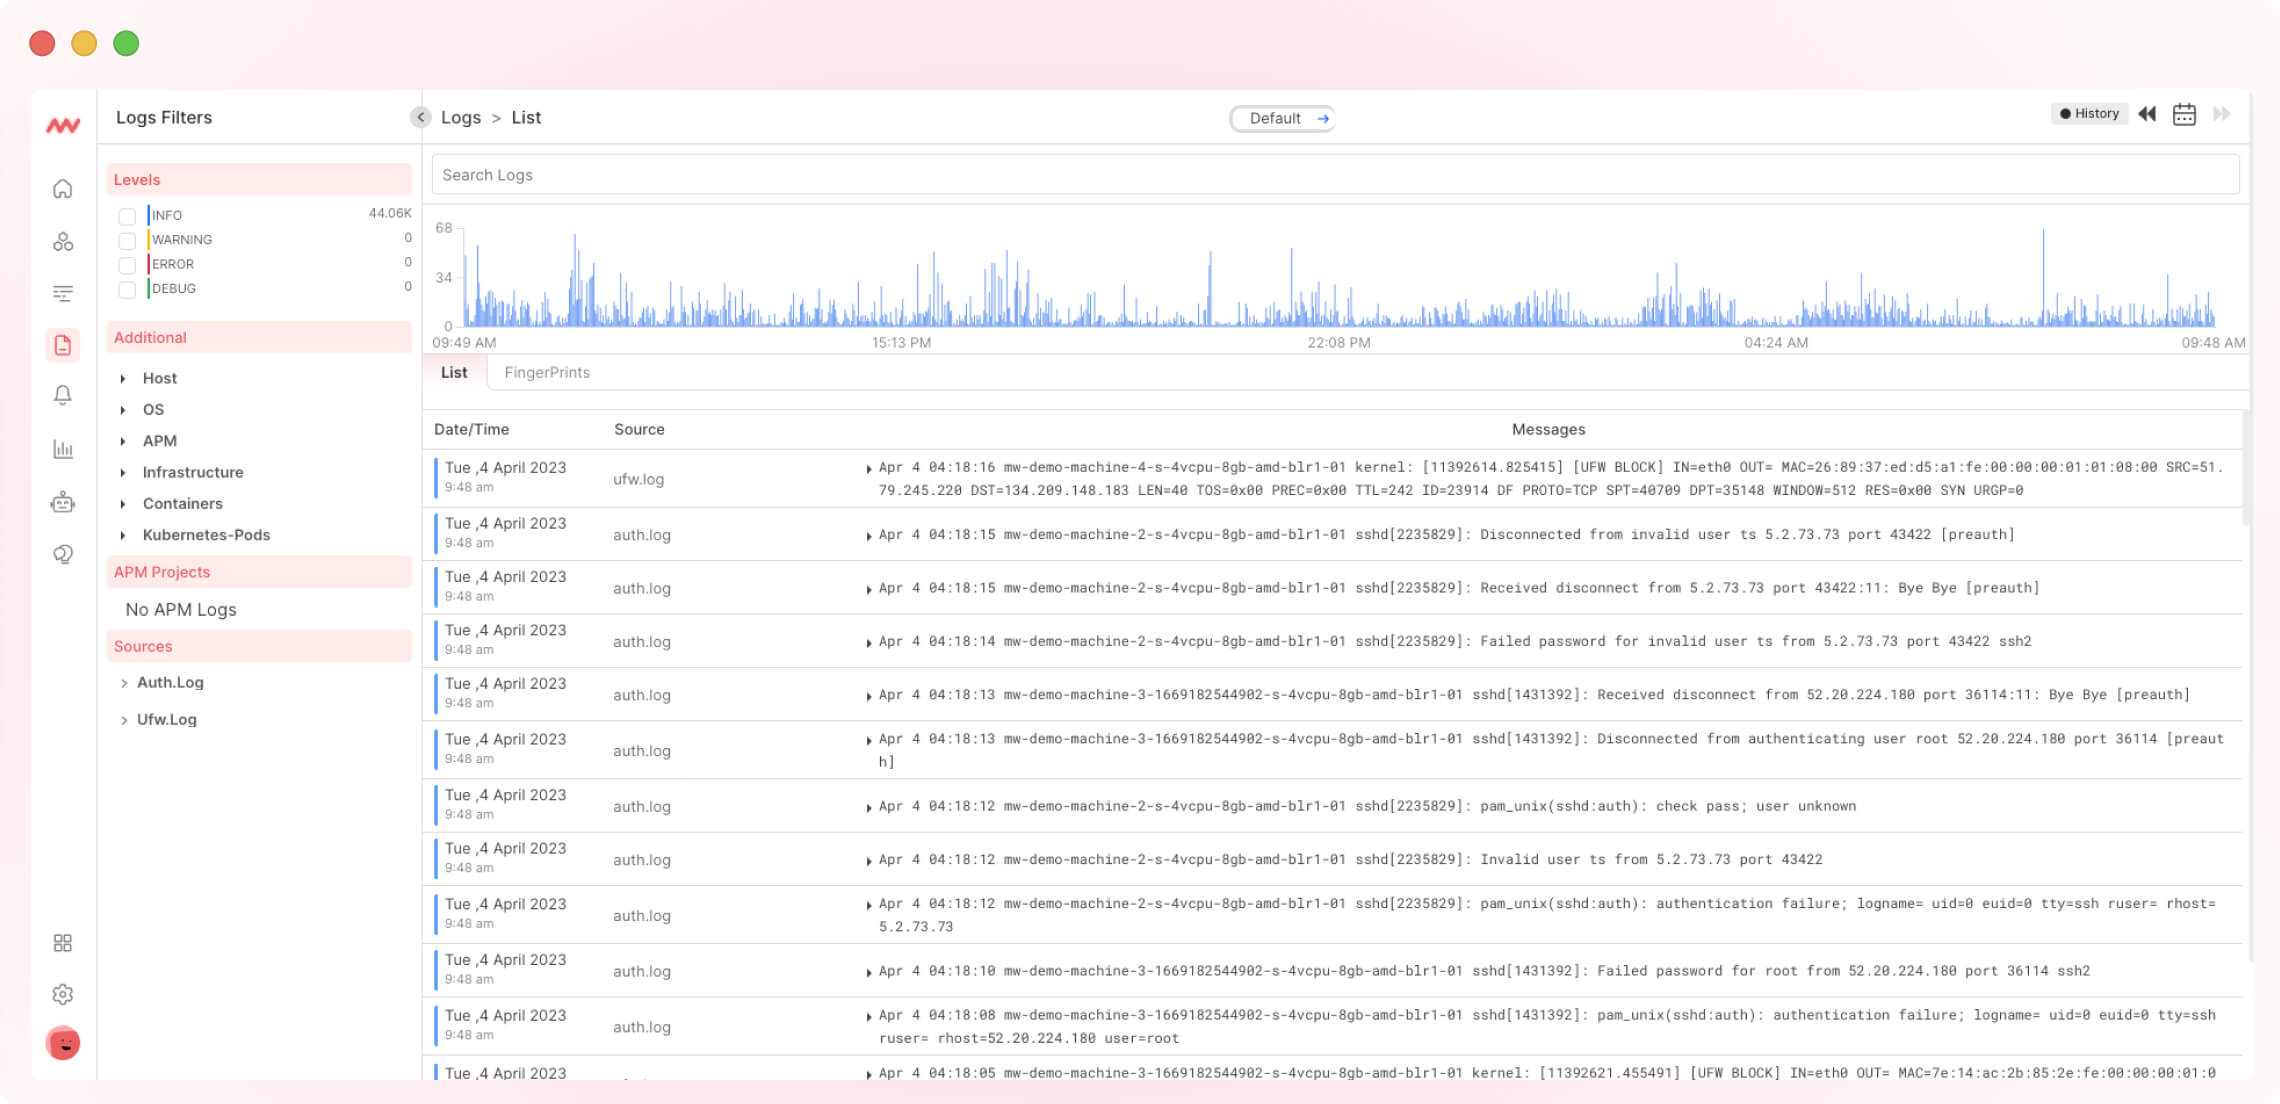
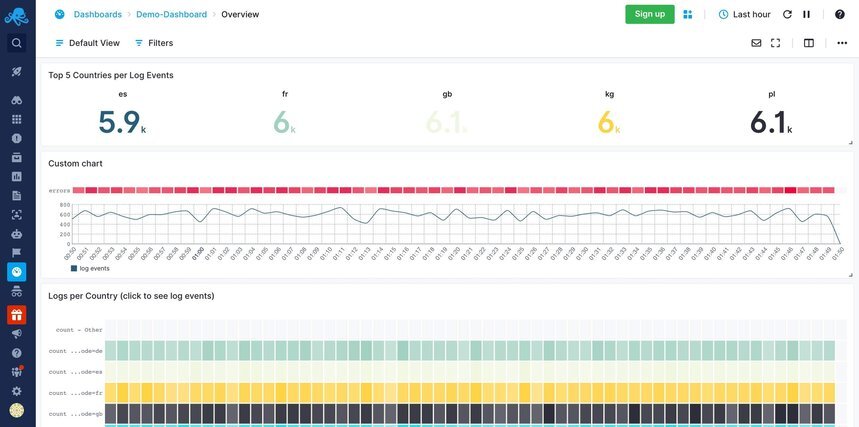
6. You can search logs by service name, filter logs for different time ranges, see the number of logs for different time ranges in chart format, and search logs by typing the error name or service name in the search bar.
You can filter logs by application and message, check the severity of logs—info, error, and warning, and even use Middleware’s one-click filter feature to add any log parameter to filter logs directly by clicking on that value in the log listing.
ii.) Basic logging using Stdout and Stderr
Logging in Kubernetes using stdout and stderr is otherwise called cluster configuration. In this approach, you must write the application logs to the standard output (stdout) and standard error (stderr) streams.
Kubernetes automatically aggregates the logs into a single log file and redirects them to any externally configured logging solution, such as a third-party tool or a k-native solution.
Pros
- Simplicity: It is easy to set up and requires no additional configuration. Most Kubernetes applications already log to stdout and stderr by default, so capturing is only essential.
- Flexibility: Kubernetes can forward the logs to any logging solution that can consume them, enabling you to use your preferred tool or service.
- Standardization: Many logging solutions understand the stdout/stderr format since it’s a widely supported logging mechanism.
Cons
- Limited functionality: Since this approach only captures logs written to stdout and stderr, it may not include all the logs you need—you can not capture logs written to files or other streams.
- Limited context: By default, Kubernetes doesn’t capture any metadata about the logs, such as the container ID or pod name. This can make it harder to trace logs back to their source.
- Noisy logs: If an application writes a lot of logs to stdout and stderr, it can make it harder to find the relevant logs when debugging.
These challenges often lead teams to reconsider their orchestration choice, here’s a clear comparison of Kubernetes vs Docker Swarm to help you decide.
iii.) Using application-level logging configuration
Application-level logging configuration is the process of configuring logging at the application level rather than the platform level. It enables you to log the applications independent of the cluster’s configuration.
You can use tools such as Middleware, Fluentd, or Sematext to implement this approach. These tools read logs from the Kubernetes API server, container logs, or other sources. While they handle logs efficiently, combining them with monitoring of K8s metrics provides a complete view of your cluster’s health and performance.
You can then define rules for filtering and processing logs, such as grouping logs by namespace or pod name, adding metadata to logs, or forwarding logs to a centralized logging system.
Pros
- Flexibility: Application-level logging configuration provides more flexibility for developers to customize logging according to their application needs. Developers can choose to log different types of events and errors and configure the log format and destination.
- Granularity: Since you can log only the relevant events and errors to your application, the method provides more granularity.
Cons
- Complexity: Logging in Kubernetes at the application level logging configuration can add complexity to an application, especially if the application is running on a large scale or across multiple nodes.
- Inconsistency: If multiple applications are running in the same Kubernetes cluster and have different logging configurations, it can lead to inconsistencies in log format and destination.
- Scalability: As the application scales, the amount of logging generated also increases. This can lead to performance issues and storage limitations
Bonus: Useful kubectl logs commands
kubectl logs is a kubectl command that is used to view the logs of a container within a pod running on a Kubernetes cluster. The syntax for the kubectl logs command is as follows:
kubectl logs <pod-name> [-c <container-name>] [-f] [--tail=<num-lines>]<pod-name> is the name of the pod whose logs you want to view, -c <container-name> is optional and only necessary if the pod is docked in more than one container.
-f enables you to continuously stream the logs in real-time. –tail=<num-lines> Shows the last <num-lines> lines of the logs.
Here are some examples of how to use the kubectl logs command:
View the logs of a pod that has only one container:
kubectl logs <pod-name>To view the logs of a pod that has multiple containers:
kubectl logs <pod-name> -c <container-name>In order to continuously stream the logs of a pod:
kubectl logs <pod-name> -fTo view the last 50 lines of the logs of a pod:
kubectl logs <pod-name> --tail=50Kubernetes logging best practices
Follow these best practices for optimum Kubernetes logging:
1. Use a centralized logging system
This system is the central, independent, isolated location where logs are stored. This makes your logs available for future use, especially for troubleshooting and debugging your application in Kubernetes.
It’s best to log both application and system-level events to get comprehensive logs from the Kubernetes platform. This gives insight into the clusters, nodes, and applications.
2. Establish a retention policy
A retention policy presupposes that you create a backup database for your logs. This enables access to your logs at any time and place. Using a log rotation is another strategy that goes well with the retention policy.
It prevents you from running out of disk space. Log rotation ensures that old and needless logs are deleted or compressed, creating new logs.
3. Create separate clusters for development and production
This helps you avoid the accidental deletion of production-critical pods when clearing development clusters.
4. Control access to log with RBAC
Implementing the Role-based Access Control to validate access and permission in the Kubernetes ecosystem enhances security. It prevents unauthorized access to the logs.
5. Use structured logging
Structured logging formats log messages in a standardized format. This makes it easier to search, filter, and analyze logs. It can also help you identify issues quickly and make informed decisions.
6. Monitor your logs
Log monitoring is essential for detecting and proactively resolving issues. Set up alerts and notifications for specific events, such as error rates exceeding a certain threshold or certain log messages appearing frequently.
Some of the best Kubernetes logging tools
Three of the best Kubernetes logging tools are:
1. Middleware
Middleware is a high-impact logging tool that collects log data across applications, cloud services, and on-premises. It helps developers monitor, analyze and troubleshoot performance and security issues before they impact users.
2. Sematext
Sematext is a fully managed ELK solution. It is compatible with a large number of log shippers, logging libraries, and platforms. It enables developers to aggregate and analyze log data from any layer within Kubernetes.
3. Fluentd
Fluentd is an open-source, Kubernetes-native tool and logs aggregator. It allows you to collect logs from your Kubernetes cluster, parse them from various formats like MySQL, Apache2, and many more, and ship them to the desired location.
Conclusion
Kubernetes logging allows for identifying and resolving issues within the Kubernetes platform. Several logging mechanisms are available, each with its benefits and use cases.
However, the most effective logging method is through logging agents and third-party tools. These provide different levels of visibility and granularity without any limitations.
The Middleware logging tool provides real-time logging, detailed information about resources, and end-to-end visibility into the Kubernetes clusters and dependencies. This leads to more efficient debugging and troubleshooting, improved resource utilization, and better overall application management. Start logging K8s for free with Middleware!