Summary: The best log aggregation tools in 2026 are Middleware, SigNoz, and Grafana Loki for most teams, depending on whether you prioritize OpenTelemetry support, cost control, or Kubernetes compatibility. Read on for a full comparison by strength, pricing, and deployment model.
A log aggregation tool collects logs from servers, containers, applications, and cloud services and centralizes them in one place for search, analysis, and alerting.
Without it, your logs live in dozens of separate places, each service, pod, or VM writing to its own file. Log aggregation solves that by shipping everything to a single backend where you can search, filter, and alert across all sources at once.
This article compares 10 log aggregation tools across deployment models, pricing, OpenTelemetry support, and the strengths that shape log workflows.
TL;DR
- For OpenTelemetry-native log aggregation with predictable per-GB pricing, Middleware and SigNoz are the cleanest fits. Both avoid per-host and per-user fees.
- Tools without OTel support lock you into their proprietary agents. Switching later means rebuilding exporters across every service.
- If you need fast full-text search across every log field, ELK Stack and Splunk are the strongest options. Both come with operational and cost overhead.
- If you run Kubernetes and need to control storage costs, Grafana Loki and OpenObservability store logs cost-effectively in object storage. Both trade off full-text search depth for lower cost.
- If your priority is security analytics and compliance reporting, Splunk and Sumo Logic are built for that workload.
1. Middleware
(Best for OpenTelemetry-native log aggregation with predictable pricing)
Middleware is a cloud-native observability platform built on OpenTelemetry from the ground up. Its agent runs on the OpenTelemetry Collector, so teams already using OTel SDKs can point their existing exporters at Middleware with no re-instrumentation.
What makes it stand out:
- Middleware’s strength as a log aggregation tool is its AI-native observability pipeline, where OpsAI can correlate logs with traces, Kubernetes events, alerts, and code-level context to move beyond simple log storage into automated RCA, anomaly detection, and remediation workflows.
- Middleware’s ingestion pipeline runs at the agent layer before data reaches storage. Teams can parse logs, apply regex extraction, mask sensitive fields, and drop noisy logs at the edge. Logs dropped through the pipeline are not billed, making costs predictable in Kubernetes environments where pod churn creates high log volume.
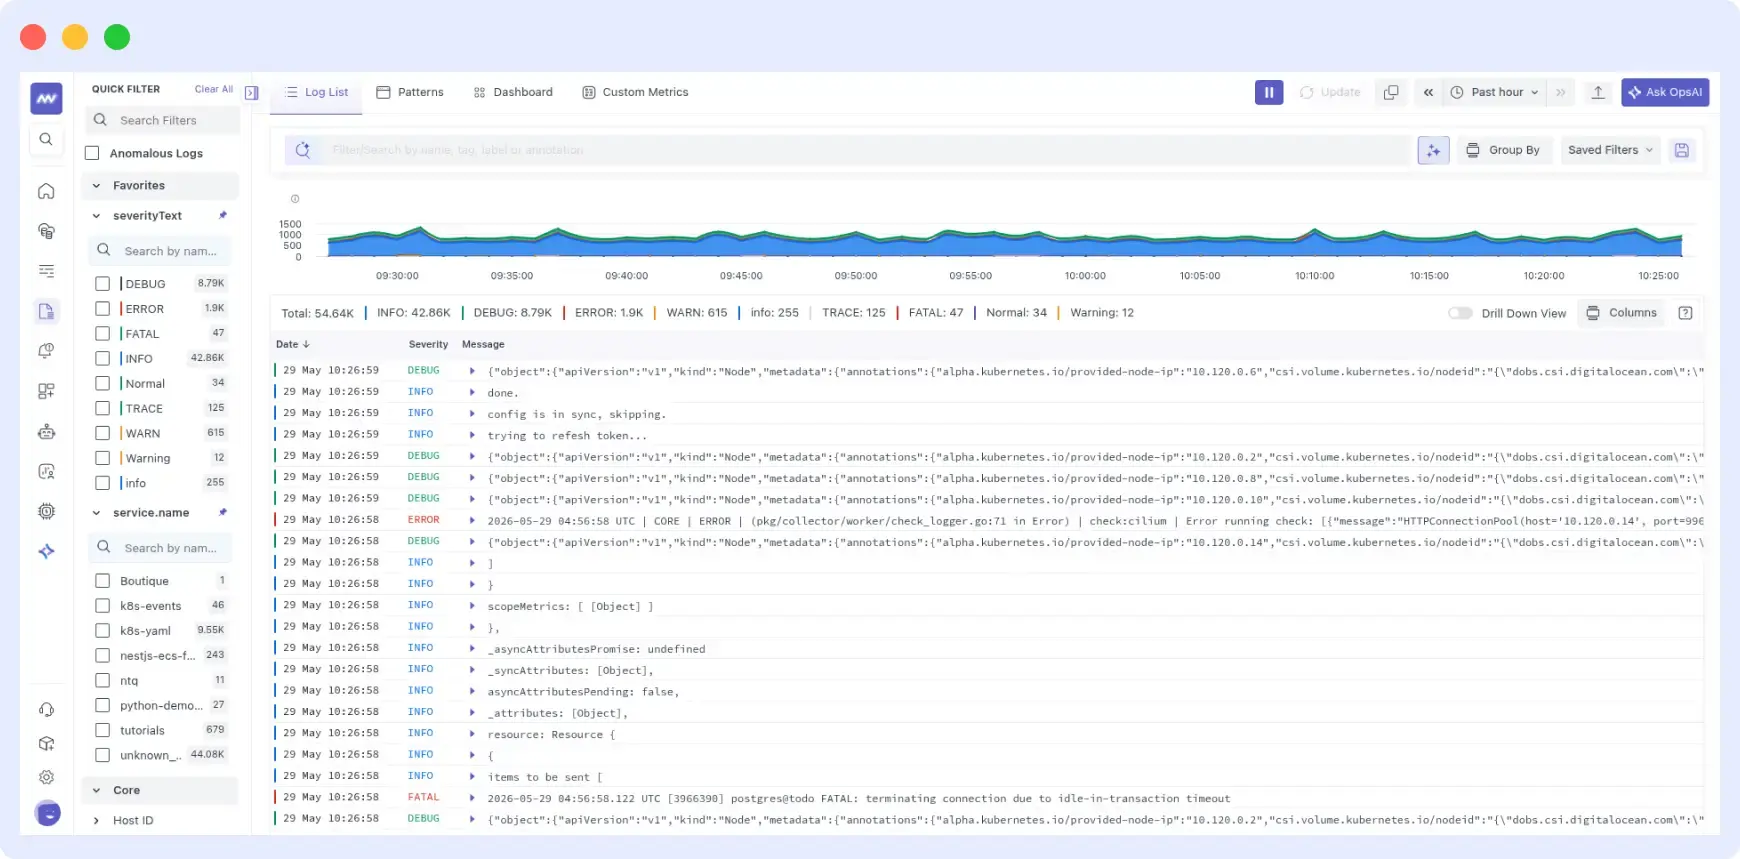
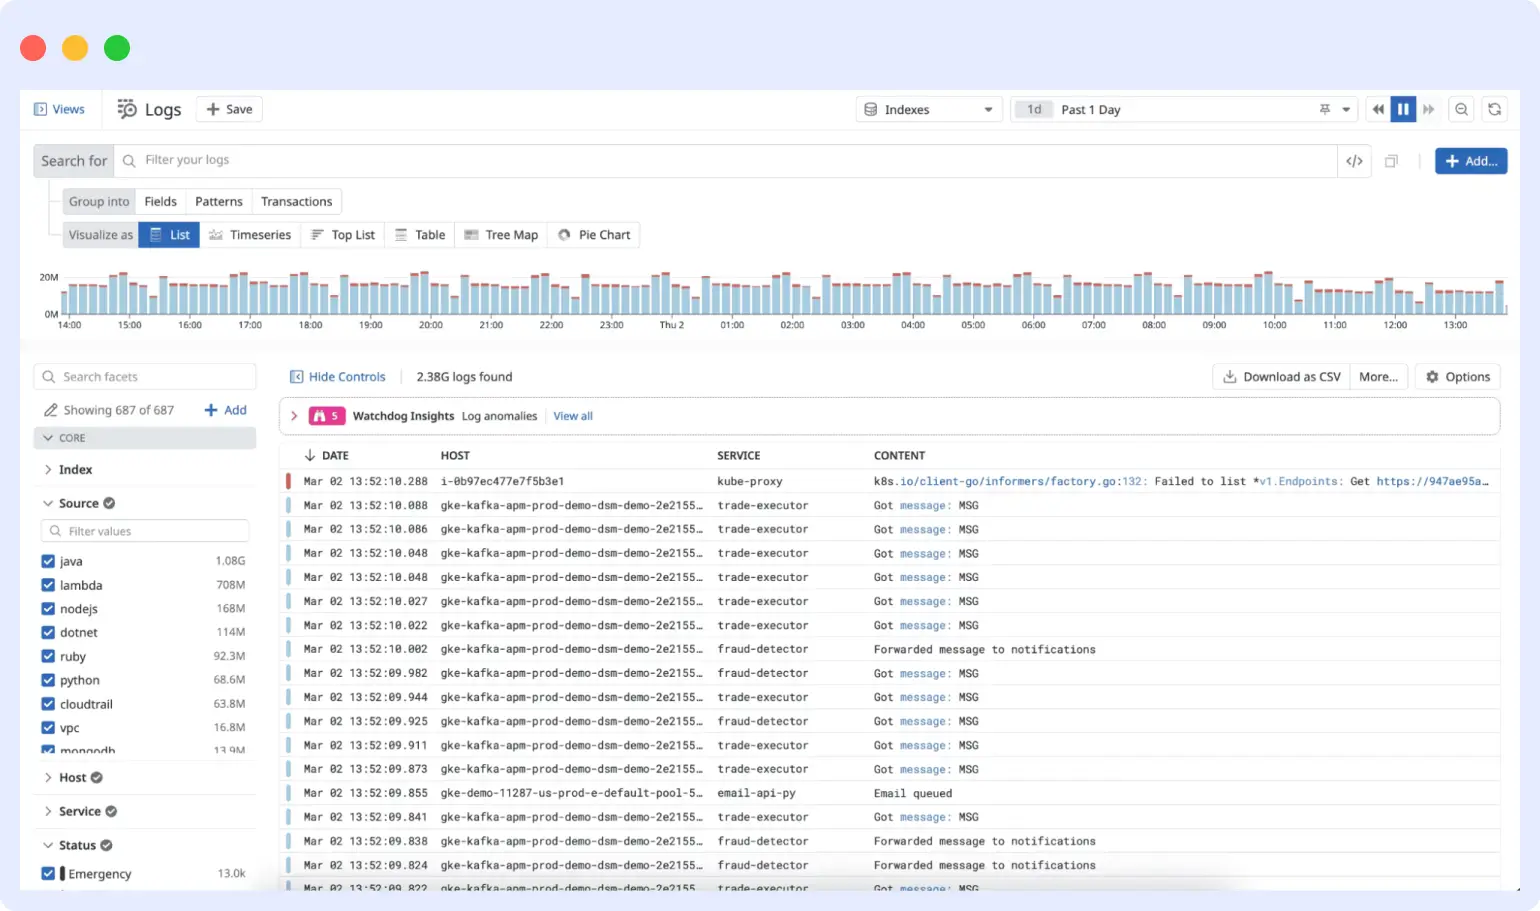
- The Log Explorer supports attribute matching, fuzzy matching, and regex search. Live Tail provides real-time visibility, and JSON logs are auto-parsed, making nested fields queryable attributes without manual setup.
- Log Anomaly Detection and Log Patterns surface unusual behavior automatically, no threshold tuning required. Similar log lines are grouped together, making it faster to spot new error patterns in noisy output.
Limitations
- No built-in SIEM or log-based threat detection. Not the right choice if security analytics is a core requirement. Default retention is 30 days without an Enterprise plan.
Pricing
- 14-day free trial (no credit card required, unlimited data)
- Pay As You Go: $0.30/GB for logs, metrics, and traces combined. 30-day default retention. Includes ingestion control, data pipeline and OpsAI error detection. No separate indexing fee, no per-host fee, no per-user fee.
- Enterprise: Custom pricing with extended retention, Bring Your Own Cloud, multi-year discounts, and 24×7 support.
See Middleware’s pricing page for current rates.
Verdict
Cloud-native and Kubernetes teams that want OTel-native log aggregation with transparent, usage-based pricing and ingestion-level controls to manage cost.
Start your free 14-day trial with Middleware — no credit card required.
2. Datadog
(Best for log search tied to APM and infrastructure data)
Datadog is a cloud-based observability platform with over 1,000 integrations. It collects logs from servers, containers, cloud services, and applications, then indexes them for search through Log Explorer.
What makes it stand out
- Log Explorer supports full-text search, attribute search, and faceted filtering. Engineers can click from a failing trace directly to the related log lines no manual timestamp matching needed.
- Flex Logs keeps cold logs queryable for up to 15 months at lower cost than full indexing rates. Natural Language Queries let engineers search logs in plain English, and AI-powered log parsing auto-generates Grok parsing rules at query time.
Limitations
- Dual billing model (ingest + index) compounds quickly at scale. Default indexed retention is only 15 days. OTel is supported, but not native workflows built in Datadog’s own syntax, don’t transfer to other backends.
Pricing
- Ingestion: $0.10/GB.
- Indexing: $1.06/million events (3-day), $1.70/million (15-day), $2.50/million (30-day), annual billing.
- Flex Logs: $0.05 per million events per month (3, 6, or 15-month retention on Starter tier).
- Log forwarding to non-archive destinations: $0.25/GB.
Watch out: Datadog charges twice, once to ingest, once to index. At 200 GB/month (~100M events), you pay $20 to ingest and another $170 to make those logs searchable at the standard 15-day rate.
Verdict
Teams already using Datadog for APM or infrastructure monitoring who want log search in the same interface. Teams not already on Datadog should weigh the dual ingestion and indexing charges against tools that charge once per GB, such as Middleware or SigNoz.
3. New Relic
(Best for unified log querying through NRQL)
New Relic is a usage-based observability platform with Log Management built into the same data store as metrics, traces, and events. Engineers query all four from one interface using NRQL, which makes it easier to move from a log line to the related trace or metric without switching tools.
What makes it stand out
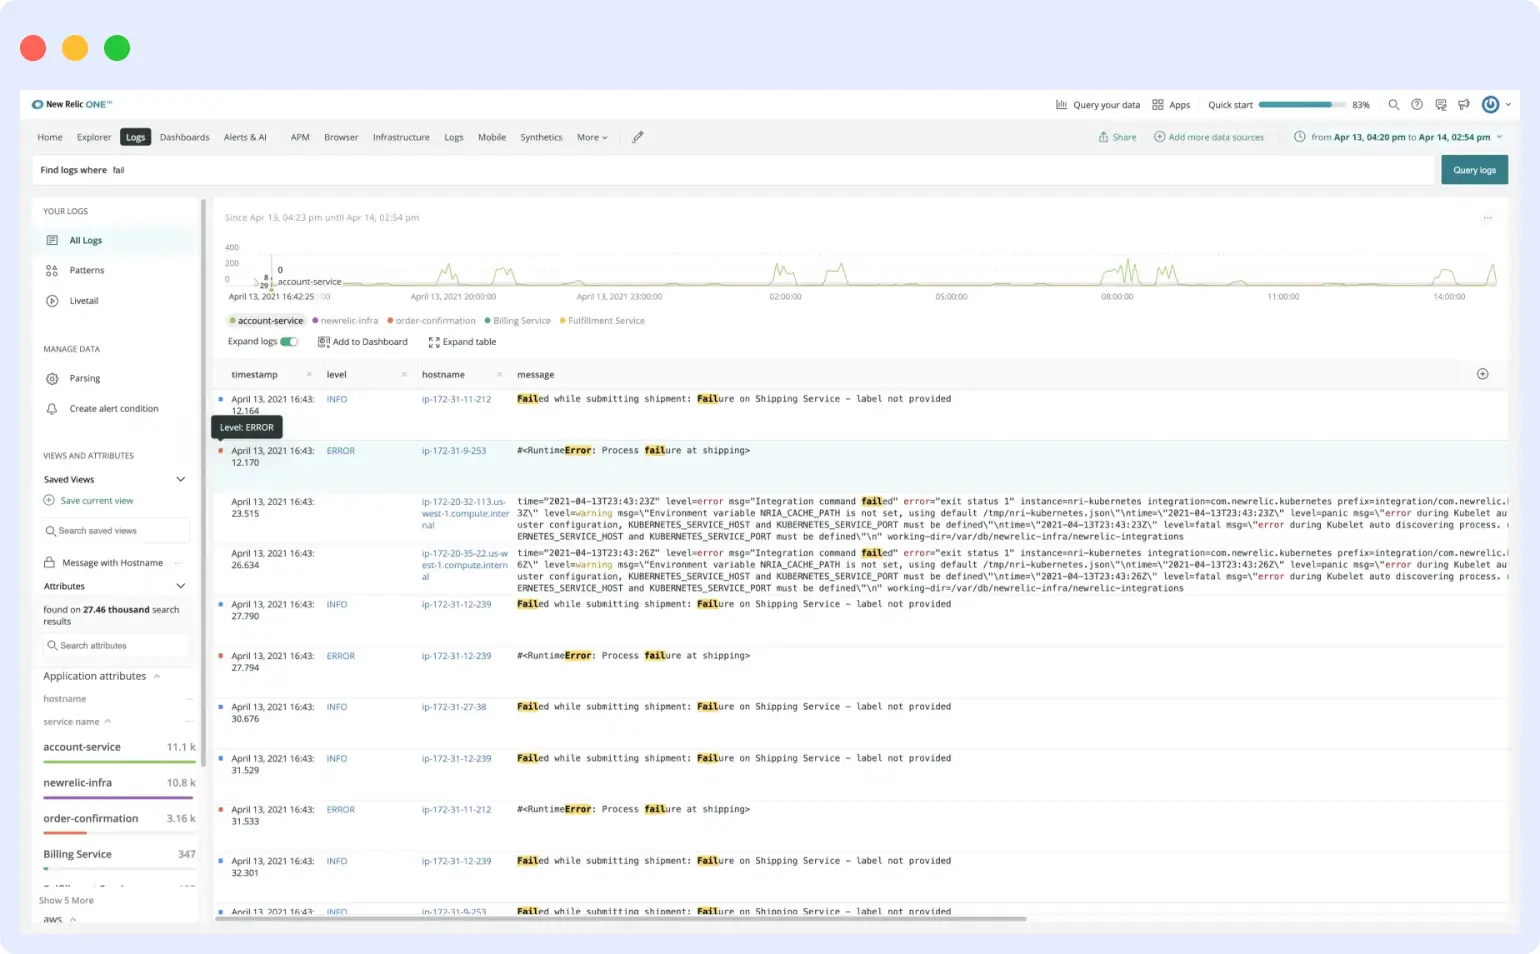
- NRQL lets engineers filter by service, host, or attribute using the same syntax whether they’re looking at a log line, a metric, or a trace. There’s no context-switching between tools during an incident.
- Logs Intelligence adds AI-assisted analysis including automatic pattern detection and AI-generated summaries. NRDOT, New Relic’s pre-configured OpenTelemetry Collector distribution, lets OTel teams send logs to New Relic’s OTLP endpoint without proprietary agents.
Limitations
- NRQL is proprietary; saved queries and alerts don’t transfer to other backends. Basic users can’t query logs or traces; you need a paid Core or Full Platform user seat. User fees add to data ingest charges.
Pricing
- Free tier: 100GB/month combined data ingest, one Full Platform user, unlimited Basic users
- Original Data: $0.40/GB beyond 100GB, 30-day log retention
- Data Plus: $0.60/GB beyond 100GB, up to 90-day extended retention, advanced log obfuscation
- Core users: $49/user/month
- Full Platform users: $10 first user (Standard), $349/user/month annual on Pro
See New Relic’s pricing for current rates.
Verdict
Teams that want unified querying across logs, traces, and metrics with usage-based ingest pricing and don’t need to query from Basic user seats.
4. SigNoz
(Best open-source OpenTelemetry-native log aggregation tool)
SigNoz is an open-source observability platform built on OpenTelemetry, using ClickHouse as the backend for logs, metrics, and traces. It’s the most popular open-source Datadog/New Relic alternative without per-host or per-user pricing.
What makes it stand out
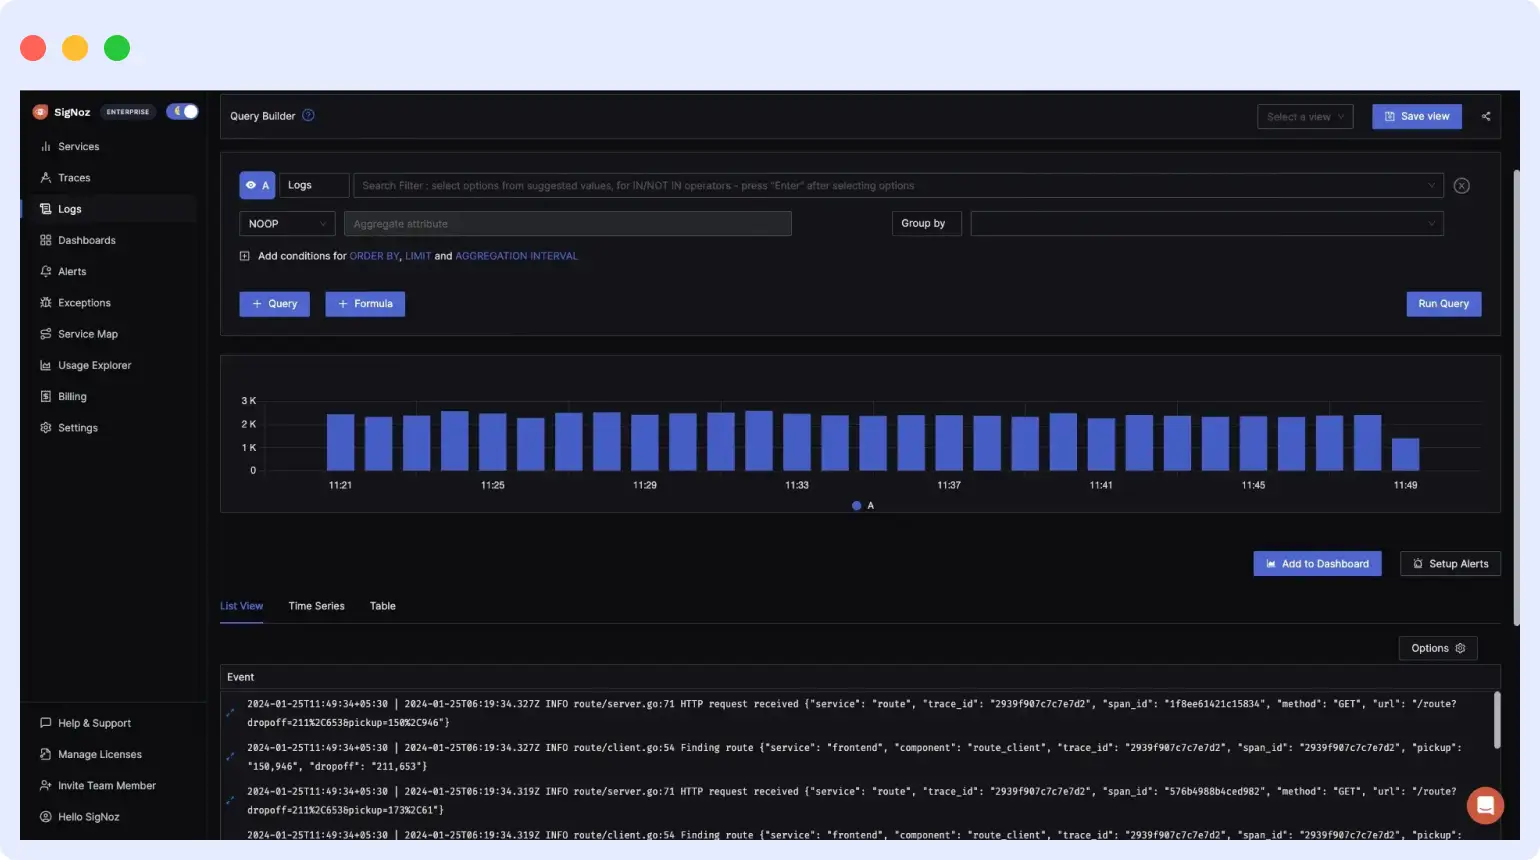
- SigNoz is OpenTelemetry-native. No proprietary agents logs flow through OTel SDKs and Collectors directly. Log Pipelines handle JSON, regex, Grok, severity, and timestamp parsing before storage.
- ClickHouse’s columnar storage makes aggregation queries fast even at high log volumes. Cloud retention is selectable per source from 15 days to 1 year, with cold-tier long-term storage also supported.
Limitations
- Smaller ecosystem than ELK or Datadog, fewer pre-built integrations and third-party plugins. Self-hosting requires managing ClickHouse, which can become its own operational burden.
Pricing
- Community edition: Free, self-hosted, open source.
- Teams Cloud: $49/month base includes $49 of usage. Beyond that, $0.30/GB for logs ingested.
- Startup Program: $19/month for eligible early-stage companies.
- Enterprise: From $4,000/month with data residency, BYOC, or self-hosted with support contract.
Verdict
Teams that want OpenTelemetry-native log aggregation without per-host or per-user pricing. The community edition suits teams with DevOps capacity to self-host; the cloud version handles the infrastructure.
5. Splunk
(Best for high-volume log search and SIEM workloads)
Splunk is an enterprise data platform that indexes machine data from virtually any source logs, metrics, traces, and security events. It supports on-premises, cloud, hybrid, and air-gapped deployments, with FedRAMP and DoD IL5 authorizations available for regulated industries.
What makes it stand out
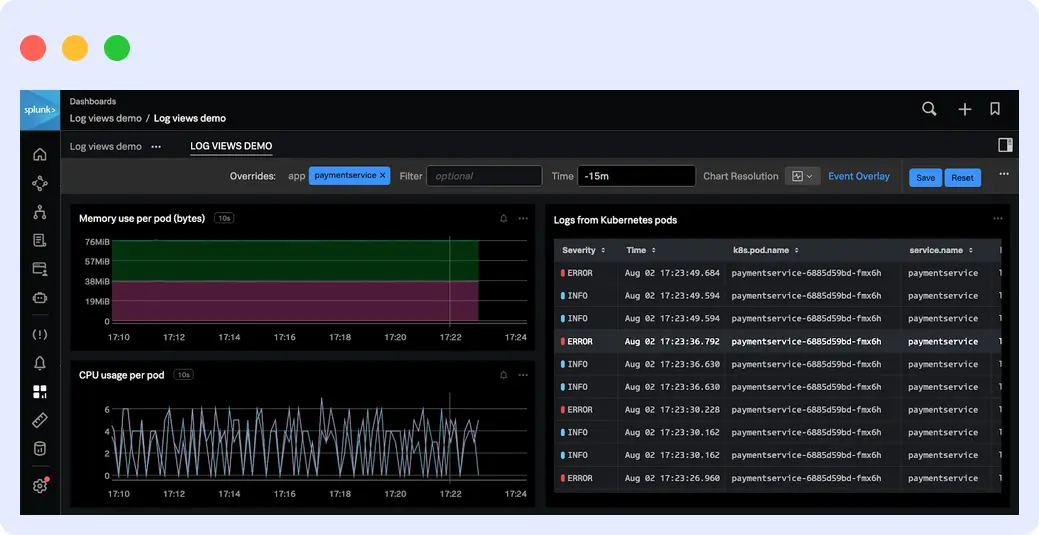
- SPL (Search Processing Language) is one of the most expressive query languages for log analysis. Engineers can chain filter, transform, and statistical aggregation commands in a single query. Splunkbase has 1,000+ apps and add-ons covering cloud platforms, databases, security tools, and IT services.
- Splunk indexes every field by default, which makes ad-hoc full-text search across large log volumes faster than label-based systems.
Limitations
- Splunk has a steep learning curve. Large deployments need dedicated Splunk administrators and significant infrastructure investment.
Pricing
- Free developer version: Up to 500 MB/day.
- Paid plans require contacting Splunk sales for a custom quote
Verdict
Large enterprise teams that need deep log search, compliance reporting, and SIEM in one platform and have the budget and staff to support it.
6. Grafana Loki
(Best for Kubernetes teams already running Grafana and Prometheus)
Grafana Loki is an open-source log aggregation system built around label-based indexing. It uses the same model as Prometheus metrics and stores compressed log chunks in object storage like S3 or GCS instead of indexing every field, which keeps storage costs low at scale.
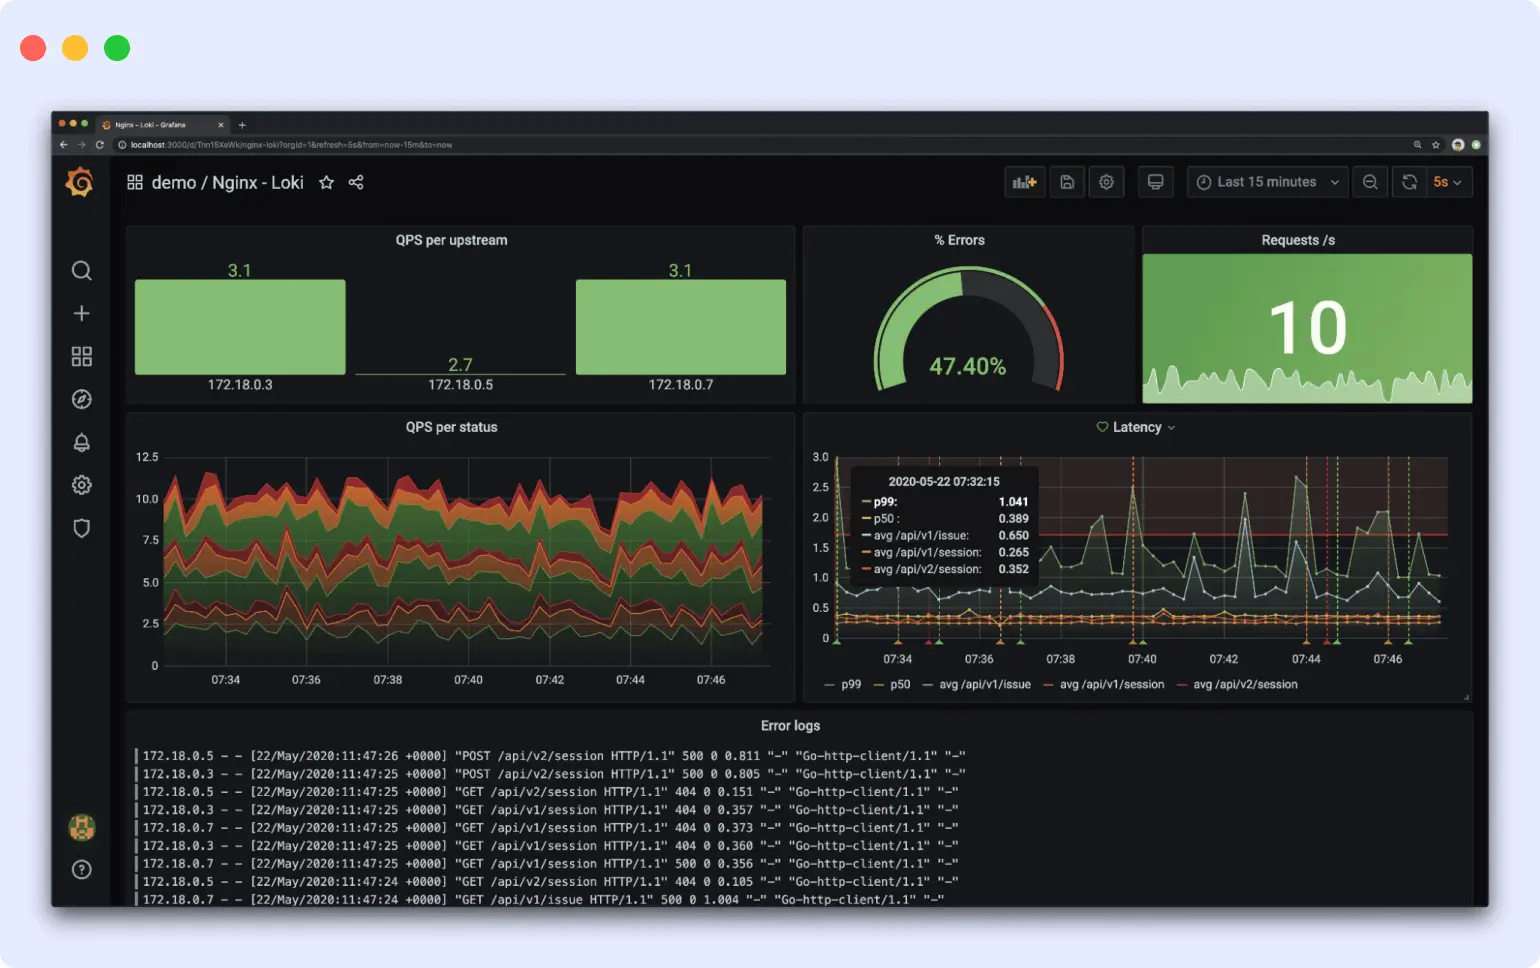
What makes it stand out
- Native integration with the LGTM stack (Loki, Grafana, Tempo, Mimir). Teams already on Prometheus and Grafana add log aggregation without switching tools.
- LogQL generates metrics from log data directly. Teams build alerts and dashboards from log patterns without a separate metrics pipeline.
- At GrafanaCON 2026, Grafana Labs announced the new “Thor” architecture for Loki with Kafka-backed ingestion and a redesigned query engine. The update delivers up to 20x less data scanned and 10x faster performance on aggregated queries.
Limitations
- Loki does not index log content full-text search is significantly slower than systems that index every field. High-cardinality labels (user IDs, trace IDs, order IDs) degrade performance. Grafana’s own docs acknowledge that Loki was not designed for high-cardinality label values. The new Thor architecture also adds Kafka as an infrastructure dependency.
Pricing
- Self-hosted: Free, AGPLv3 license.
- Grafana Cloud Free: 50GB logs included, 14-day retention.
- Grafana Cloud Pro: $19/month base, then $0.50/GB for logs ingested.
- Grafana Cloud Advanced: From $25,000/year minimum commitment.
Verdict
Kubernetes teams already invested in Grafana and Prometheus who want low-cost log storage on object storage. Not a fit for teams needing deep full-text search.
7. ELK Stack
(Best for full-text search at scale)
The ELK Stack combines Elasticsearch, Logstash, and Kibana into one of the longest-running log management platforms available. Elasticsearch indexes every field by default using Lucene, which makes it the strongest tool on this list for full-text search and complex aggregations across large log datasets.
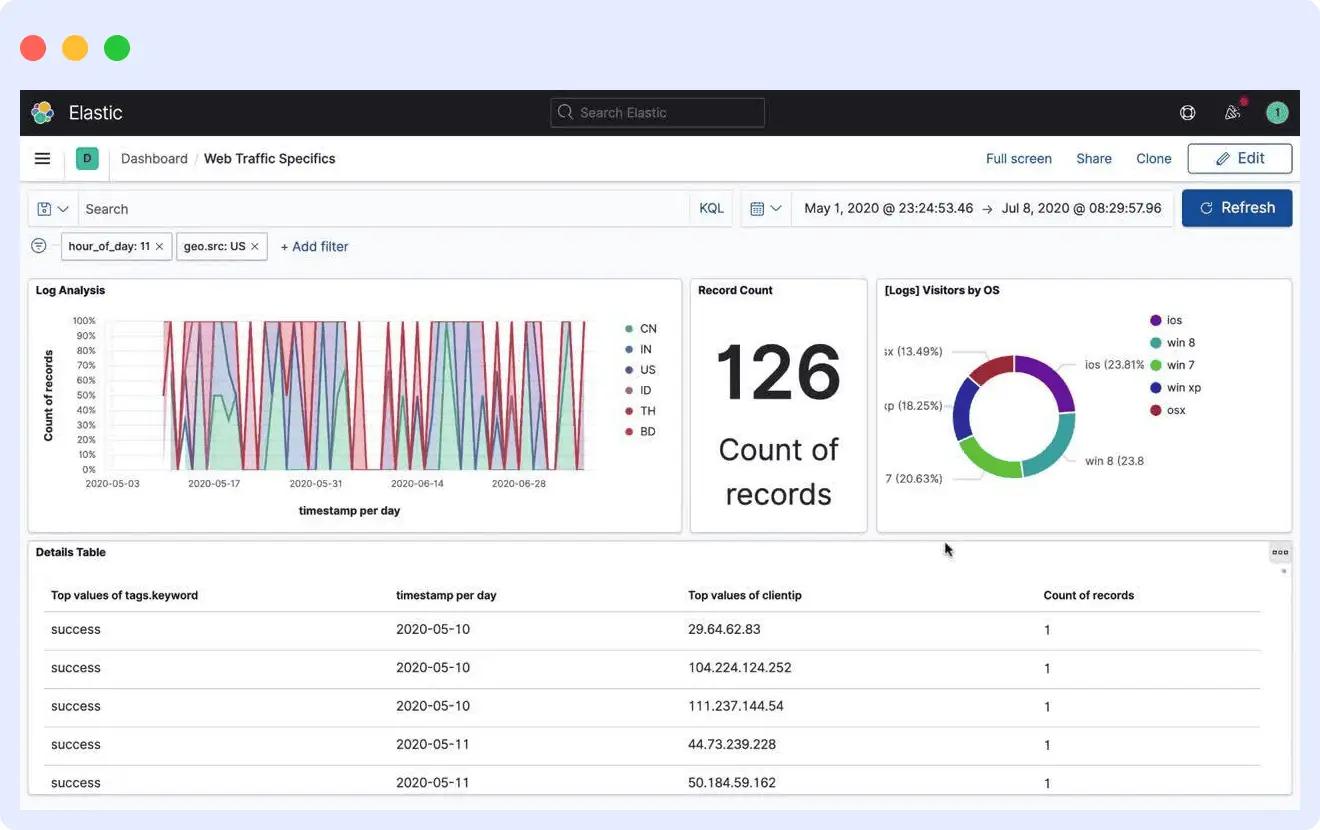
What makes it stand out
- Elasticsearch indexes every field in a log event by default. Teams run ad-hoc queries on any log attribute without pre-defining a schema, which gives forensic investigation more flexibility than label-only systems like Loki.
- Kibana handles visualization, saved searches, dashboards, and alerting in one interface. Teams move from high-level dashboards to raw log lines without switching tools.
- Beats and Logstash handle log ingestion from almost any source, including legacy infrastructure, cloud services, containers, and network devices.
Limitations
- Shard management, cluster operations, and index lifecycle policies require dedicated Elasticsearch expertise. RAM and CPU consumption grow fast with log volume. The default distribution runs under Elastic License 2.0, which restricts using it as a managed service.
Pricing
- Self-hosted: Free under AGPLv3, SSPL, or Elastic License 2.0.
- Elastic Cloud Standard: From $95/month for small deployments.
- Pricing scales with data volume, retention period, node count, and storage tier.
Verdict
Teams that need full-text search and complex querying across large, diverse log datasets and have the operational capacity to run Elasticsearch clusters. Teams without dedicated expertise should evaluate OpenObserve or SigNoz first.
8. Graylog
(Best for structured log management with strong access controls)
Graylog is a centralized log management platform built on OpenSearch or Elasticsearch and MongoDB. It handles log ingestion, pipeline processing, search, and alerting in one system. Graylog fits teams that need structured log management with strong access controls without the operational weight of a full ELK deployment.
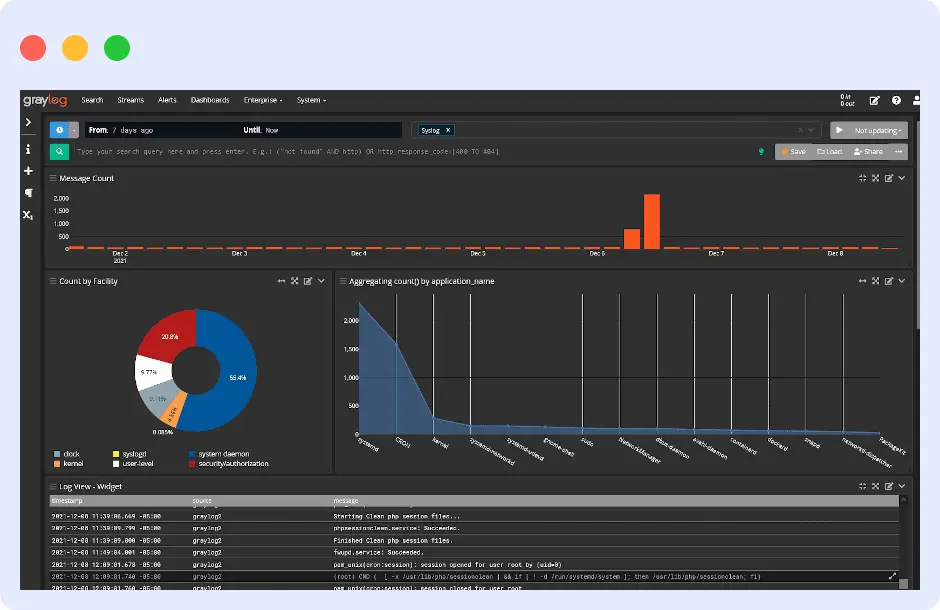
What makes it stand out
- Pipeline processing lets teams change, enrich, route, and drop messages before storage. Built-in functions handle JSON parsing, lookup tables, string manipulation, and pattern matching.
- Roles and Teams control access to streams, dashboards, and saved searches at the entity level. Graylog Enterprise adds Teams sync with LDAP or Active Directory for organization-wide permission management.
- Graylog Sidecar centrally manages log collector configurations across hosts. Tags let teams deploy the same Filebeat, Winlogbeat, or Auditbeat config to many servers without editing each host.
Limitations
- Requires running OpenSearch (or Elasticsearch) and MongoDB alongside Graylog, with significant operational overhead compared to single-binary tools. OTel support is limited to log ingestion via OTLP/gRPC; metrics, traces, and OTLP/HTTP are not supported.
Pricing
- Graylog Open: Free under SSPL.
- Graylog Enterprise (self-hosted): From $15,000/year.
- Graylog Cloud Operations: $1,250/month for 10GB/day.
Verdict
Teams that need structured log management with strong access controls but don’t want to build on top of a full ELK stack.
9. OpenObserve
(Best S3-native log aggregation tool)
OpenObserve is an open-source log aggregation platform written in Rust, built around S3-native object storage and Parquet columnar format. It ships as a single binary with logs, metrics, traces, dashboards, and alerting included. OpenObserve fits teams running high log volumes on object storage who want low storage costs without managing a multi-component stack.
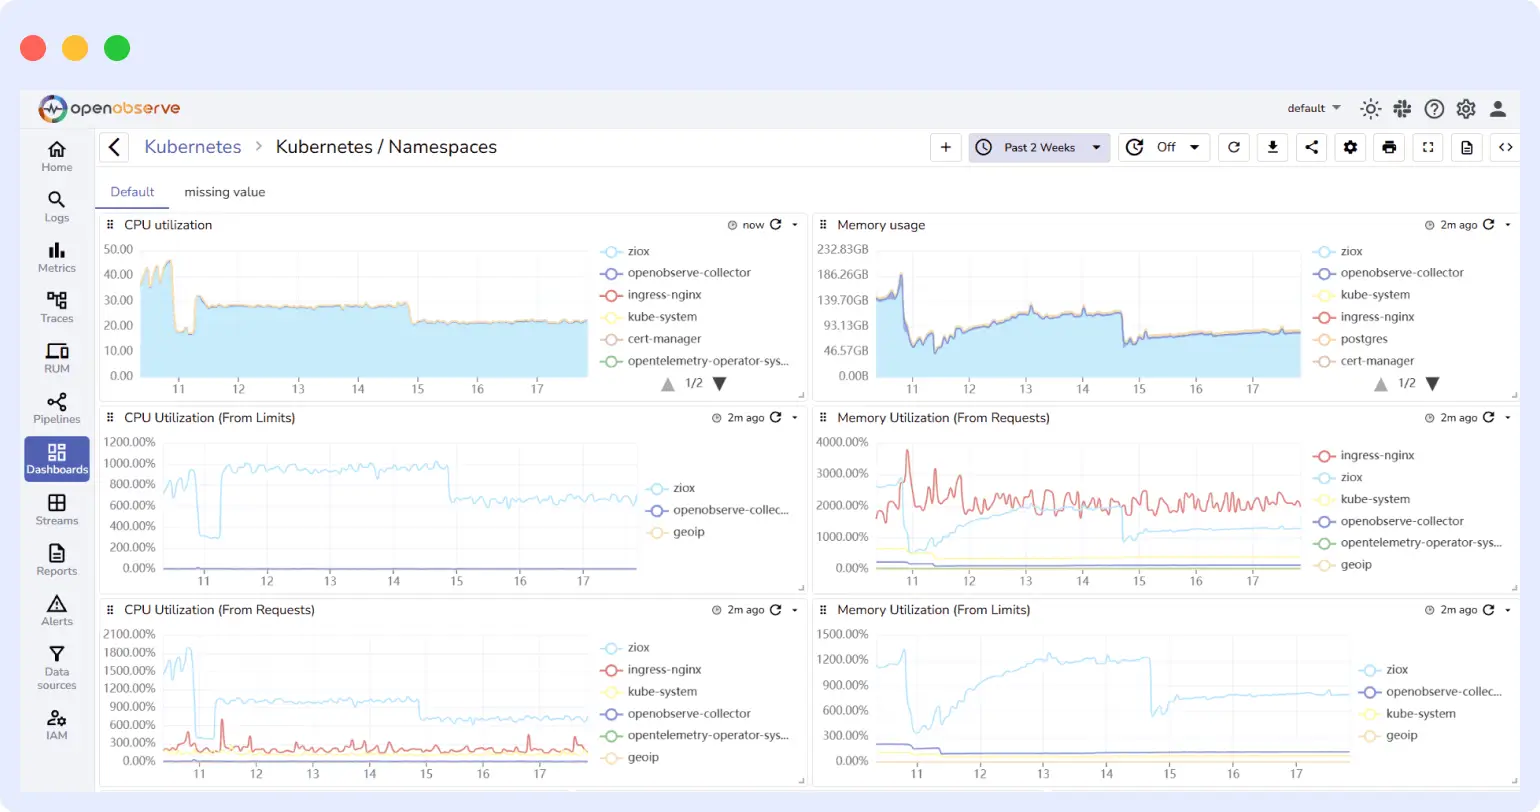
Strengths
- Parquet columnar storage on S3, GCS, Azure Blob, or MinIO keeps log storage costs significantly lower than index-heavy systems like Elasticsearch.
- SQL-based querying for logs and traces, plus PromQL for metrics. Teams that already know SQL do not need to learn a proprietary query language.
- OpenObserve is OpenTelemetry-native. Teams using OTel SDKs send logs directly without swapping instrumentation or running proprietary agents.
Limitations
- Newer than ELK or Loki smaller plugin ecosystem and fewer pre-built integrations. The Open Source edition does not include RBAC, SSO, or audit trails; those require Enterprise or Cloud.
Pricing
- Self-hosted Open Source: Free (AGPL-3.0)
- Self-hosted Enterprise: Free up to 200 GB/day (registration required above 50 GB/day; includes RBAC, SSO, audit trails)
- Cloud: $0.50/GB ingested + $0.01/GB queried (30-day retention; 30% discount for annual commitment)
Verdict
Teams running high log volumes who want the lowest possible storage cost and simple single-binary deployment. The Enterprise free tier under 200 GB/day is a strong option for teams that need RBAC and SSO without paying for Cloud.
10. Sumo Logic
(Best cloud-native SaaS for log analytics and SIEM)
Sumo Logic is a cloud-native SaaS log analytics platform that handles logs, metrics, and traces from cloud, on-premises, and hybrid environments. It fits security and DevOps teams that need ML-driven anomaly detection, Cloud SIEM, and compliance analytics without managing infrastructure.
What makes it stand out
- Cloud-native architecture with no infrastructure to manage. Sumo Logic scales automatically and handles ingestion spikes without teams provisioning capacity.
- 400+ apps and integrations across AWS, Azure, GCP, and DevOps tools, with pre-built dashboards that reduce setup time across common environments.
- Cloud SIEM includes ML-powered threat detection, MITRE ATT&CK coverage, and UEBA behavioral analytics in the same platform as log management.
Limitations
- Sumo Logic’s query language has a steep learning curve frequently flagged in reviews as unintuitive for engineers coming from SQL-based tools. Search performance can slow on complex queries during peak ingestion. No public pricing makes upfront cost forecasting difficult.
Pricing
- 30-day free trial available
- Paid plans require contacting Sumo Logic sales for a custom quote
Verdict
Cloud-native security and DevOps teams that need ML-driven threat detection and compliance analytics without managing infrastructure.
Log aggregation tools comparison table
Use the comparison below to evaluate all 10 tools across deployment model, starting price, OpenTelemetry support, and the differentiator that matters most for log workflows.
| Tools | Deployment | Starting Price | OTel Native | Key Differentiator |
| Middleware | Cloud, Self-hosted (Enterprise) | 14-day free trial. $0.30/GB after that for logs, metrics, and traces | Yes | OTel-native ingestion with pipeline-level controls to drop noise before billing |
| Datadog | Cloud | $0.10/GB ingested + $1.70/million events indexed (15-day retention). No free tier for logs | No | Trace-to-log correlation built into Log Explorer, with Flex Logs for cheap long-term retention |
| New Relic | Cloud | Free up to 100GB/month. $0.40/GB after that on Original Data | No | NRQL queries logs, traces, and metrics through one syntax |
| SigNoz | Cloud, Self-hosted | Free community edition. $49/month base + $0.30/GB on cloud | Yes | OpenTelemetry-native with ClickHouse columnar storage for fast, cost-efficient log queries |
| Splunk | Cloud, On-premises, Hybrid | Free up to 500MB/day. Paid plans require contacting sales | No | SPL is one of the most expressive query languages for log analysis at scale |
| Grafana Loki | Cloud, Self-hosted | Free self-hosted. Grafana Cloud Pro $19/month base + $0.50/GB | Yes | Label-based indexing on object storage keeps Kubernetes log costs low |
| ELK Stack | Cloud, Self-hosted | Free self-hosted. Elastic Cloud Standard from $95/month | No | Full-text search across every log field with the largest open-source plugin ecosystem |
| Graylog | Cloud, Self-hosted, On-premises | Free Open edition. Enterprise from $15,000/year | No | Pipeline processing and entity-level access control without a full ELK deployment |
| OpenObserve | Cloud, Self-hosted | Free self-hosted. Enterprise free under 200GB/day. Cloud at $0.50/GB ingested | Yes | Single binary with Parquet columnar storage on S3 keeps log costs low |
| Sumo Logic | Cloud | Contact sales. 30-day free trial available | No | Cloud-native SIEM with ML-powered threat detection and no infrastructure to manage |
How to choose the right log aggregation tool for your stack
Use the decision guide below to narrow down your options:
You want OTel-native with predictable pricing → Start with Middleware or SigNoz. Both avoid per-host and per-user fees. Middleware is fully managed; SigNoz has a free self-hosted option. Start a free trial with Middleware.
You’re already on Datadog for APM → Stick with Datadog Logs. Switching backends breaks trace-to-log correlation and adds migration overhead without enough cost savings to justify it for most teams.
You run Kubernetes and need to control storage costs → Start with Grafana Loki or OpenObserve. Both store logs on object storage. Loki uses label-based indexing; OpenObserve uses Parquet columnar storage with SQL queries.
You need full-text search across large, unstructured logs → ELK Stack or Splunk are the strongest options. ELK works for teams with Elasticsearch expertise; Splunk fits enterprise teams with dedicated administrators and a larger observability budget.
Security and compliance are the top priority → Evaluate Splunk and Sumo Logic. Both are purpose-built for SIEM, compliance reporting, and ML-driven threat detection.
You want open-source with no vendor lock-in → SigNoz, OpenObserve, or self-hosted ELK are the strongest open-source options. SigNoz and OpenObserve support OpenTelemetry natively.
You need strong access controls without ELK complexity → Graylog covers this with pipeline processing, LDAP sync, and entity-level permissions.
Key Pricing Watch-Outs
Before committing to any tool, check for charges beyond the headline rate:
- Indexing fees (Datadog charges ingest + indexing separately the indexing charge is often 10x the ingest charge)
- Per-host or per-user fees (Datadog, New Relic, and Splunk all have these in some form)
- Retention extensions (most tools charge more for >30 days)
- Rehydration costs (retrieving archived logs often has a separate per-GB charge)
- Data egress (sending logs from your cloud VPC to an external SaaS adds ~$0.10/GB in cloud provider egress fees on top of the vendor’s rate)
Regardless of which tool you choose, prioritize native OpenTelemetry support. Switching from proprietary instrumentation to OTel later means rebuilding exporters across every service.
Get started with Middleware for free — a 14-day free trial with unlimited data ingestion across logs, metrics, and traces. No credit card required.
FAQs
What is log aggregation?
Log aggregation is the process of collecting log data from multiple sources and centralizing it into a single system for search, analysis, and alerting. Those sources include servers, containers, microservices, and cloud functions.
What is the difference between log aggregation and log management?
Log aggregation is a part of log management that handles the collection and centralization of log data. Log management covers the full lifecycle: collection, storage, search, retention, alerting, and compliance reporting.
Is Fluentd a log aggregation tool?
Fluentd is a log collector, not a log aggregation backend. It collects logs from various sources and routes them to a destination like Elasticsearch, Loki, or S3. You still need a backend to store and query those logs.
What's the cheapest log aggregation tool?
Middleware, SigNoz, and OpenObserve are the most cost-efficient options on this list. Middleware offers a 14-day free trial and charges $0.3/GB after that. SigNoz starts at $0.3/GB on its cloud plan and is free to self-host. OpenObserve starts at around $0.50/GB ingested.
What's the best open-source log aggregation tool?
SigNoz is the strongest open-source option in 2026. It supports OpenTelemetry natively, handles logs, metrics, and traces in one platform, and uses columnar storage to keep query costs low.
Which log aggregation tools work best for Kubernetes?
Middleware, Grafana Loki, and SigNoz are the best fits for Kubernetes environments. All three support DaemonSet deployment, label-based log routing, and OpenTelemetry ingestion out of the box.