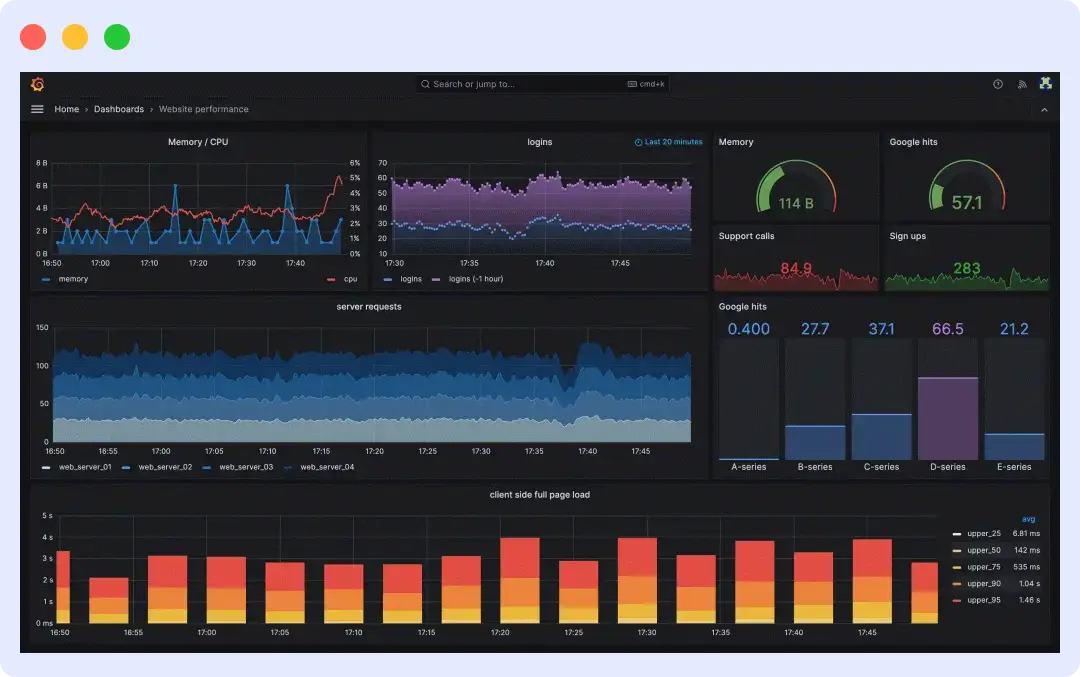
SigNoz is an open-source, OpenTelemetry-native observability platform that stores logs, metrics, and traces in ClickHouse. It works as a managed service or self-hosted, but as teams scale, they run into problems: ClickHouse becomes operational overhead, the community edition limits dashboard panels, and features like real user monitoring and synthetics aren’t part of the product.
This article compares the top 10 SigNoz alternatives across deployment, OpenTelemetry support, pricing, free-tier coverage, and the specific problem each one solves. The ten tools include Middleware, Datadog, New Relic, Dynatrace, Grafana Cloud, Dash0, Honeycomb, Last9, Better Stack, and Logz.io. If you picked SigNoz for native OpenTelemetry support, most alternatives here accept OTLP direct migration, which means changing an endpoint, not re-instrumenting your entire codebase.
TL;DR
- If you’re leaving SigNoz, the reason usually falls into one of four categories: operations, cost, missing features, or query speed.
- Tired of running ClickHouse yourself: move to a managed OpenTelemetry-native platform like Middleware or Dash0.
- Getting hit with high ingest bills: look at Last9 or Grafana Cloud, both of which price differently from per-GB models.
- Need features SigNoz doesn’t have (real user monitoring, synthetics, session replay): Datadog or New Relic cover the full stack.
- Looking for fast queries on high-cardinality trace data: Honeycomb was built for that workload.
The 10 best SigNoz competitors and alternatives in 2026
Here’s a side-by-side comparison of ten SigNoz competitors covering where you can run them, how they handle OpenTelemetry, pricing, and the type of team each one fits.
| Tool | Deployment | OTel Support | Free Tier | Best For |
| Middleware | SaaS, on-prem, BYOC, hybrid | Native | 14-day free trial with unlimited usage | Teams that want a managed platform but need to keep telemetry in their own infrastructure |
| Datadog | SaaS only | Supported | Yes, 5 hosts with 1-day retention | Teams that need RUM, synthetics, security, and 1000+ integrations and have the budget for it |
| New Relic | SaaS only | Native | Yes, 100GB/month + 1 full platform user | Teams that want full-stack coverage without per-host fees and can manage user seat costs |
| Dynatrace | SaaS, Managed (on-prem) | Supported | 15-day trial; 3-host free tier | Large enterprises that want AI-driven automation and full-stack observability with automatic instrumentation |
| Grafana Cloud | SaaS managed | Native | Yes, 10K metrics series, 50GB logs, 50GB traces, 3 users | Teams already running Prometheus, Loki, or Tempo who want a managed backend |
| Dash0 | SaaS only | Native | 14-day free trial | Teams committed to OpenTelemetry who want predictable pricing without GB or seat math |
| Honeycomb | SaaS only | Native | Yes, 20M events/month | Teams debugging high-cardinality production traces where queryable wide events matter |
| Last9 | SaaS, BYOC | Native | Free signup, no published trial limit | Teams hitting cardinality walls with metrics-heavy workloads at scale |
| Better Stack | SaaS only | Native | Yes, 10 monitors, 3GB logs, 30GB metrics | Teams that want observability and incident response (on-call, status pages) in the same platform |
| Logz.io | SaaS only | Supported | Free plan with limited features | Teams running ELK-style log analytics who want a managed Elasticsearch backend |
1. Middleware
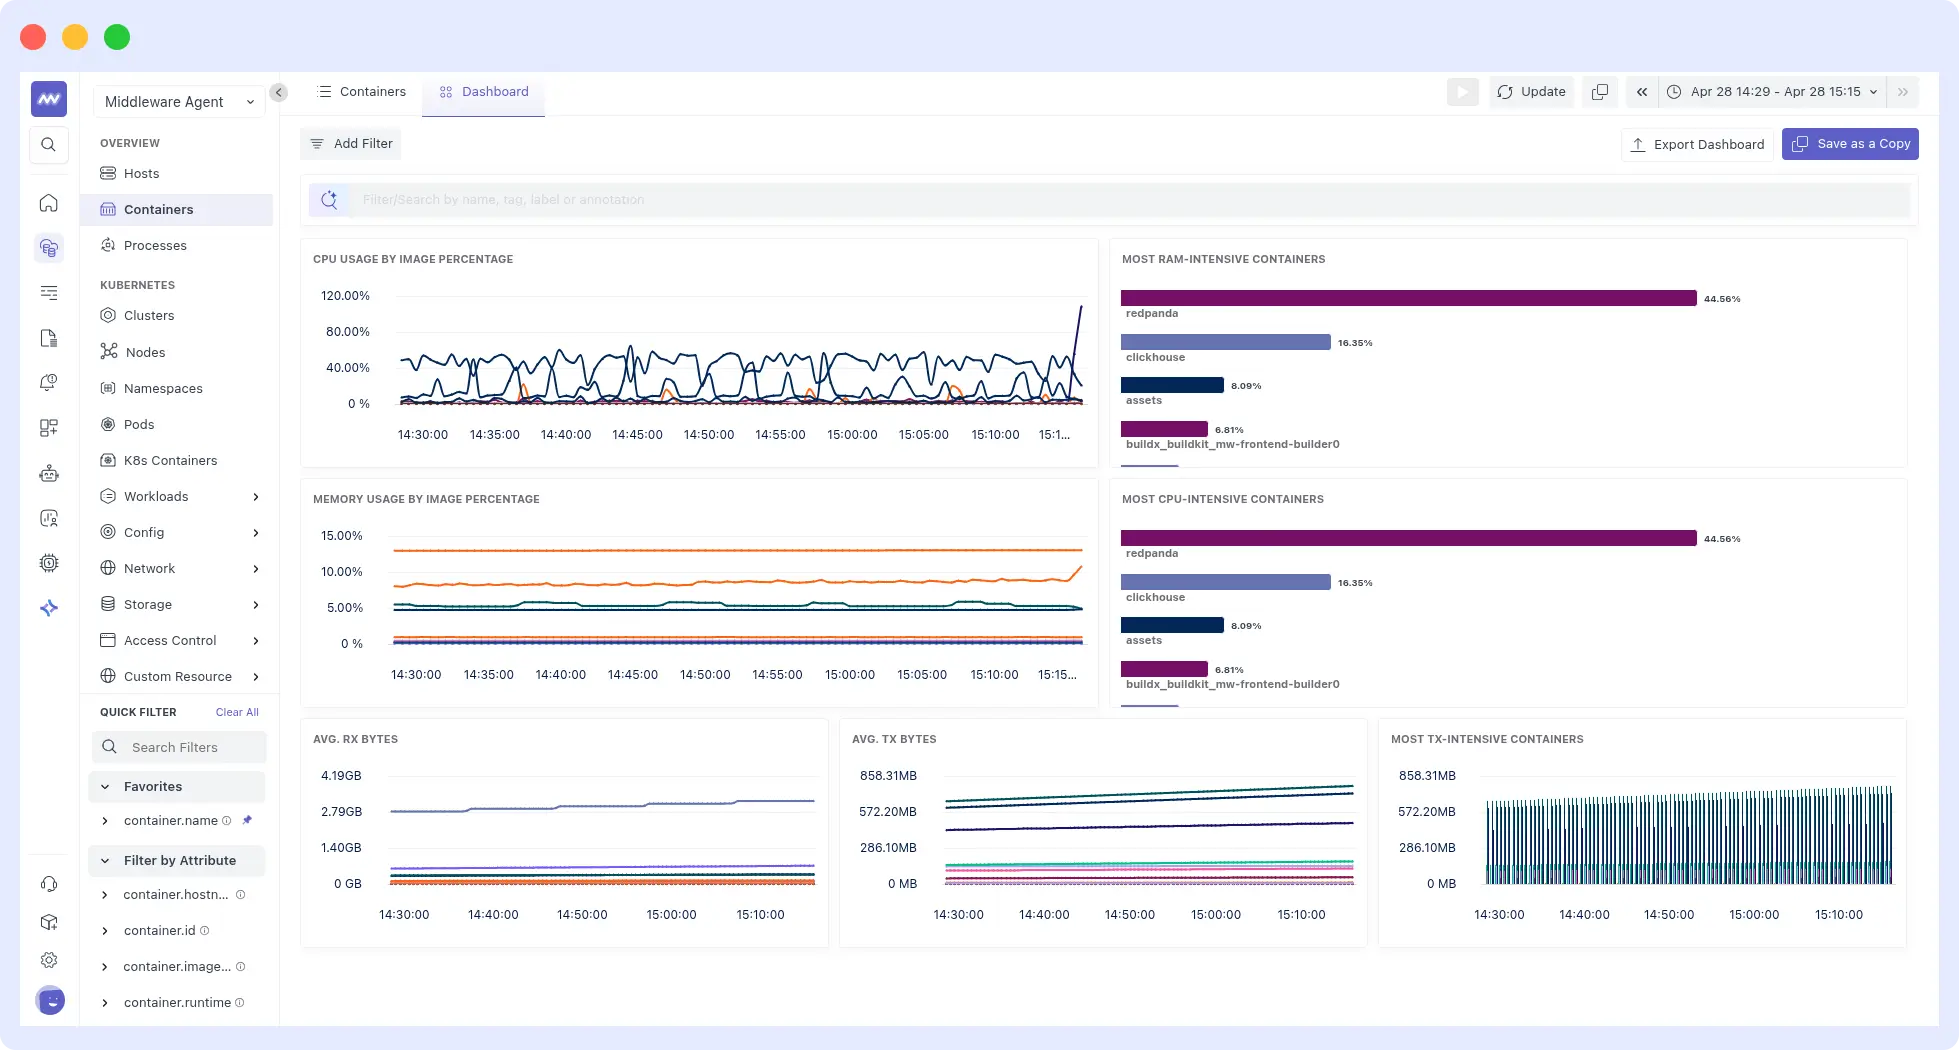
Middleware is a managed observability platform built on OpenTelemetry. It’s best for teams that want OTel-native ingestion and the option to keep telemetry in their own cloud across SaaS, on-prem, and BYOC. The OTel-based agent installs with one command.
Why it’s a SigNoz alternative
- Real user monitoring, synthetic checks, database monitoring, and OpsAI, an AI SRE agent that detects production issues, runs root cause analysis, and ships code fixes as GitHub pull requests automatically. These are features SigNoz doesn’t have.
- Point your OTel Collector at the Middleware OTLP endpoint, and historical SigNoz data stays in ClickHouse for the retention window you set before cutover.
- Middleware comes with infrastructure monitoring, container monitoring, and Kubernetes monitoring built in, so you don’t need to add a separate metrics stack the way you might with tracing-focused platforms.
Pricing
Middleware offers a 14-day free trial with unlimited data ingestion, unlimited RUM sessions, unlimited synthetic checks, and 14-day retention. After the trial, pricing is pay-as-you-go at $0.30 per GB for logs, metrics, and traces. RUM is $1 per 1,000 sessions, synthetic checks are $1 per 5,000, and OpsAI is billed by token usage. See the Middleware pricing for full details.
Limitations
Middleware is a younger platform than Datadog or New Relic. Most observability features match what older platforms offer, but Middleware doesn’t yet ship security monitoring or SIEM as part of the platform. Enterprise customers like Walmart, Hoichoi, and CEAT already use the platform at scale, so teams that don’t need security tooling on the same vendor get a mature observability product.
Verdict
The SigNoz vs Middleware choice comes down to whether you want to keep running ClickHouse yourself or hand that work over to a managed OTel-native platform with the option to run in your own cloud. Pick Middleware if running ClickHouse and ZooKeeper costs more time than it saves. Skip if you need security and SIEM under the same roof as observability.
Start your 14-day free trial of Middleware with unlimited data ingestion.
2. Datadog
Datadog is a full-stack observability platform that covers most features SigNoz doesn’t have, including RUM, session replay, synthetics, security monitoring, and database monitoring. Teams pick Datadog when they need broad feature coverage out of the box and can absorb per-host pricing across multiple products.
Why it’s a SigNoz alternative
- 1000+ integrations with ready-made dashboards. Most third-party services have a Datadog integration ready, which cuts setup time for teams running diverse stacks.
- Datadog accepts OTel Collector output through its Datadog exporter. Move the endpoint, restart the collector, and you’re done.
- Datadog’s APM, infrastructure, RUM, synthetics, and security monitoring share one data model, so you can correlate a slow page load to a backend trace to an infrastructure spike to a security alert without switching tools.
Pricing
Datadog has a free tier for 5 hosts with 1-day retention, but it doesn’t include APM, logs, or any add-on. Paid plans start at $15 per host per month for infrastructure and $31 per host per month for APM. Logs cost $0.10 per GB ingested plus $1.70 per million events indexed. See full Datadog pricing breakdown.
Limitations
Datadog’s pricing is hard to predict. Per-host fees, per-GB log ingest, and separate charges for custom metrics, RUM sessions, and synthetic checks all add up, and bills can spike without warning. OpenTelemetry users feel this most because every OTel metric counts toward the custom metric allocation, and overages cost $1 per 100 metrics per month.
Verdict
SigNoz vs Datadog: which one should you pick? The SigNoz vs Datadog choice depends on whether you want broad feature coverage at any cost or cost control with fewer features. Pick Datadog if your team needs RUM, synthetics, and security monitoring under one platform. Skip if your priority is predictable bills or you plan to instrument heavily with OpenTelemetry.
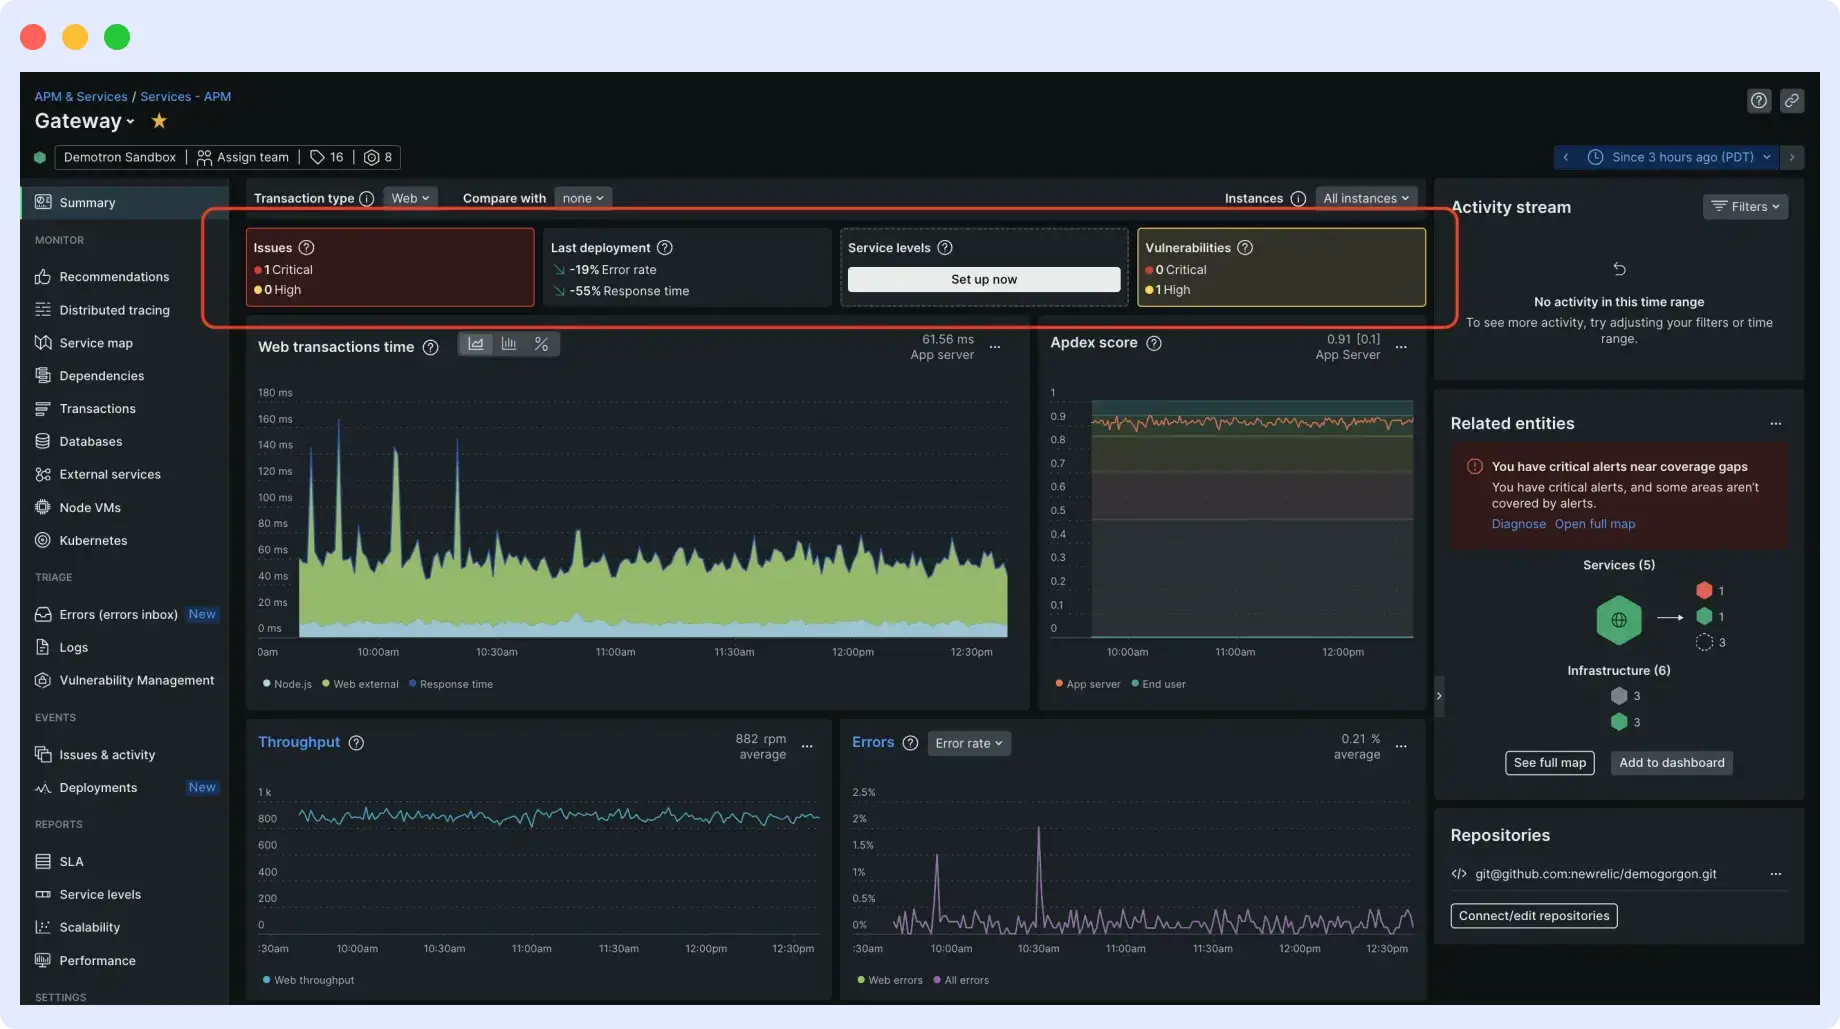
3. New Relic
New Relic is a full-stack observability platform with native OpenTelemetry support and 780+ integrations. Teams that want APM, logs, infrastructure, and synthetics under one platform tend to land on New Relic, since it charges for data ingest instead of per host.
Why it’s a SigNoz alternative
- New Relic’s free tier has no time limit, so small teams can run real production observability without paying. Most teams stay under the limits indefinitely.
- New Relic has a native OTLP endpoint. If your apps already send OTel data to SigNoz, you only need to swap the endpoint URL and the API key.
- RUM, browser monitoring, mobile monitoring, synthetics, and AI-powered analytics through New Relic AI cover the full stack, which SigNoz doesn’t support.
Pricing
New Relic offers a free tier with 100GB of monthly ingest, one full platform user, and unlimited basic users. Beyond that, data costs $0.40 per GB on Original Data or $0.60 per GB on Data Plus. Full platform users cost $349 each per month on the Pro plan (annual billing), and core users cost $49 each per month.
Limitations
- A team of 6 has to move from Standard to Pro because Standard caps at 5 full platform users. The bill jumps from $406 per month to $2,094 per month, which is a 5x increase from adding one person.
- New Relic uses its own query language (NRQL) for dashboards, alerts, and queries, so dashboards built on the platform don’t transfer if you leave.
Verdict
SigNoz vs New Relic: pricing and team size decide it. New Relic is cheaper for data ingestion but more expensive for user seats, while SigNoz charges only for ingestion. Pick New Relic if your team is small enough that the free tier or low seat counts cover most of your usage. Skip if your team is large and per-seat fees would exceed your data costs.
4. Dynatrace
Dynatrace is an enterprise full-stack observability platform with AI-driven root cause analysis (Davis AI) and automatic instrumentation through its OneAgent. Large enterprises pick Dynatrace for its zero-touch instrumentation, automated dependency mapping, and coverage across hybrid and multi-cloud environments.
Why it’s a SigNoz alternative
- OneAgent automatically discovers and maps dependencies across hosts, containers, services, and processes without manual instrumentation, which is much faster to set up than wiring up OTel collectors yourself.
- Davis AI handles root cause analysis automatically by correlating events across the stack, so you spend less time guessing and more time fixing.
- Dynatrace covers APM, infrastructure, logs, RUM, synthetics, and application security under one platform, all features SigNoz doesn’t ship.
Pricing
Dynatrace uses consumption-based pricing with no permanent free tier. Full-Stack Monitoring costs $0.08 per hour for an 8 GiB host (about $58 per month per host). Logs cost $0.20 per GB ingested plus $0.02 per GB-day retained. Real user monitoring is $0.00225 per session, and synthetics are $0.001 per request. There’s a 15-day free trial with full platform access. Dynatrace also requires an annual minimum spend commitment that’s quote-based.
Limitations
Dynatrace bills hosts by memory at $0.01 per GiB-hour with a 4 GiB minimum floor per host, so even small hosts with less than 4 GiB of RAM still get billed at the 4 GiB rate. This means micro-instances cost more than expected, and bills get harder to predict in environments with many small hosts. Dynatrace also requires an annual minimum spend commitment that isn’t published publicly, so teams have to negotiate a contract before knowing their full cost.
Verdict
SigNoz vs Dynatrace is really a question of scale. Pick Dynatrace if you’re a large enterprise that needs AI-driven automation, full-stack coverage, and have the budget for an annual contract. Skip if you’re a small or mid-sized team, since Dynatrace is built for enterprise scale and pricing.
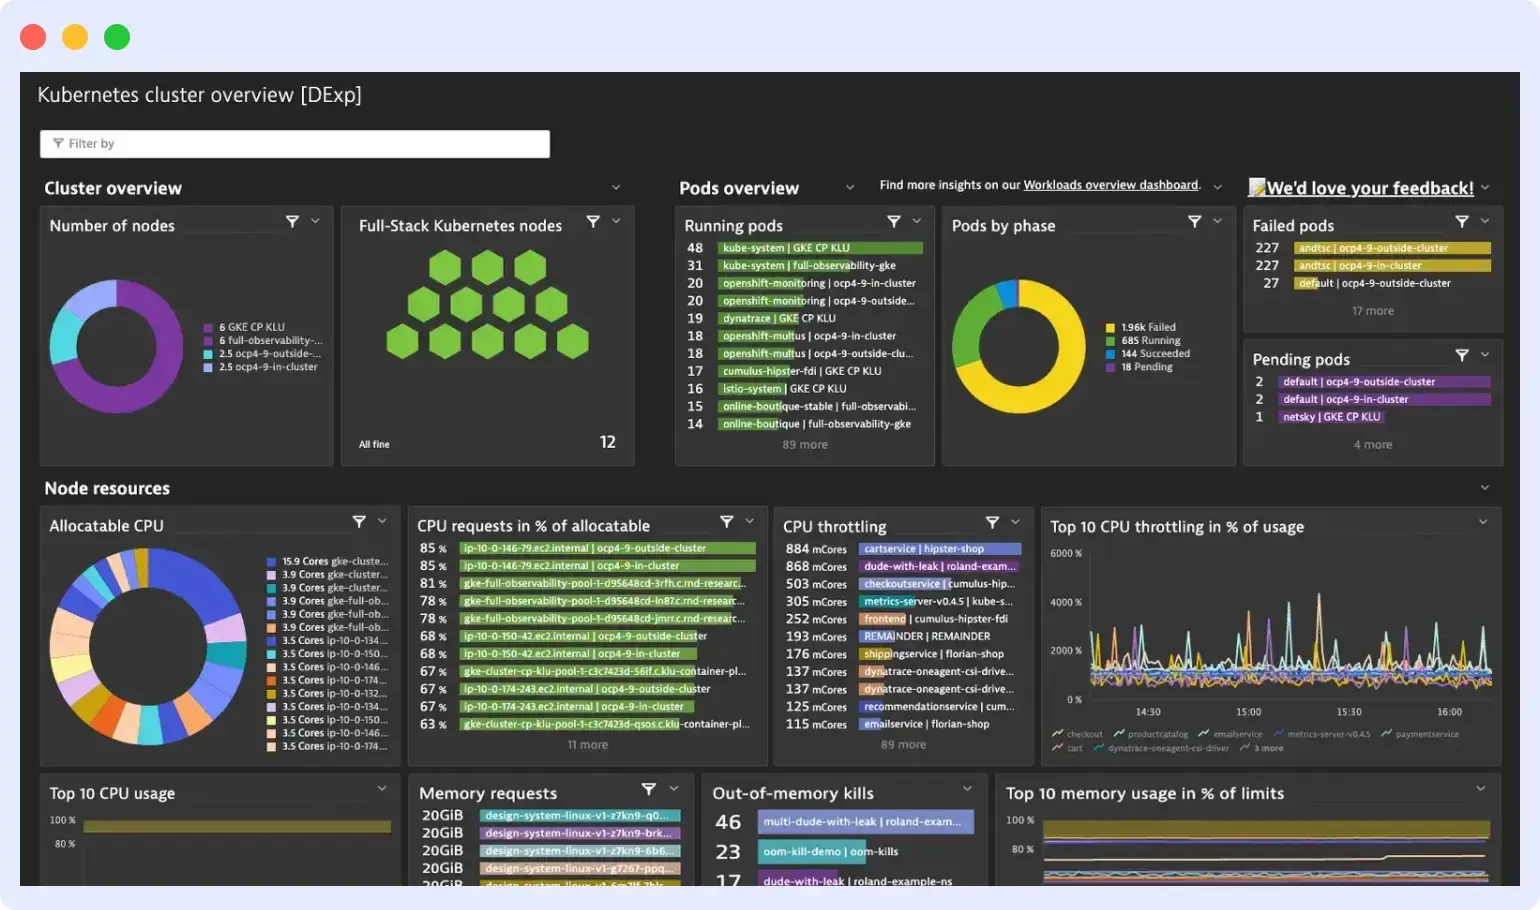
5. Grafana Cloud
Grafana Cloud is a managed observability platform built on the open-source LGTM stack (Loki for logs, Grafana for visualization, Tempo for traces, Mimir for metrics). Teams already running Prometheus or other open-source tools choose Grafana Cloud when they want a managed backend without the upkeep.
Why it’s a SigNoz alternative
- Grafana Cloud’s free tier is generous enough to cover most small teams running real production workloads, which makes it a low-risk way to leave SigNoz.
- Grafana Cloud ingests OTel data through OTLP, which means existing SigNoz instrumentation works as-is once you update the export target.
- Grafana OSS is free and self-hostable, so teams that want to leave SigNoz but keep the self-hosting option get both managed and self-managed paths from the same vendor.
Pricing
Grafana Cloud has a free tier with 10K metric series, 50GB logs, 50GB traces, and 3 users with 14-day retention. The Pro plan starts at $19 per month and adds usage-based billing: $6.50 per 1,000 metric series, $0.50 per GB for logs, and $0.50 per GB for traces. The Advanced plan starts at a $25,000 annual commit.
Limitations
- Grafana Cloud uses three different query languages (PromQL for metrics, LogQL for logs, TraceQL for traces), which creates a steeper learning curve than tools with a single query language.
- There’s no native APM auto-instrumentation. You have to instrument your code with OpenTelemetry yourself, while Middleware, Datadog, and New Relic ship agents that do this for you.
Verdict
If your team already uses Prometheus, the SigNoz vs Grafana Cloud decision is mostly made. Pick Grafana Cloud if your team is comfortable with PromQL and wants the same open-source LGTM stack as a managed service. Skip if you want a single query language across signals or need APM auto-instrumentation out of the box.
6. Dash0
Dash0 is an OpenTelemetry-native observability platform built on OTLP, PromQL, and Perses. Teams that have committed to OpenTelemetry pick Dash0 when they want predictable pricing without per-host or per-seat fees.
Why it’s a SigNoz alternative
- Pricing is based on signal count (logs, spans, and metric data points), not GB or seats, so costs don’t blow up when cardinality grows.
- Dash0 is OTel-native end-to-end, so any service already instrumented for SigNoz can ship telemetry to Dash0 with a config change instead of new code.
- Built-in features SigNoz doesn’t have, including website monitoring, synthetic monitoring, and Agent0, an AI copilot that helps with troubleshooting and dashboard creation.
Pricing
Dash0 offers a 14-day free trial with unlimited usage. After that, pricing is published per signal: $0.20 per million metric data points (13-month retention), $0.60 per million spans, log records, or web events (30-day retention), and $0.20 per thousand synthetic API check runs. There are no per-host or per-seat fees.
Limitations
Dash0 is SaaS only, so teams leaving SigNoz partly for the self-hosting path lose that option. The product is also young (founded in 2023), and reviewers note that some convenience features common in older platforms aren’t there yet.
Verdict
SigNoz vs Dash0 comes down to one question: do you want to keep running infrastructure yourself or hand it over? Pick Dash0 if you want OTel-native ingestion, predictable signal-based pricing, and built-in features like synthetics and AI-assisted troubleshooting. Skip if you need self-hosting or a mature feature set with the depth of older platforms.
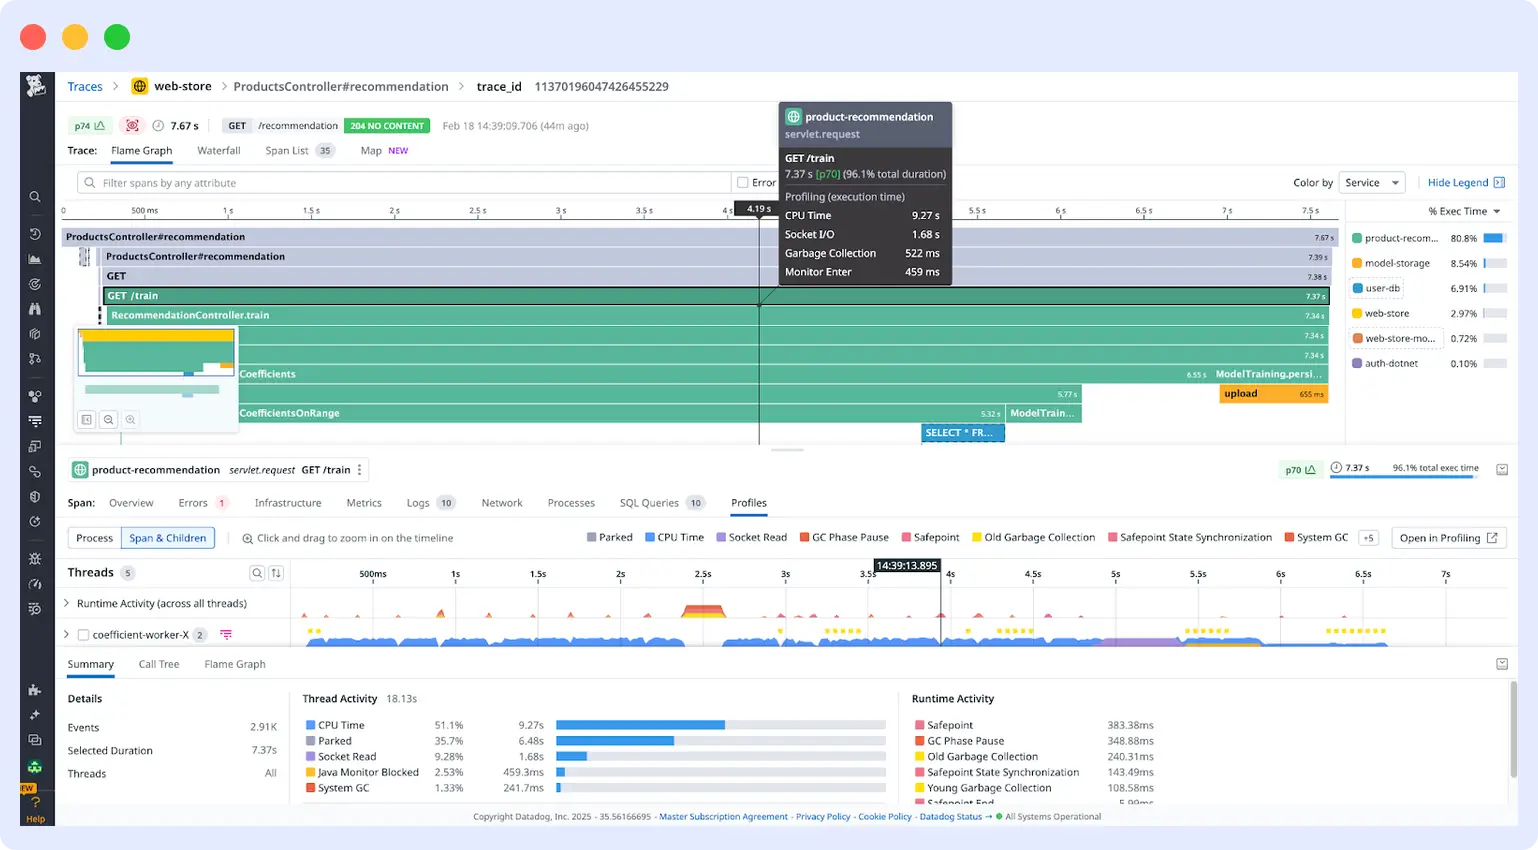
7. Honeycomb
Honeycomb is an observability platform built for high-cardinality event data, with native OpenTelemetry support and a query engine designed for fast queries on wide events. Teams debugging complex distributed systems pick Honeycomb when the questions they need to ask weren’t planned in advance.
Why it’s a SigNoz alternative
- The query engine groups and filters high-cardinality fields like user ID or request ID without slowing down, which is where SigNoz’s ClickHouse setup struggles. For a wider look at this category, see Middleware’s distributed tracing tools comparison.
- Honeycomb takes OTel data through OTLP. Migrating from SigNoz means changing the destination, not the instrumentation.
- BubbleUp automatically surfaces which dimensions of an event correlate with anomalies, which cuts time spent guessing during incident investigation.
Pricing
Honeycomb offers a free tier with up to 20 million events per month and 60-day retention. The Pro plan starts at $130 per month for 100 million events, scaling up to 1.5 billion events with 500 million time series data points included. Enterprise pricing starts at 10 billion events per year with custom terms.
Limitations
- Infrastructure monitoring isn’t Honeycomb’s strength. It now supports time-series metrics, but teams running heavy infrastructure workloads often pair it with a separate tool like Middleware, Datadog, or Grafana Cloud.
- The integration ecosystem is smaller than Datadog or New Relic, with fewer named connectors. Some niche third-party services aren’t covered out of the box and need manual instrumentation.
Verdict
What you’re optimizing for shapes the SigNoz vs Honeycomb choice. Pick Honeycomb if your main pain is slow queries on high-cardinality trace data and you want to debug production issues with full event context. Skip if you need broad infrastructure monitoring or a deep integration catalog under one platform.
8. Last9
Last9 is a telemetry data platform built for high-cardinality observability at scale, with native OpenTelemetry and Prometheus support. Teams running metrics-heavy workloads at scale go to Last9 when high-cardinality data starts breaking per-GB pricing models.
Why it’s a SigNoz alternative
- Pricing is based on events with no per-host, per-user, or separate custom metrics fees, so high-cardinality metrics don’t blow up the bill the way they can with per-GB models.
- Last9 ingests OpenTelemetry data and Prometheus-compatible metrics, so SigNoz instrumentation can move over by updating the OTel exporter target.
- Pre-ingestion workflows let you drop, redact, or enrich telemetry before storage, which gives you a way to control noise and cost without redeploying applications.
Pricing
Last9’s Pro plan starts at $1,150 per month for 1 billion events, with unlimited team members, 90-day retention for metrics, and 14-day retention for logs and traces. Beyond that, pricing is events-based with no per-host, per-user, or per-custom-metric fees. The Enterprise plan adds bring-your-own-cloud, custom retention, and commitment pricing.
Limitations
- The integration ecosystem is smaller than Datadog or New Relic. Teams running niche third-party services may need to instrument them manually with OpenTelemetry.
- Dashboards can take a moment to load on large datasets, and some workflows involve more manual steps than older platforms.
Verdict
If high-cardinality metrics are your main problem, SigNoz vs Last9 leans toward Last9. Pick Last9 if you’re hitting cardinality limits with SigNoz and want events-based pricing that scales with usage instead of hosts. Skip if you need a deep integration catalog or features like RUM and synthetics under one platform.
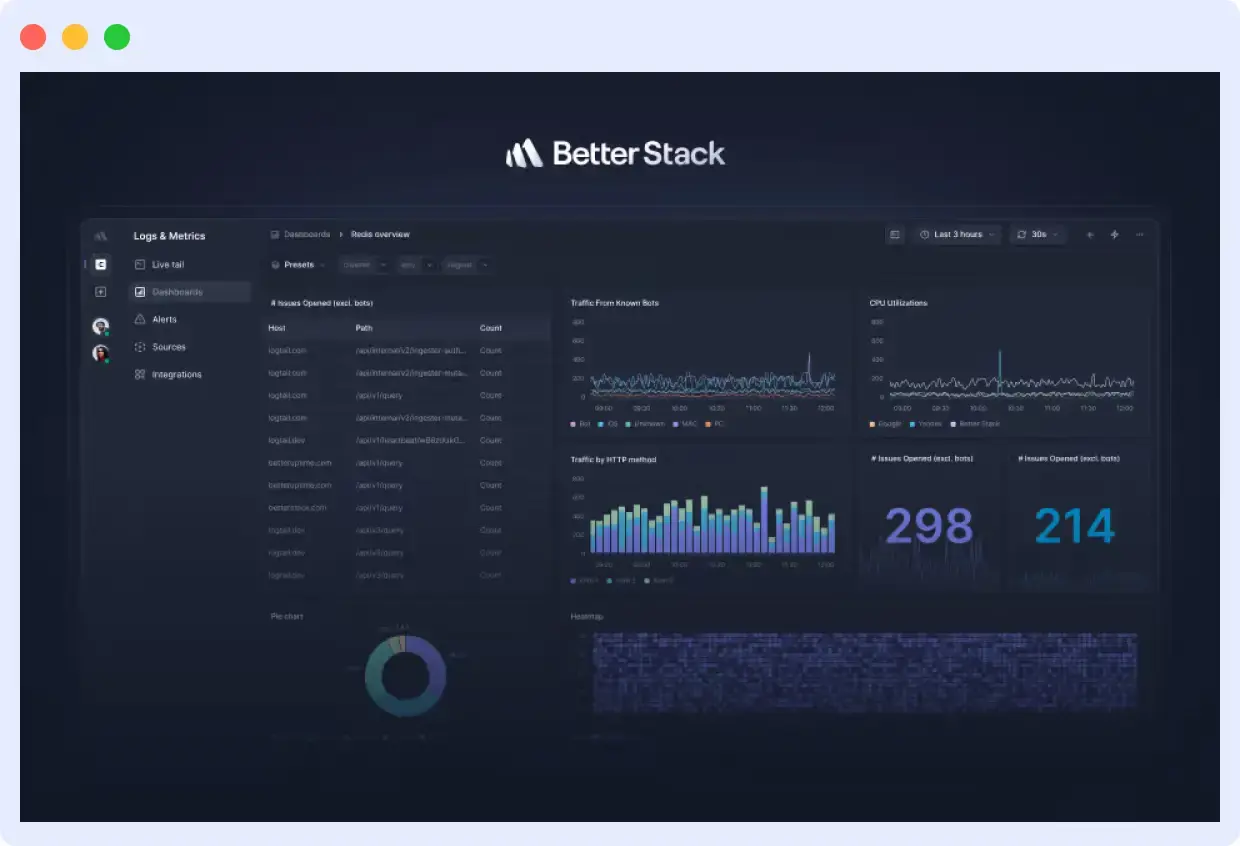
9. Better Stack
Better Stack combines logs, metrics, traces, error tracking, RUM, uptime monitoring, on-call scheduling, and status pages on one platform. Teams that want observability and incident response in the same tool, instead of paying for separate vendors, pick Better Stack.
Why it’s a SigNoz alternative
- Better Stack uses ClickHouse as its backend, the same engine SigNoz uses, but adds eBPF-based zero-code instrumentation that doesn’t require manual OpenTelemetry collector setup.
- The platform includes incident management, status pages, and uptime monitoring out of the box, which SigNoz doesn’t cover natively. Teams using SigNoz often pay separately for PagerDuty and Statuspage to get this coverage.
- An AI SRE feature investigates incidents automatically by mapping the blast radius across logs, traces, and the service graph.
Pricing
Better Stack offers a free tier with 10 monitors, 1 status page, 3GB of logs with 3-day retention, and 30GB of metrics. The Pay-as-you-go plan starts at $29 per month per Responder license and includes incident management, on-call scheduling, and unlimited phone and SMS alerts. Telemetry bundles for logs, metrics, and traces start separately at $25 per month for 40GB of each signal type (Nano bundle), scaling up to $420 per month for 700GB of each (Tera bundle).
Limitations
Better Stack is SaaS only, so teams that need to keep telemetry in their own cloud lose that option. The platform doesn’t currently support self-hosting, HIPAA compliance, or native LLM monitoring.
Verdict
SigNoz vs Better Stack is really a question of scope. Do you want observability alone, or observability plus incident response in one tool? Pick Better Stack if your team is tired of stitching together SigNoz plus PagerDuty plus Statuspage and wants one bill instead of three. Skip if you need self-hosting or HIPAA compliance.
10. Logz.io
Logz.io is a managed observability platform built on the open-source ELK Stack, Grafana, Prometheus, and Jaeger. Teams running ELK-style log analytics pick Logz.io when they want a managed Elasticsearch backend without the operational work.
Why it’s a SigNoz alternative
- The platform is built on familiar open-source tools (ELK, Grafana, Prometheus, Jaeger), so teams already comfortable with those tools don’t have to learn a new query syntax or dashboarding model.
- Logz.io supports OpenTelemetry ingestion with one-click instrumentation. Existing SigNoz setups migrate by reconfiguring the OTel exporter.
- The AI agent supports natural language querying and dashboard recommendations, which speeds up troubleshooting for teams without deep query language experience.
Pricing
Logz.io uses consumption-based pricing across four products: Log Management at $0.92 per GB per day, Infrastructure Monitoring at $0.40 per 1,000 time-series metrics per day, Distributed Tracing at $0.92 per GB per day, and Agentic Observability at $10 per million tokens.
Limitations
Logz.io is positioned more as a managed ELK alternative than a full APM platform, so features like RUM and synthetics are not part of the core product the way they are with Datadog or New Relic.
Verdict
SigNoz vs Logz.io comes down to your data model preference: OTel-native or managed ELK? Pick Logz.io if your team already uses ELK and you want to keep the same tooling without running Elasticsearch yourself. Skip if you need OTel-native ingestion as the core data model or full-stack APM features under one platform.
How to choose a SigNoz alternative
If operational burden is the problem, pick Middleware or Dash0. Both run as managed services with native OpenTelemetry support, so you stop spending engineering hours on ClickHouse upkeep. You also keep the OTel-first model that brought you to SigNoz. Middleware also offers BYOC if compliance requires telemetry to stay in your cloud.
If cost predictability is the problem, pick Last9 or Grafana Cloud. Last9 prices on events and cardinality instead of GB, which helps most when metrics-heavy stacks have high cardinality that blows up per-GB bills. Grafana Cloud’s free tier covers 10K metric series, 50GB logs, and 50GB traces, which buys small teams months of room before paying.
If you need features SigNoz doesn’t have, pick Datadog or New Relic. Both cover RUM, synthetics, session replay, and security monitoring. For a deeper look at RUM specifically, see Middleware’s comparison of real user monitoring tools. Datadog has more integrations than New Relic does (1000+ vs. 780+). New Relic wins on cost predictability since it doesn’t charge per host. Pick Datadog if your team needs all those extra features. Pick New Relic if you mostly need APM plus full-stack visibility and want to avoid per-host pricing.
If query speed on high-cardinality data is the problem, pick Honeycomb. It was built for fast queries on wide events with many unique values, which is where SigNoz’s ClickHouse setup slows down. Last9 handles cardinality well for metrics, but Honeycomb is the better pick for trace-level debugging at scale.
Before committing, run a one-week trial with your real production data, not synthetic samples. Watch for two signals: how the bill projects at your actual ingest volume after the trial discount ends, and whether queries stay fast when you filter on a high-cardinality field like user ID or request ID.
FAQs
What is the best alternative to SigNoz?
The best alternative depends on the SigNoz limitation you want to fix. Middleware and Dash0 fit teams that want a managed OpenTelemetry platform without ClickHouse upkeep. Last9 and Grafana Cloud fit teams hit by high ingest bills. Datadog and New Relic fit teams that need RUM, synthetics, and session replay. Honeycomb fits teams that need fast queries on high-cardinality trace data.
Is SigNoz better than Datadog?
SigNoz is better for OpenTelemetry-native ingestion, no per-host pricing, and self-hosting. Datadog is better for ready-to-use features like RUM, synthetics, session replay, and 1000+ integrations.
Why do teams move away from SigNoz?
SigNoz’s community edition caps the number of dashboard panels and alert rules, which is usually the first limitation teams hit before they start looking for alternatives. Teams leave SigNoz for four reasons: ClickHouse operational overhead, dashboard panel limits in the community edition, missing features like RUM and synthetics, and unpredictable cloud costs at high ingest volume.
Which SigNoz alternatives support OpenTelemetry natively?
Middleware, New Relic, Grafana Cloud, Dash0, Honeycomb, Last9, and Better Stack are OpenTelemetry observability tools with native OTLP support. Datadog, Dynatrace, and Logz.io accept OpenTelemetry data but route it through their own ingestion paths.
Is there a free SigNoz alternative?
Yes. Middleware offers a 14-day free trial with unlimited data ingestion. Grafana Cloud offers 10K metric series, 50GB logs, 50GB traces, and 3 users. New Relic offers 100GB of free ingest plus one full platform user. Honeycomb offers 20M events per month.
Is there a free open-source alternative to SigNoz?
Grafana OSS (Loki + Tempo + Mimir) is the closest self-hosted open-source equivalent. For managed free tiers, Middleware offers a 14-day unlimited trial, Grafana Cloud covers 50GB logs and 50GB traces free, and Honeycomb gives 20M events per month with no time limit.
How does SigNoz pricing compare to alternatives?
SigNoz Community Edition is free to self-host but you absorb the infrastructure cost. SigNoz Cloud charges $0.30 per GB. Middleware matches that at $0.30 per GB but adds managed infrastructure and a 14-day unlimited trial. New Relic charges $0.40 per GB plus $349 per full platform user per month. Grafana Cloud is free up to 50GB of logs and traces, then $0.50 per GB. Last9 prices on events rather than GB, which benefits high-cardinality metrics workloads.
How do I migrate from SigNoz to another platform?
If you’re moving to an OTel-native platform like Middleware, Dash0, or Honeycomb, update the OTLP endpoint and API key in your collector config — no re-instrumentation needed. Historical data stays in your ClickHouse instance for the duration of your retention window. Run both in parallel for 48 hours to confirm data parity before cutting over.