
When your web app is live, every click, form submission, and page load shapes the user experience. What matters most is whether users can complete key tasks like signing up, making a purchase, or accessing their dashboard. Broken workflows frustrate users and often lead them to abandon your product.
User journey monitoring ensures these workflows run smoothly from start to finish. Traditional monitoring may miss issues like a JavaScript error blocking checkout, but browser tests catch them before your users do. By simulating real interactions in actual browsers, they reveal problems other methods overlook.
How Digital Experience Monitoring Transforms User Journeys Across Web & Mobile, this ties directly to user journey monitoring and real-user insights.
In this post, you’ll learn how to use Middleware’s browser tests to monitor critical user journeys and resolve issues before they impact your customers.
Common Issues Browser Tests Catch
Browser tests go beyond checking if your site is online. They verify that real-world interactions work as expected.
Some common issues they can uncover include:
- JavaScript Errors: Broken form validations, failed AJAX calls, or console errors that stop user interactions.
- CSS and Layout Issues: Unclickable elements, responsive design problems, or missing/overlapping content.
- Third-Party Integration Failures: Payment processors may timeout, analytics scripts may fail, or chatbots may not load.
- Authentication and Session Issues: Login flows being broken, session expirations, or incorrect permission errors.
- Performance Issues: Long-loading pages or timeout on significant action.
- Cross-Browser Compatibility: Features that operate on one browser but don’t work on another.
What Is Real User Monitoring (RUM)?” helps expand on RUM overview and its relevance alongside browser testing.
Monitoring User Journeys with Middleware
Middleware’s browser tests are designed to replicate the exact steps a real user would take in your application. You define the journey, such as signing up, logging in, or completing a purchase, and Middleware runs it automatically at set intervals. Each test is performed in an actual browser environment, so it captures issues that basic uptime checks or API monitoring might miss.
In the event of a failed step, Middleware will provide actionable information, including screenshots, detailed logs, and error messages, to help you quickly identify what went wrong. This helps you identify and resolve issues before they affect clients.
Key Features of Middleware’s Browser Tests
- Run tests from global locations to verify performance for all users.
- Add assertions to confirm that key elements or text appear as expected
- Check cross-browser and device Compatibility
- Use proactive monitoring to detect problems before users do
- Create tests without coding for faster setup
- Review video recordings of each run for visual debugging
Once you’ve chosen which user journeys you want to monitor, it’s time to configure your first browser test.
Middleware’s browser tests are a type of synthetic monitoring. If you’d like to learn more about this, read our post on Synthetic Testing .
Configuring Browser Tests in Middleware
Writing a browser test in Middleware is simple, and the best thing is that you don’t need to write even a single line of code.
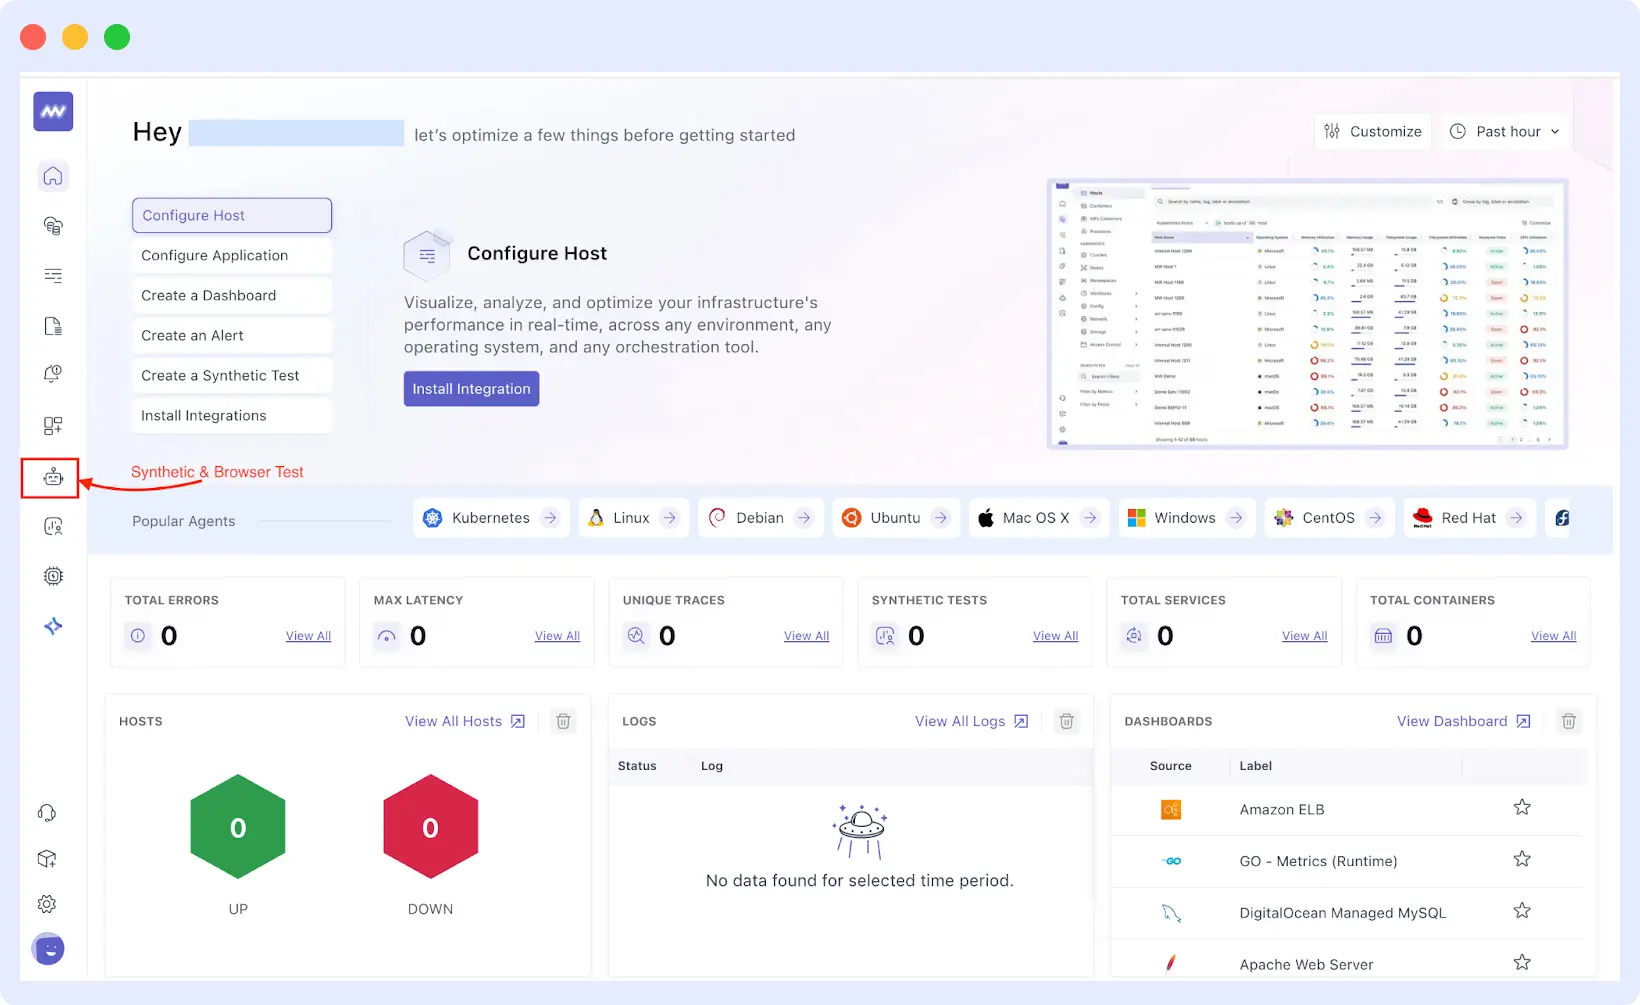
Step 1: Access Your Dashboard
Head over to your Middleware dashboard and sign in. If you’re new and don’t have an account yet, go sign up and follow the first-time setup. Since you’re a new user, you receive all of the features for free.
Step 2: Go to Browser Tests
From the main dashboard, navigate to the left-hand navigation panel and click on Synthetic & Browser Test. This will direct you to the browser tests tab.
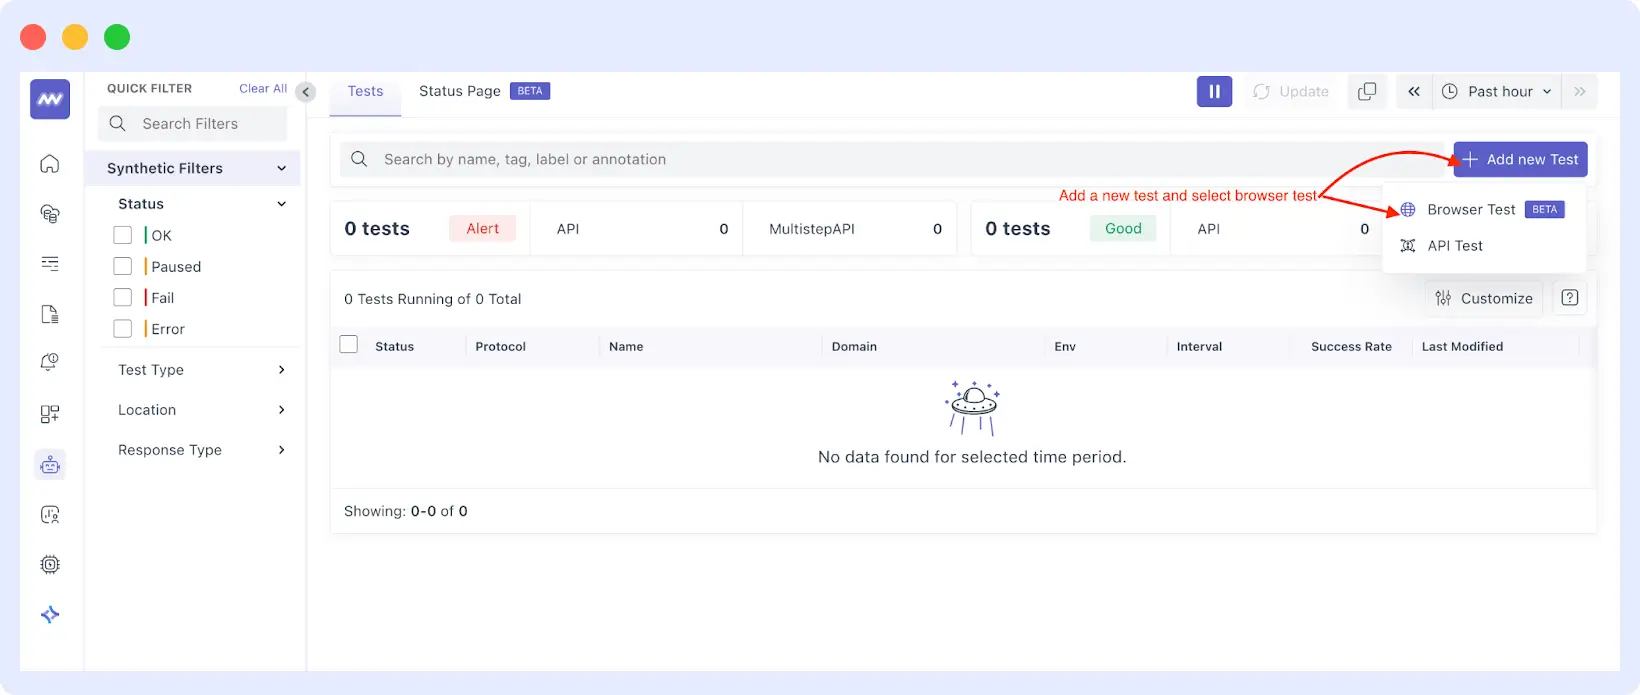
Step 3: Make a New Test
Once you’re in the dashboard of the browser tests, click on the top-right + Add new test button. That will drop down a dropdown list. Choose Browser Test and you’ll be taken into building your user journey.
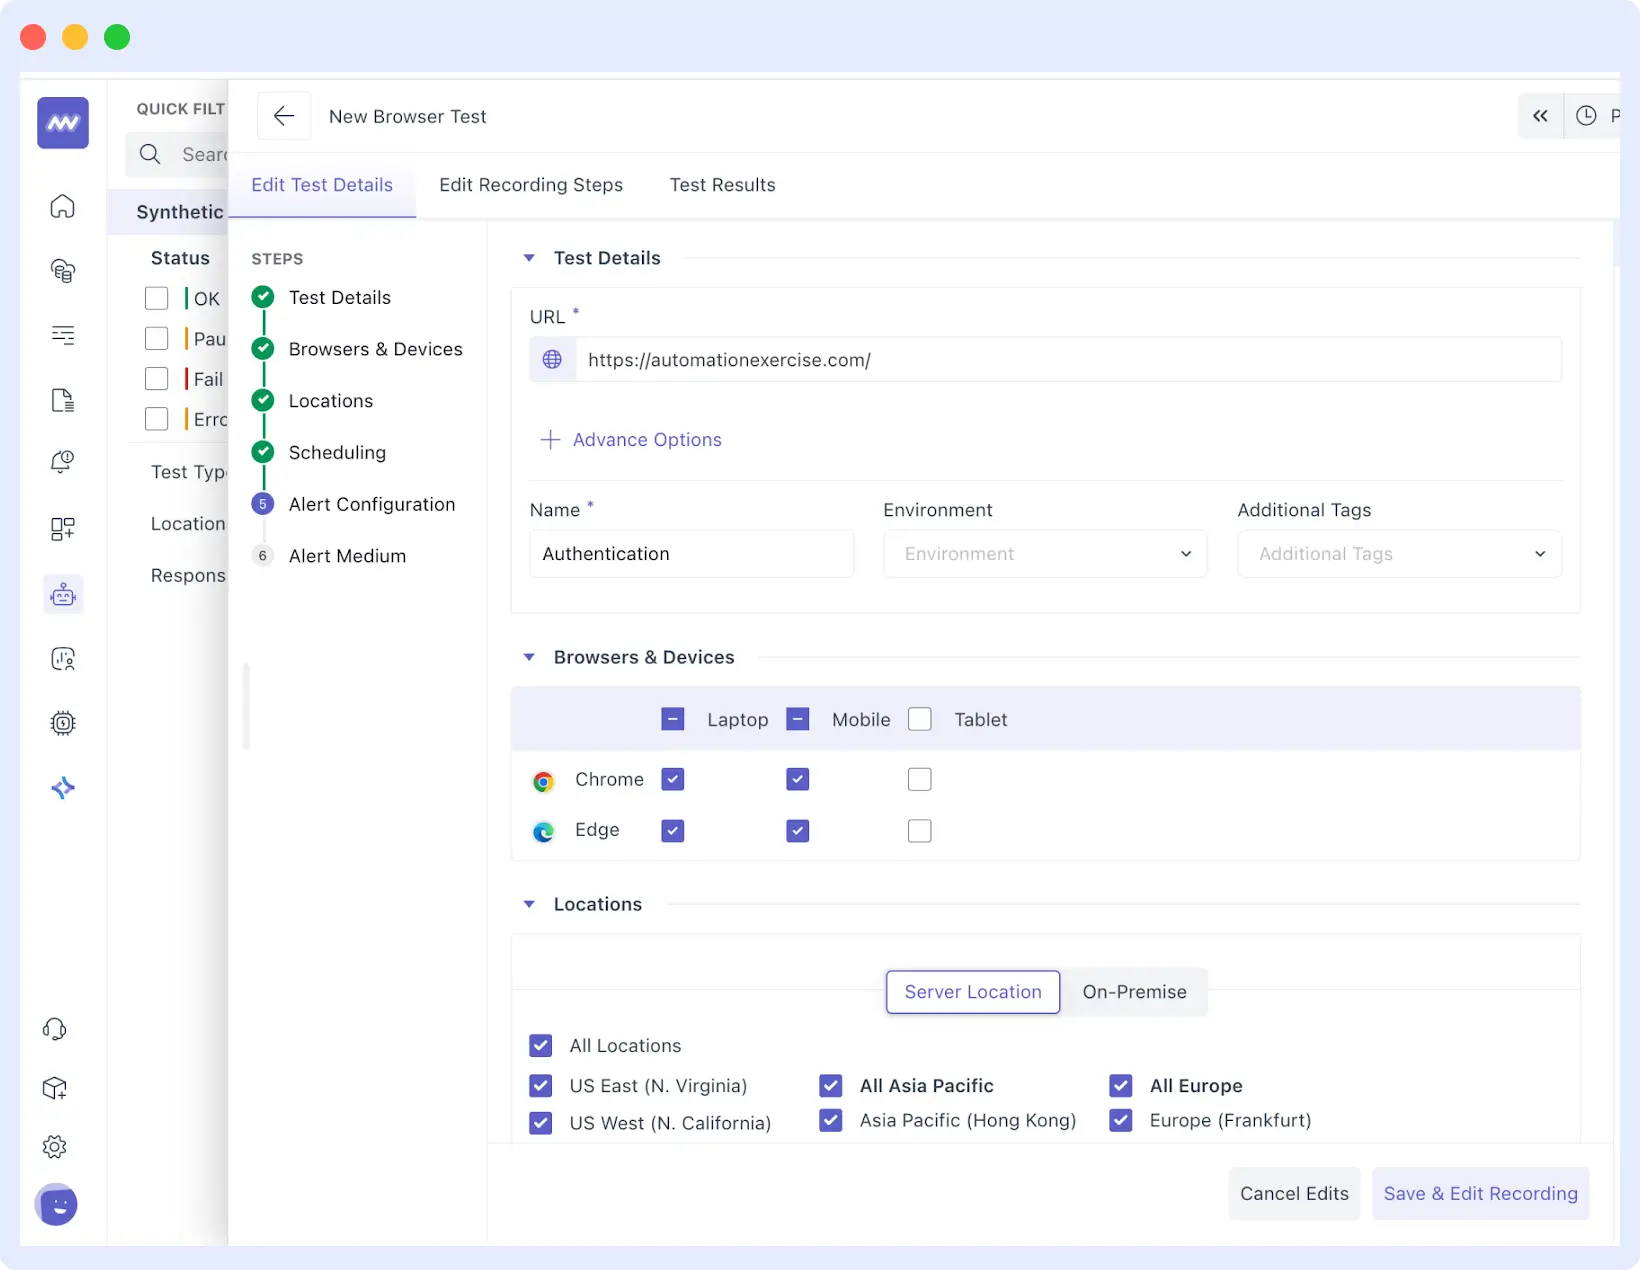
Step 4: Configure Your Test Details
Here’s where you set up the specifics of your test:
- Test Details: Enter a descriptive name for your monitor and add the URL you want to monitor.
- Advanced Options: Here you can find more settings, including:
- Request Options: Specify request-specific custom headers, body data and more.
- Authentication: securely store access tokens, such as passwords or API keys, to perform an authenticated user journey test.
- Privacy: Decide whether to have screenshots in your test results (useful when it comes to sensitive data).
- Time and Language: Add the timezone and the language you want to set as the test environment.
- Browser & Devices: Choose from a range of browsers, including Chrome and Safari, and emulate laptops, mobiles, or tablets.
- Location: select where you want your server to run the test, on-premises or global.
- Scheduling: Set the frequency of the test being run. This can be pre-defined at a certain interval (e.g., every 5 minutes, every hour).
- Alert Configuration and Medium: The method for alerting you about failures should be defined. They can be Slack, email, OpsGenie, Teams, PagerDuty, and webhooks.
Get started with Middleware’s browser tests today and ensure your users enjoy a seamless experience. Start Your Free Trial Now.
Once you have finished, click Save and Edit Record to advance to the recording step.
Step 5: Installing the Middleware Test Recorder Extension
On the record page, click the Record button to begin recording the test steps. If you’re new to recording, you will be asked to install the Middleware Test Recorder Extension. Take the onscreen prompts and add it to your web browser; the extension must be installed to record your clicking, typing, and navigation movements on the test.
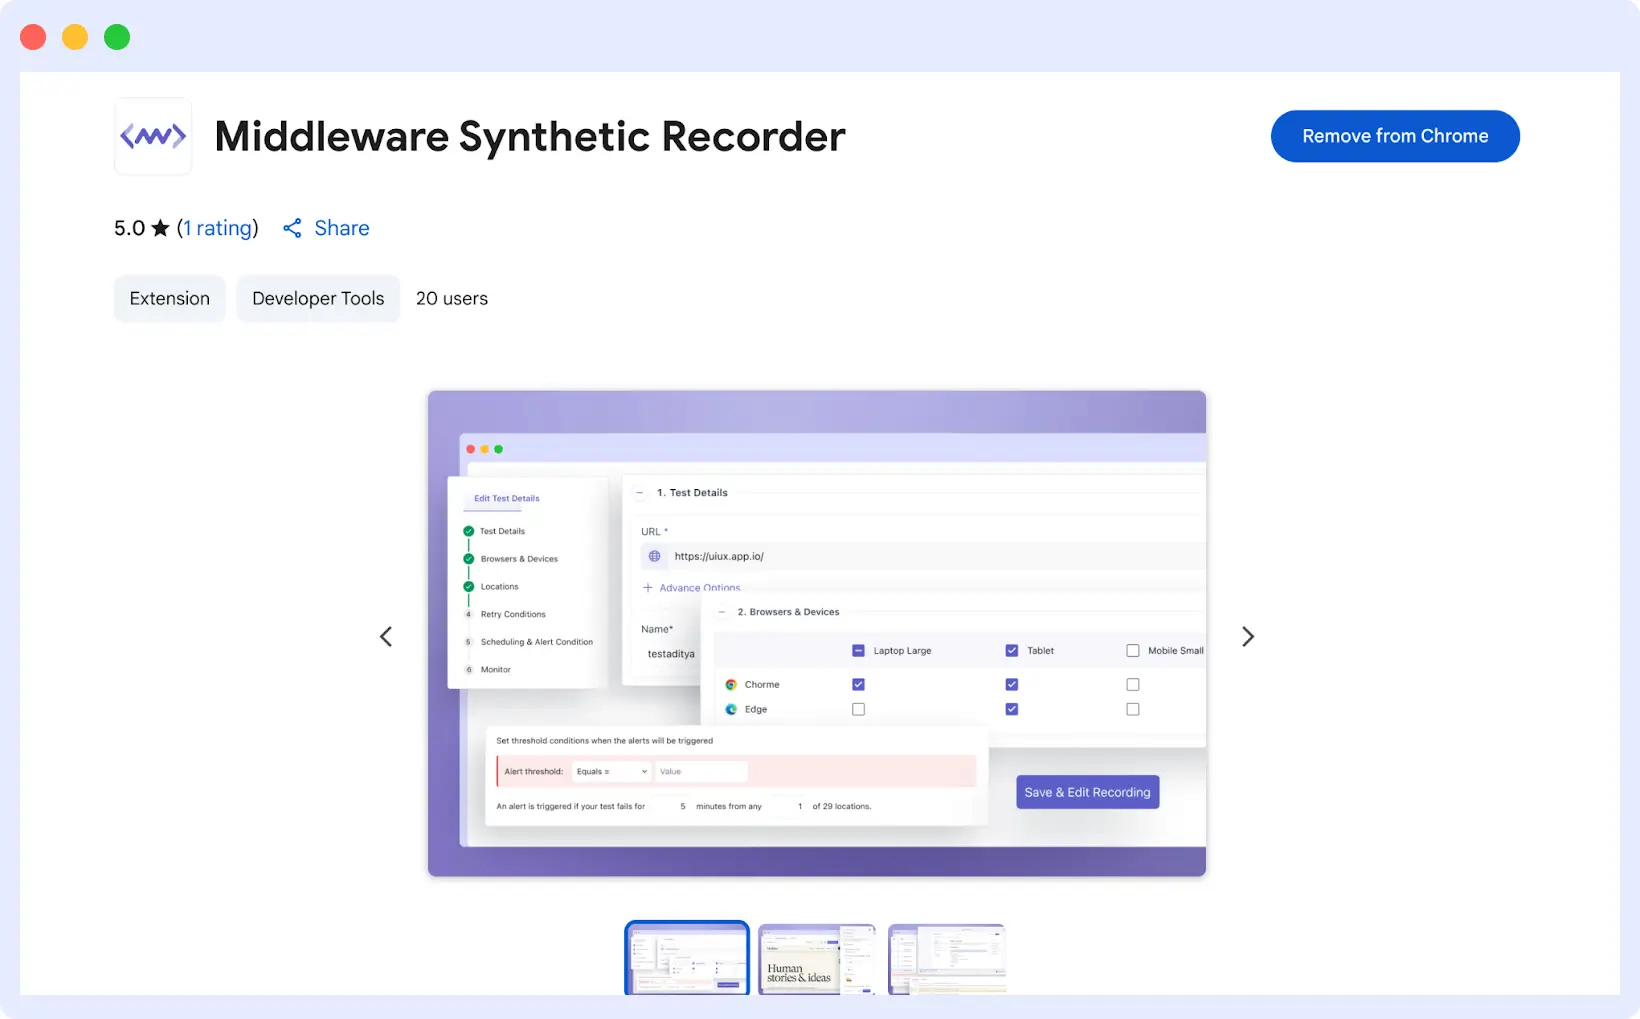
📥 Install the extension, hit record, and capture every click, type, and navigation to build flawless browser tests.
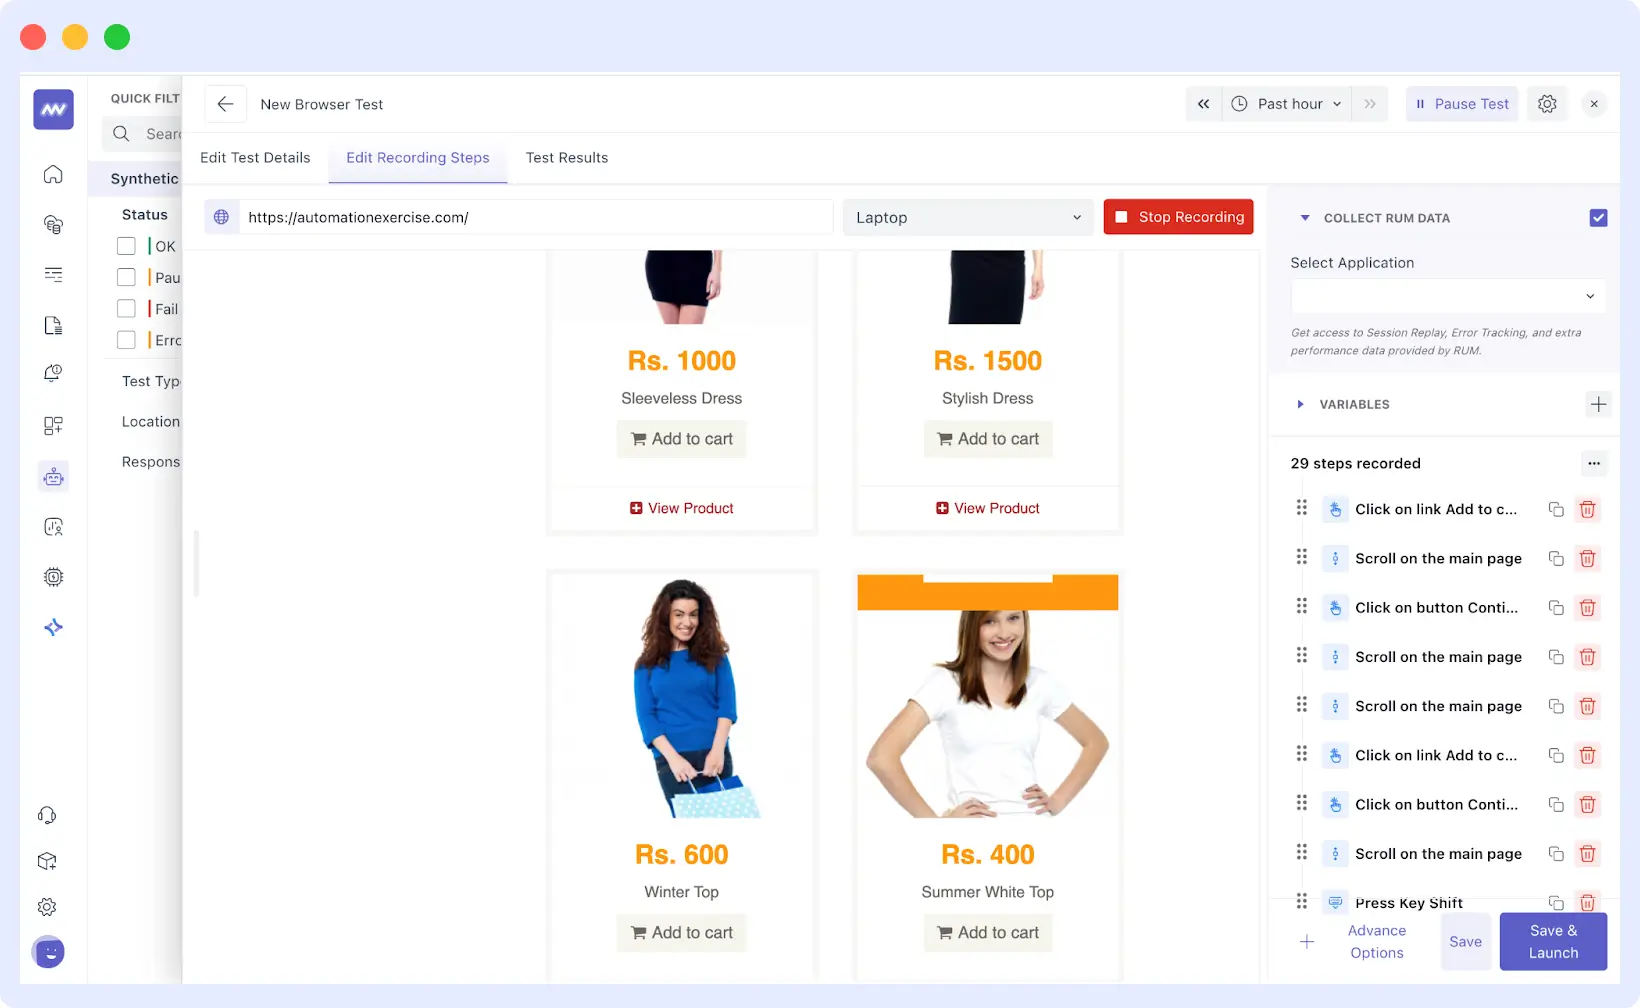
Step 6: Record Your User Journey
After you have installed the extension, you’re all set and good to go for your user session. On the record page, you’ll find a right-side panel where all the steps you’ve recorded so far will be displayed.
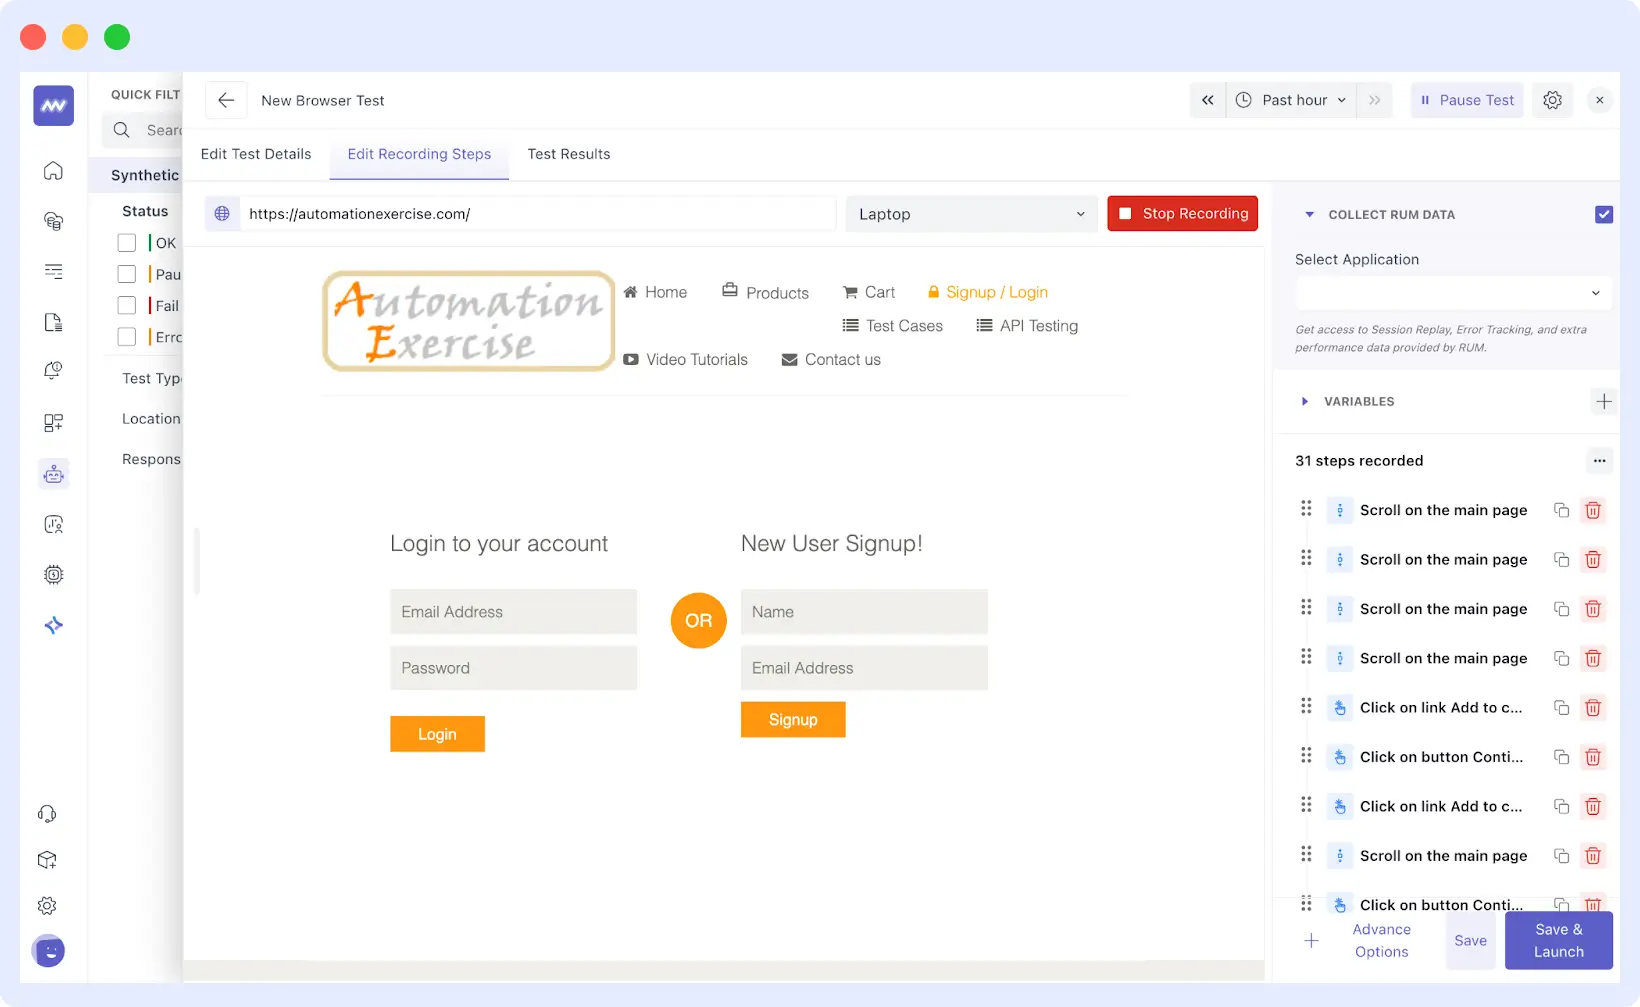
Execute the steps you want to record, e.g., entering a login form as demonstrated in the above screenshot.
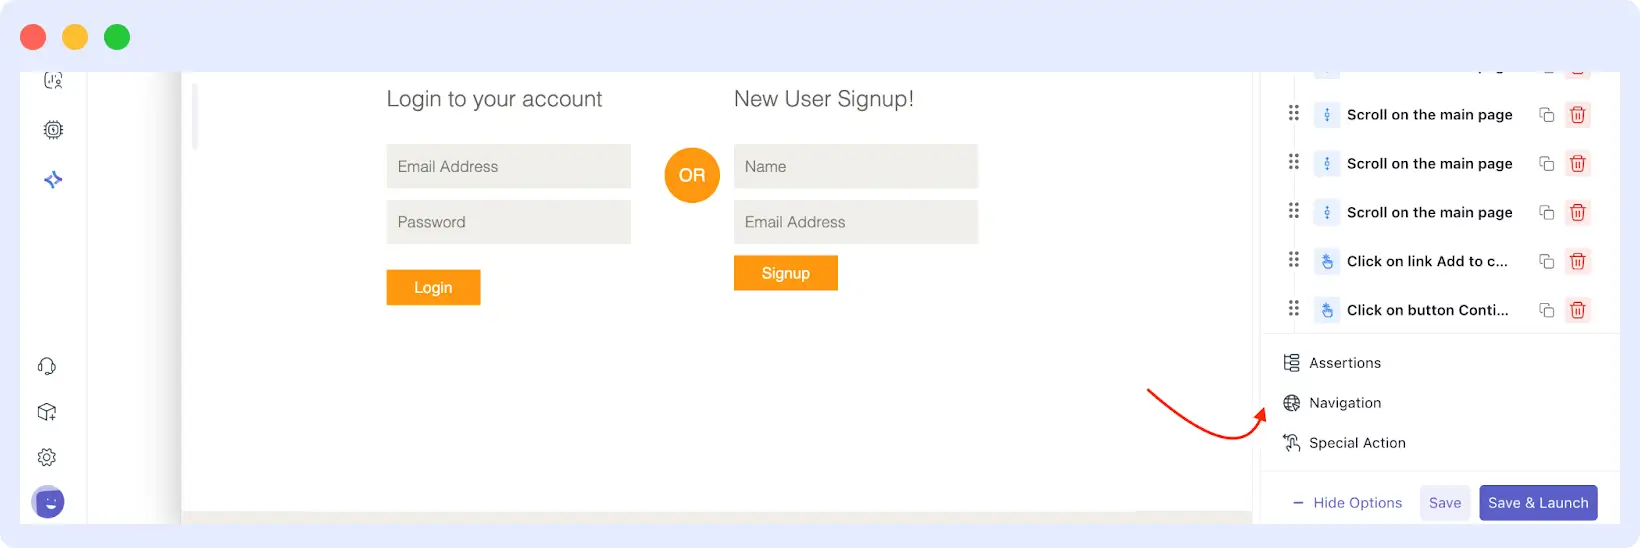
Step 7: Use Advanced Options
Then you can apply the advanced options available at the bottom of the right-hand panel to augment your test. These options are:
- Assertions: Check that certain text or items exist on the page.
- Navigation: Introduce advanced navigation steps that involve navigating to a specific URL or navigating back within the browser history.
- Special Actions: Incorporate special actions into your test, such as waiting until something loads or clicking on a particular key.
Once you’ve completed recording and entered any advanced settings, select Save and Launch and execute your test for the first time.
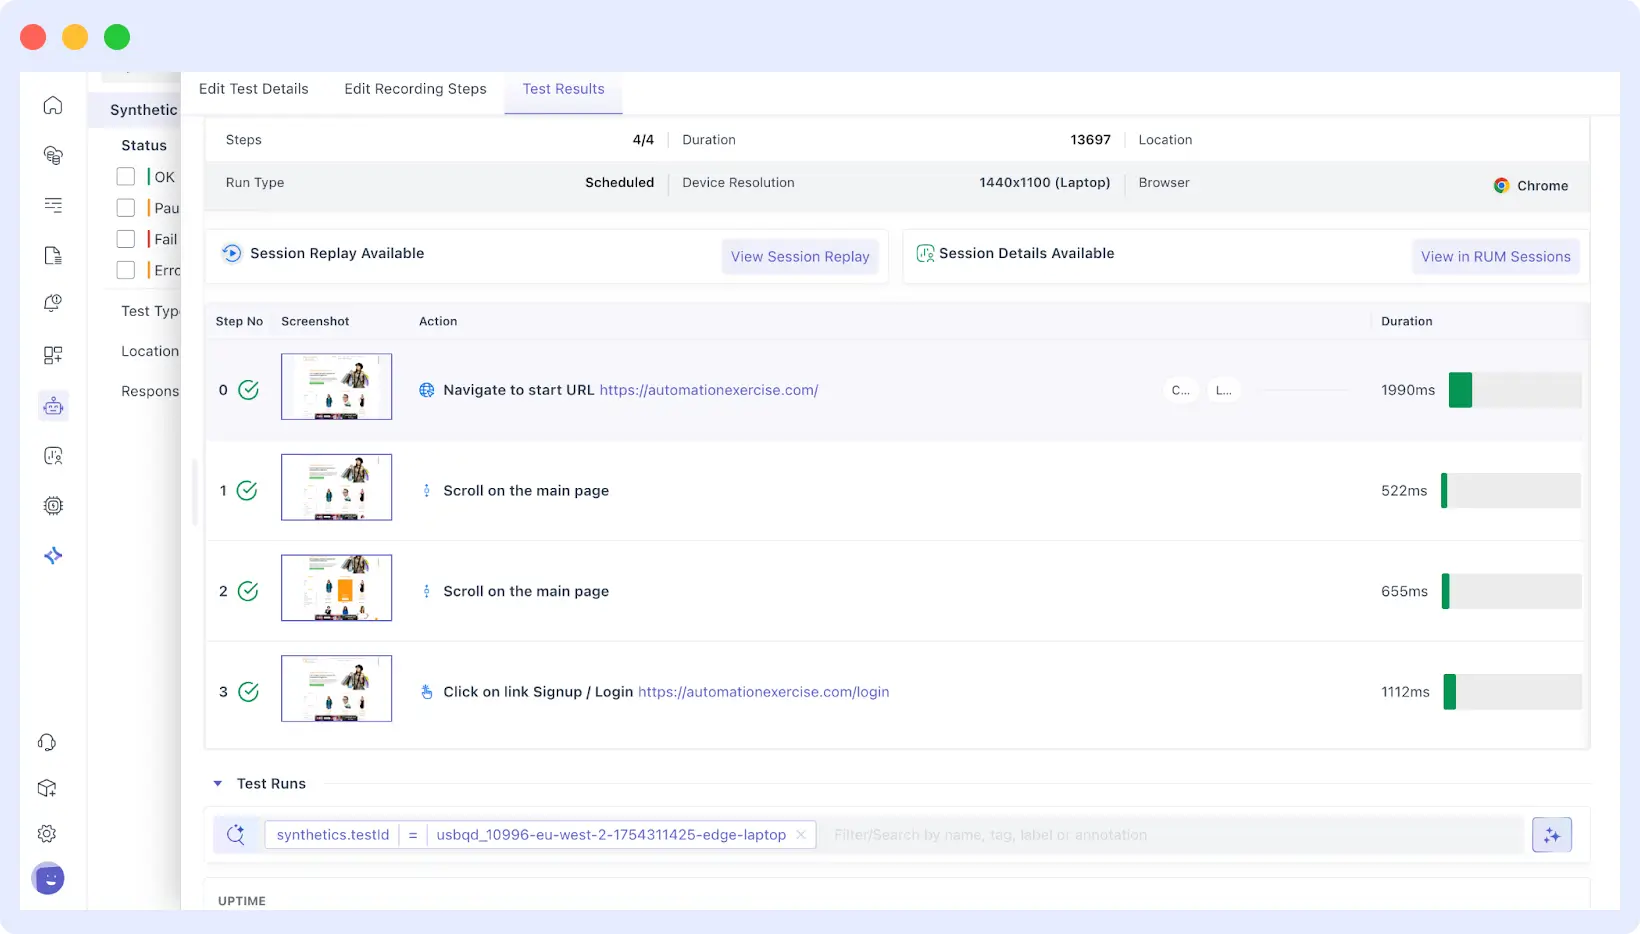
Step 8: View and Debug Test Results
Once you finish recording and save your test, Middleware takes you to the Test Results Dashboard. This is where you’ll see how your user journey is performing.
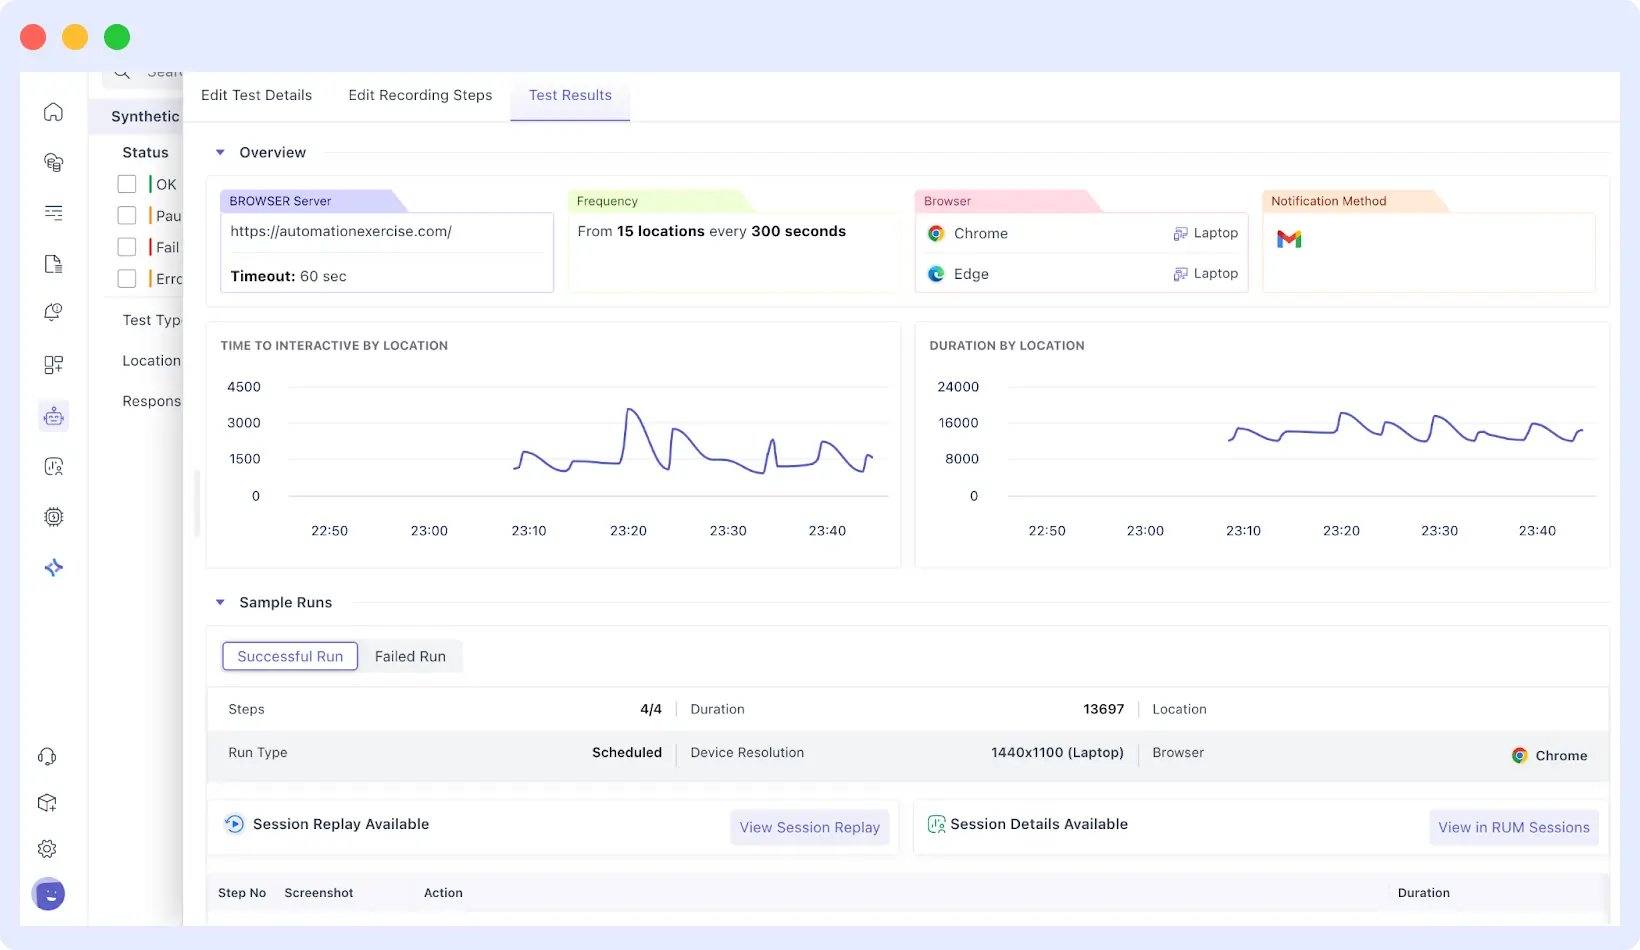
The uptime logs will allow you to make sure when each of the runs passed or failed, and you can view screenshots of each of the steps to make sure all the interactions were working as intended.
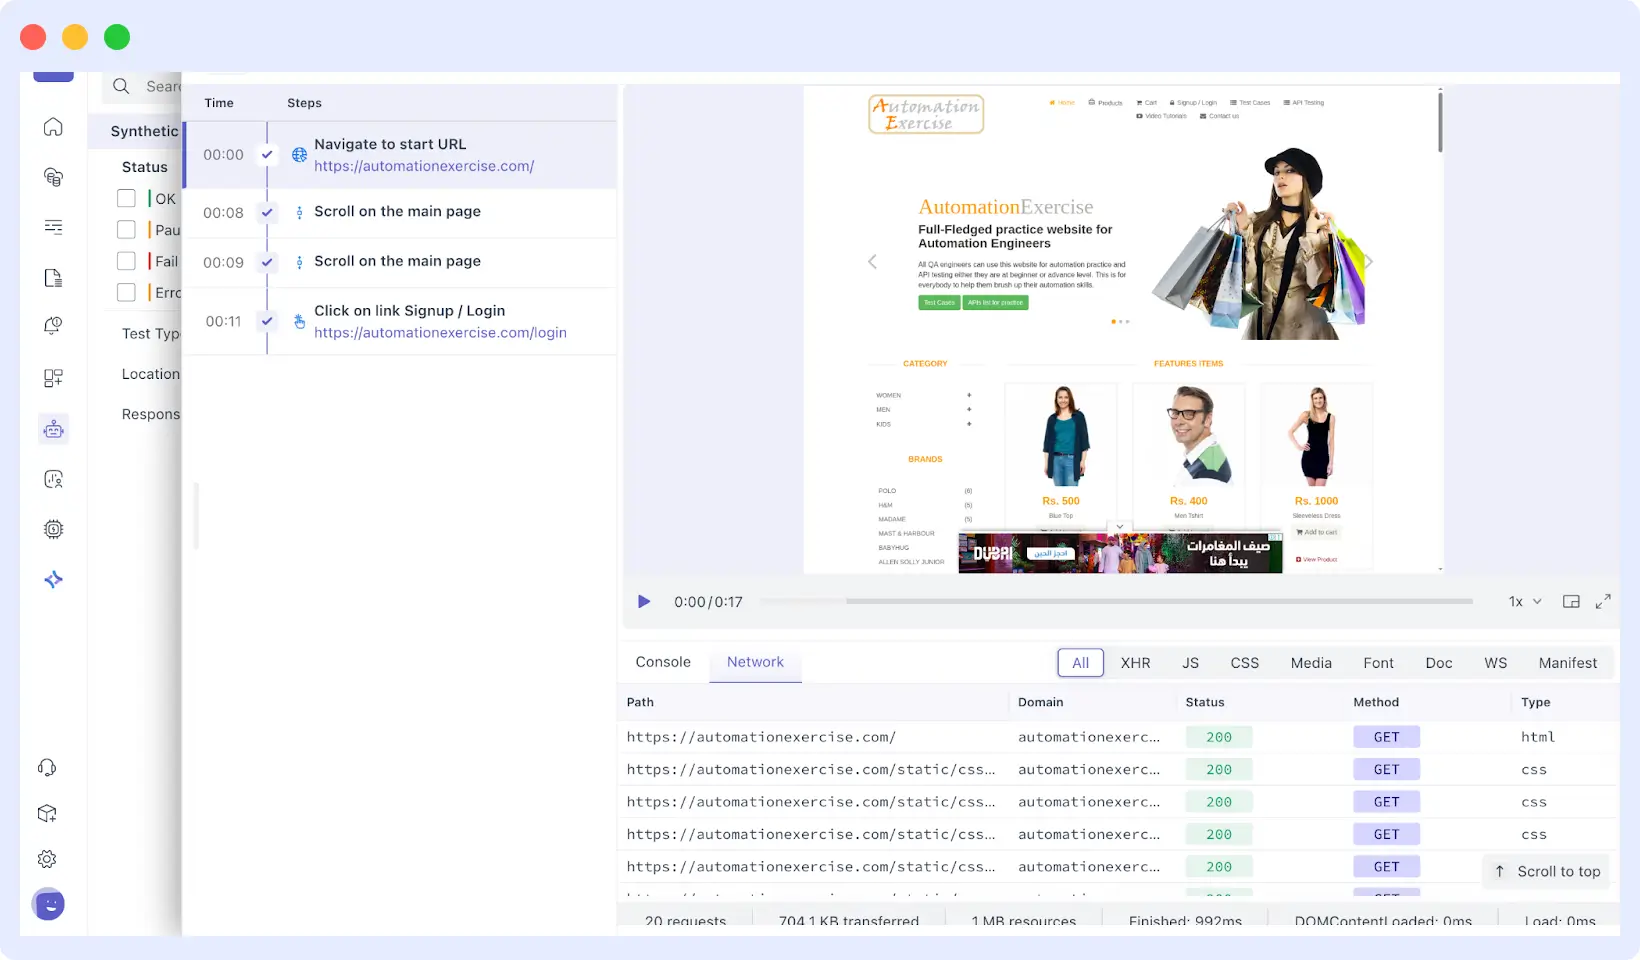
To get more in-depth debugging, you can record the entire video of the test, and it will be clear what transpired in any step.
The console and network logs are also taken by middleware as it runs, so you can debug JavaScript errors, unresponsive requests, and other subtle problems occurring behind the scenes that might be impacting the user experience.
Middleware’s browser tests help you ensure critical user journeys, like signups, logins, and purchases, work seamlessly, reducing user frustration and improving reliability.
By simulating real user interactions in actual browser environments, you can catch JavaScript errors, layout issues, and performance bottlenecks before they impact your customers.
To learn more about setting up browser tests or exploring advanced features, check the Middleware documentation. New users can try a free sign-up to explore browser testing and other features.
FAQs
What Is User Journey Monitoring?
User journey monitoring tracks and analyzes how users complete specific tasks in a web application, ensuring workflows like signups or purchases function without errors or performance issues.
What Are Browser Tests?
Browser tests are automated scripts that simulate user interactions (e.g., clicking links, submitting forms) in real browser environments to verify functionality, performance, and user experience.
How Do Browser Tests Differ from Manual QA Testing?
Manual QA testing involves human testers validating new features or user experience, typically during development. Browser tests are automated, running 24/7 in production to monitor key user journeys, ensuring ongoing stability.
For example, manual QA might test a new login feature, while browser tests continuously verify the login flow works for all users. Both are complementary for a robust testing strategy.
What Is the Difference Between Browser Tests and Real User Monitoring (RUM)?
Browser tests (a form of synthetic monitoring) use automated scripts to simulate user journeys in controlled environments, proactively catching issues from specific browsers or locations.
RUM passively collects data from real users as they interact with your app, reporting issues they encounter. Browser tests prevent issues; RUM reveals real-world user experiences.
What Happens If a Browser Test Fails?
Middleware sends an immediate alert via your chosen channel (e.g., Slack, email). The Test Results Dashboard provides a detailed report with screenshots, video recordings, network request waterfall charts, and logs to pinpoint the issue, such as a failed API call or JavaScript error.
What Is the Difference Between Synthetic Monitoring and Browser Testing?
Synthetic monitoring is a broad term for automated performance tests, including API checks or uptime pings. Browser testing, a type of synthetic monitoring, uses real browsers to simulate complete user journeys, capturing issues like rendering errors or slow page loads.
Which Browsers and Devices Can I Test On?
Middleware supports browser tests on Chrome and Edge, with options to emulate various devices (e.g., desktop, mobile, tablet) and screen resolutions to ensure compatibility across user environments.
Can I Simulate User Journeys That Require Login Credentials?
Yes, Middleware securely stores credentials in a vault or via environment variables, allowing tests to authenticate and monitor protected areas of your app, such as user dashboards, without exposing sensitive data.
📚 Also Read:
- 🔍 How to Monitor Real User Experience with RUM (Real User Monitoring)
- ⚡ Synthetic Monitoring vs. Real User Monitoring: Key Differences
- 🖥️ What is Frontend Monitoring? Learn Concepts, Best Practices, & Tools
- 👉 How Log Patterns Help You Debug Faster and Monitor Smarter


