OpenTelemetry and Prometheus are two of the widely used tools in the observability space. They are both seen as competitors, as these tools address different parts of the telemetry stack. While Prometheus is a powerful time series database focused mainly on metrics collection and alerting, Opentelemetry provides a unified framework for collecting traces, metrics, and logs.
Choosing between these tools, or using a combination of them, depends on your observability goals. This article compares OpenTelemetry vs Prometheus, examining their architectures, strengths, and limitations to help you make an informed decision for your cloud-native or on-prem system.
What is OpenTelemetry?
OpenTelemetry excels in generating, collecting, and exporting telemetry data, including metrics, traces, and logs. The primary goal of OpenTelemetry is Standardization, i.e., it provides a set of APIs and SDKs across different languages and platforms, allowing developers to configure the code once and send observability data to any destination.
What is Prometheus?
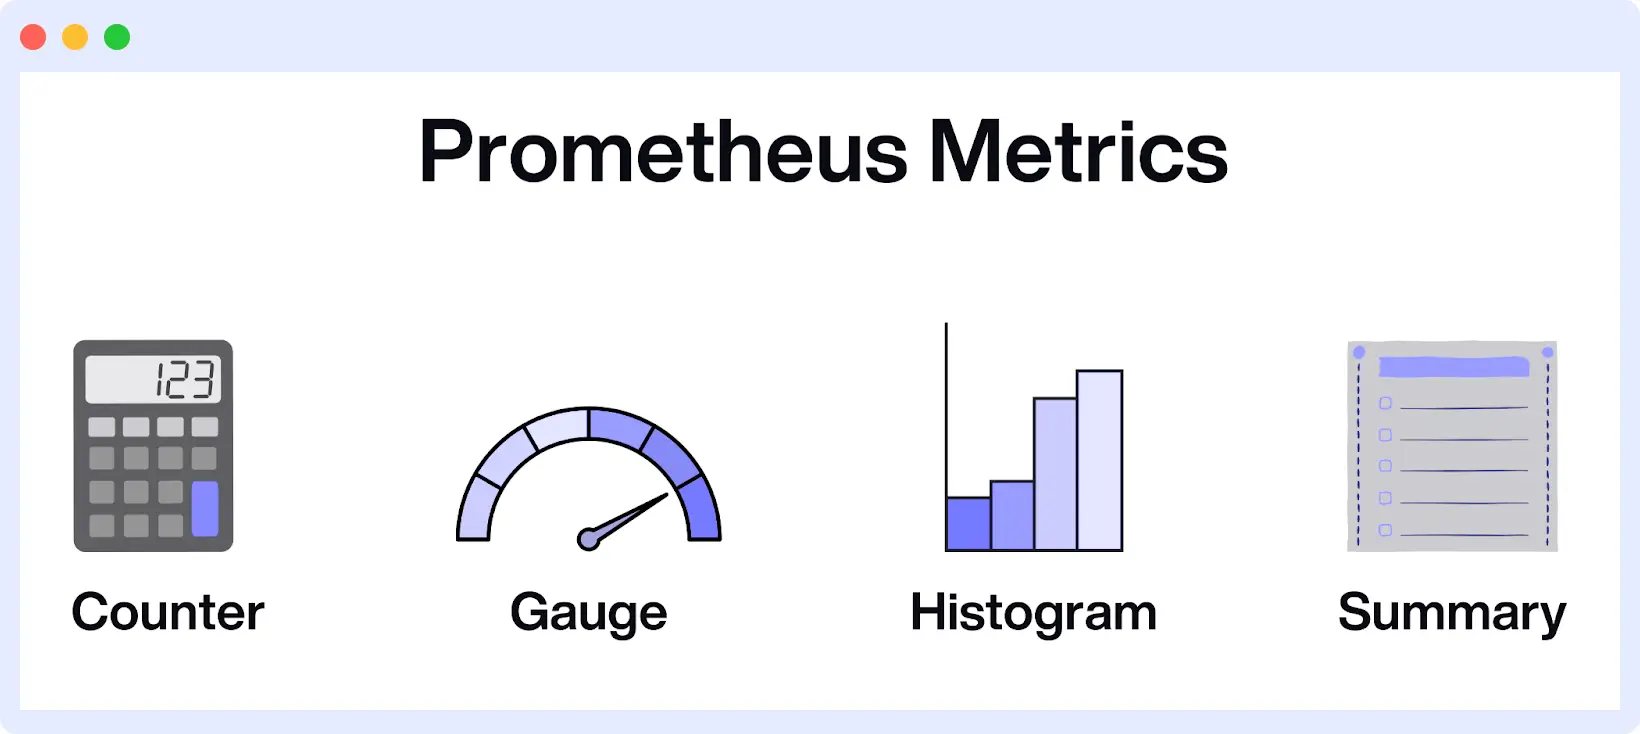
Prometheus is a widely used time-series-based monitoring system that is built explicitly for metrics. Prometheus’s most prominent feature is its time-series database coupled with PromQL (query language) that allows the real-time analysis of application and infrastructure performance.
It is a complete package as it comes with the data collection mechanism, its own data storage, query language, visualization, and alerting features.
OpenTelemetry Vs Prometheus: Feature Comparison
To evaluate OpenTelemetry Vs Prometheus, you need to compare them on various technical dimensions. Let’s check a feature-by-feature comparison of these tools to highlight their core strengths and trade-offs.
| Feature | Prometheus | OpenTelemetry |
|---|---|---|
| Metrics Collection | Pull-based, efficient in stable environments | Supports both pull & push via Collector |
| Data Types | Only metrics | Metrics, traces, logs (all-in-one) |
| Instrumentation | Manual wiring via client libraries | Auto-instrumentation + vendor-agnostic APIs |
| Export & Interop | Local TSDB + remote-write support | OTLP to any backend via Collector |
| Ecosystem | Highly mature, large adoption | Rapidly growing with strong vendor support |
| Alerting & UI | Built-in (Alertmanager + Grafana) | Depends on backend tooling |
| Querying | PromQL (powerful for time-series) | Backend-dependent |
Metrics Collection
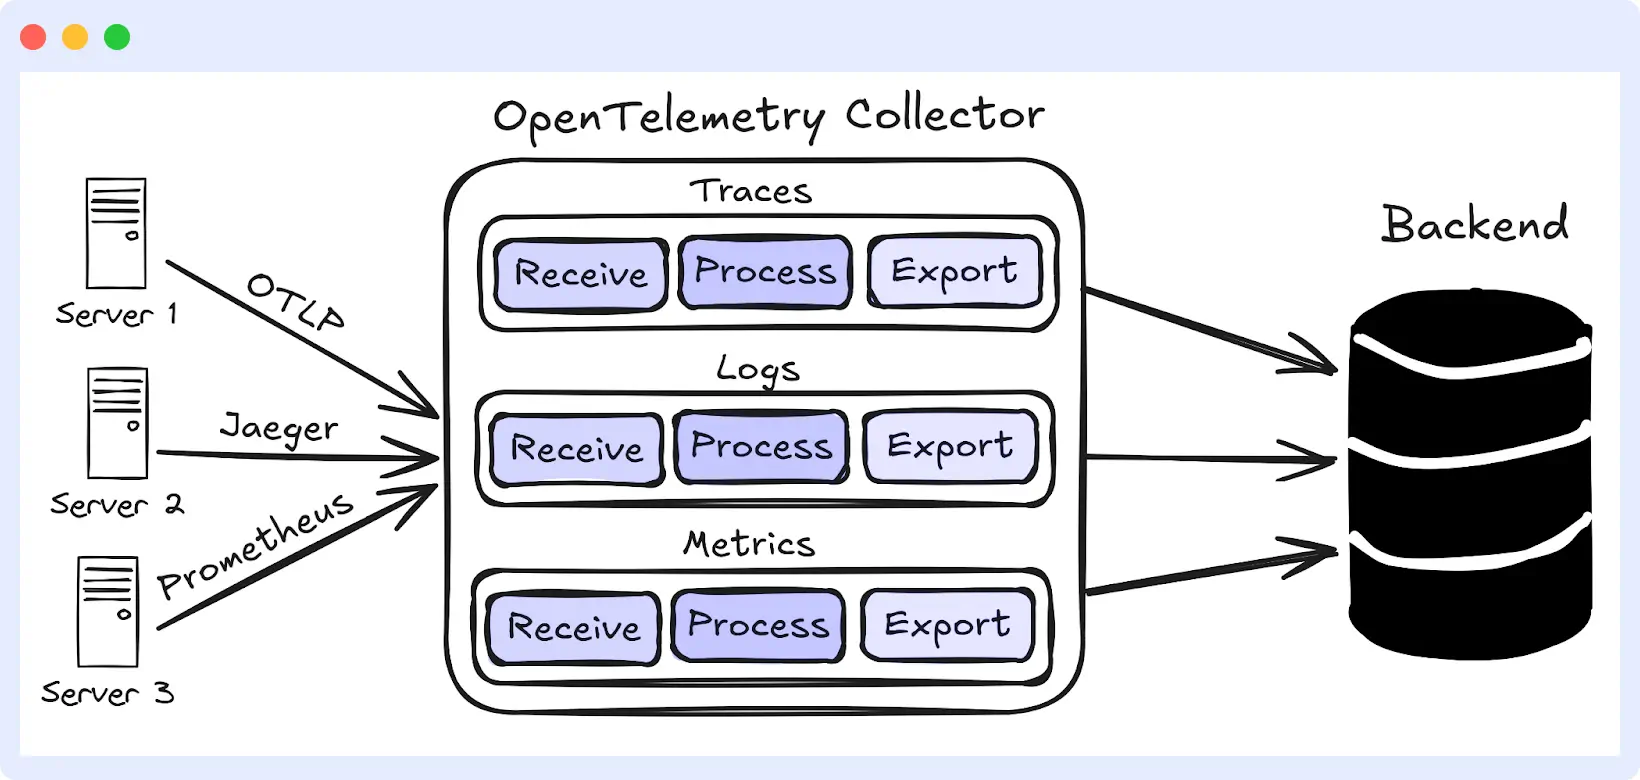
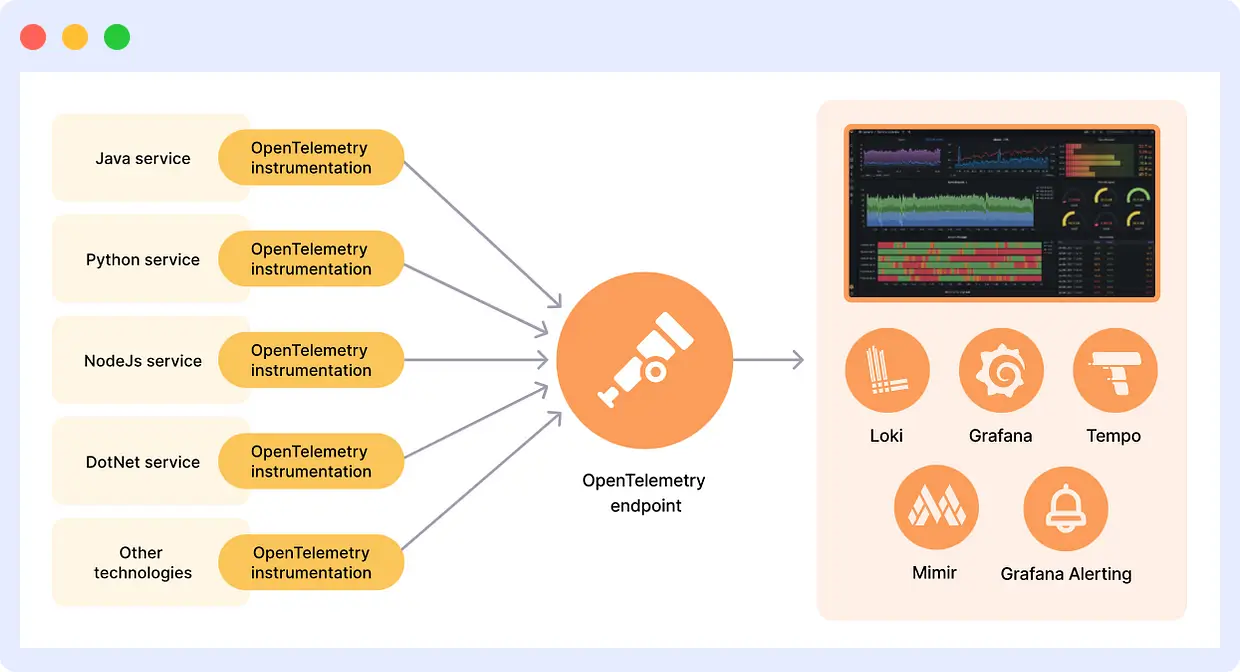
OpenTelemetry, on the other hand, supports both pull-based and push-based collection models and uses the OpenTelemetry collector to process and forward the data. It provides different APIs and SDKs in various programming languages to support in-process instrumentation of applications.
Moreover, it supports the export of data using various protocols, including OLAP, HTTP, and gRPC, to multiple backends. These are the few reasons why OpenTelemetry is highly suitable for dynamic cloud native environments, including serverless functions and ephemeral workloads.
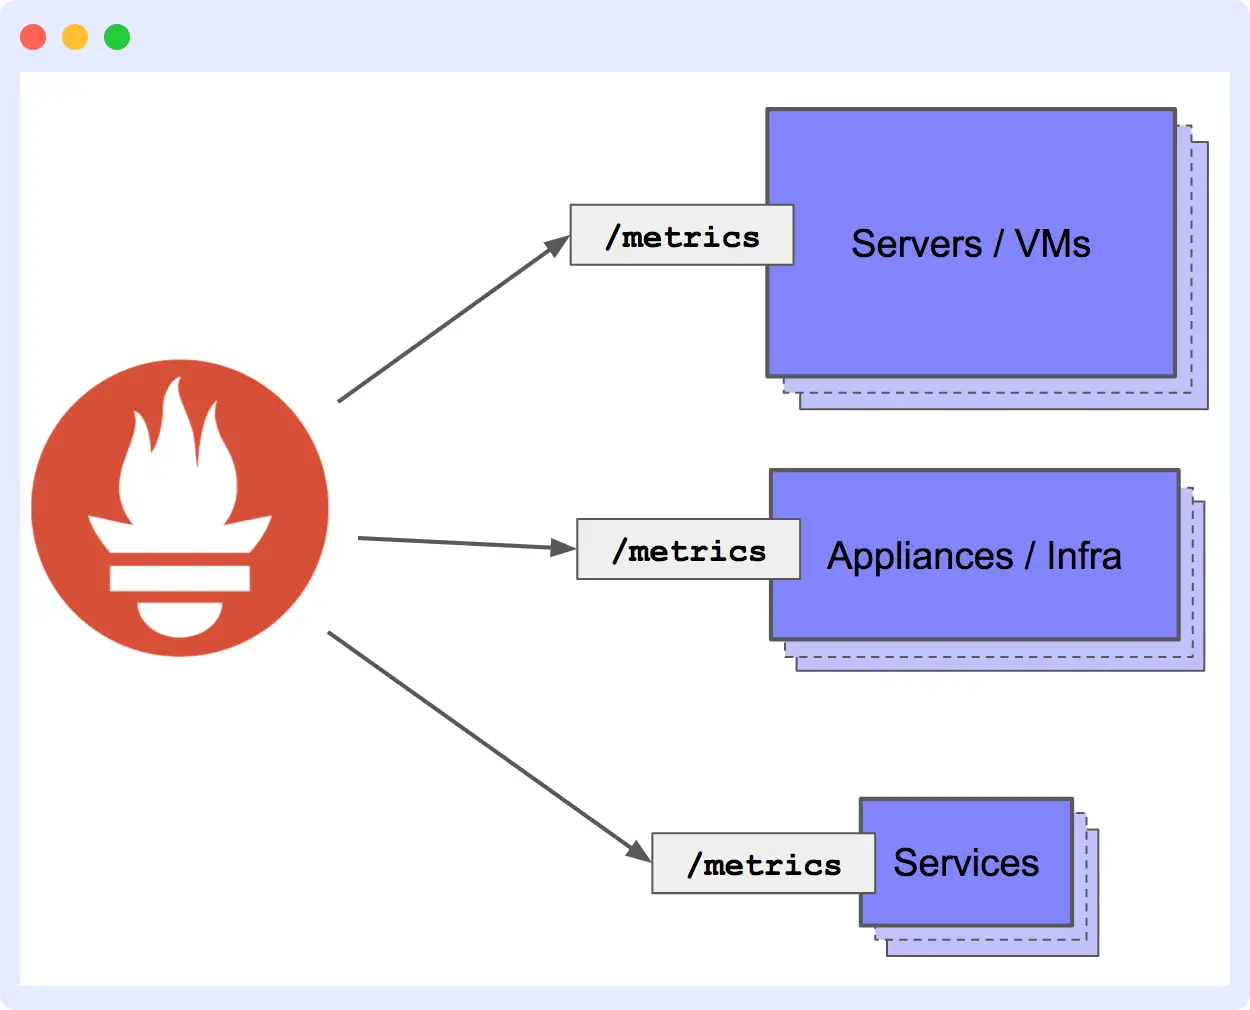
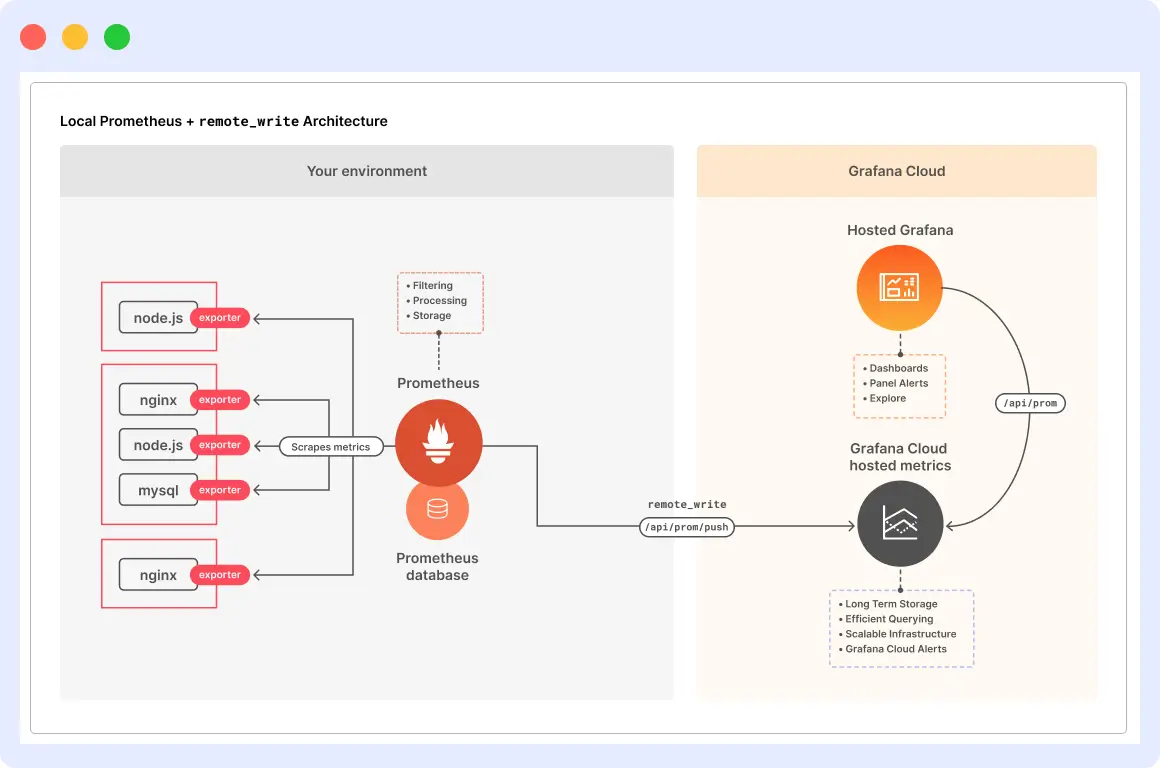
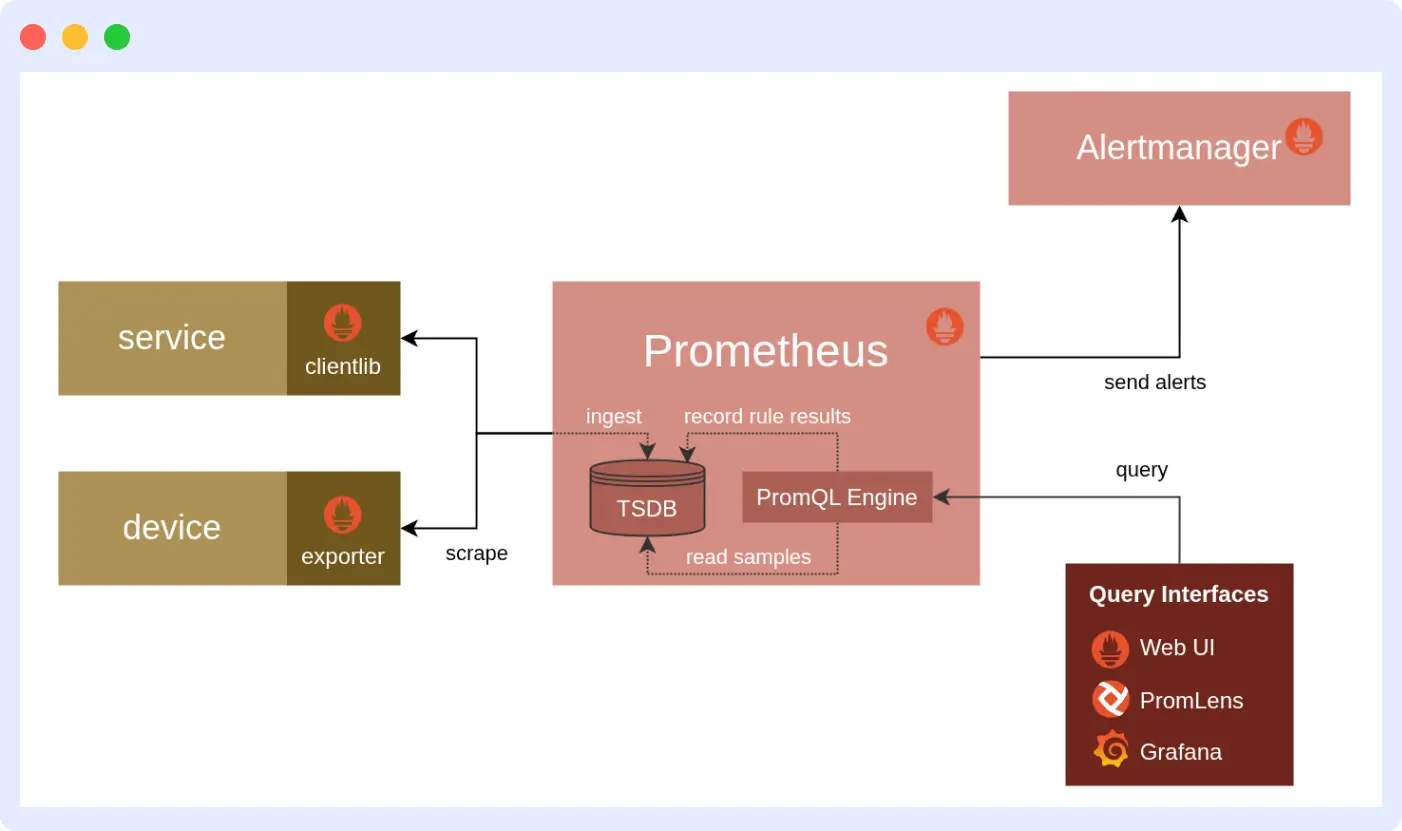
Prometheus uses a pull-based method to scrape metrics at regular intervals from the configured endpoints (targets). These target systems often expose metrics in a text-based format through different exporters, e.g., Node Exporter for host metrics, cAdvisor for container metrics.
Here’s a step-by-step guide to visualizing Prometheus metrics effectively using dashboards and tools.
Prometheus’s design is highly efficient for the stable and long-running infrastructure and services.
Verdict: OpenTelemetry is better suited for modern, dynamic cloud-native environments, while Prometheus remains ideal for stable, long-running systems.
Let Middleware auto-collect and visualize Prometheus metrics. Start Trial Now
Data Types Supported
OpenTelemetry supports all types of telemetry signals, such as traces, logs, and metrics, which makes it a complete observability solution. These three signals provide a holistic view of application and system behaviour that cannot be provided solely by metrics.
Prometheus is solely focused on metrics, that too, time series metrics. It does not provide support for traces and logs. But if you need them specifically, they can be integrated with the complementary tools like Jaeger and Loki. Both of these tools support a variety of metrics that can help you monitor the system health easily.
Verdict: OpenTelemetry is obviously the superior choice for organizations seeking comprehensive observability since it natively supports traces, logs, and metrics.
Instrumentation
OpenTelemetry provides a vendor-agnostic API for instrumentation. So, developers need to write code once to generate the telemetry data, which can then be exported to any OpenTelemetry-compatible backend.
It provides auto-instrumentation agents for popular languages and frameworks that reduce the need for manual code changes. These features make it easy to get started with OpenTelemetry while having consistency across services.
Prometheus is a lot different in this case; it entirely depends on client libraries for manual instrumentation. While these client libraries provide complete control to developers, they require more effort and consistency to maintain instrumentation across different services.
For the systems that do not natively expose Prometheus metrics, exporters are used as intermediaries to translate the metrics into Prometheus format.
Verdict: OpenTelemetry is more developer-friendly than Prometheus due to its vendor-agnostic API and auto-instrumentation features.
Data Export & Interoperability
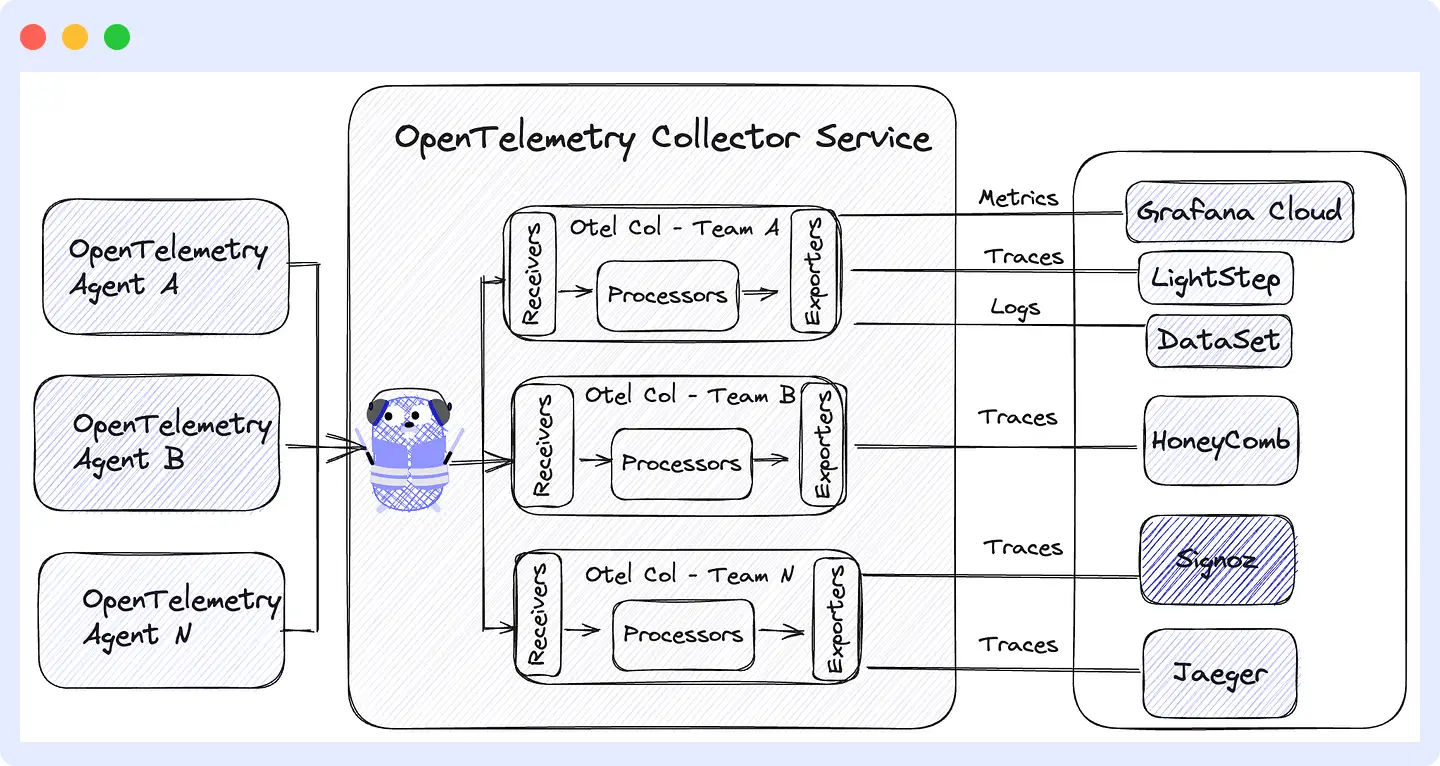
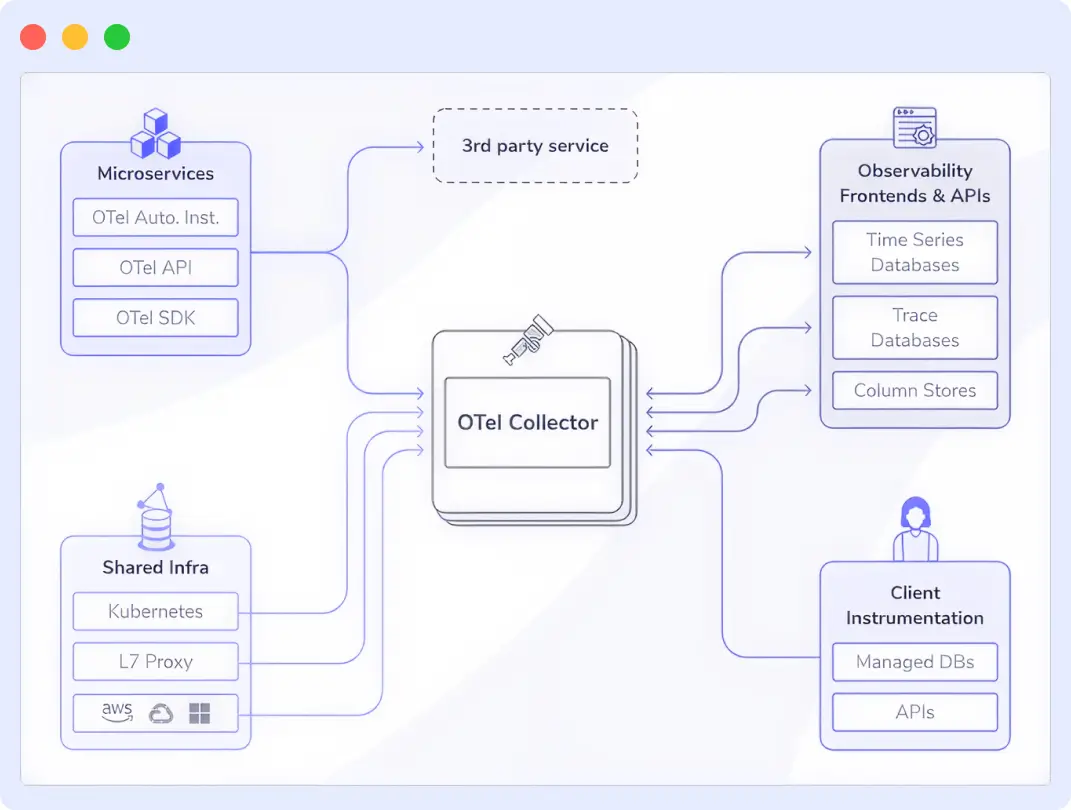
Being vendor-agnostic in design is one of the biggest strengths of OpenTelemetry. The primary output of OpenTelemetry is the OpenTelemetry Protocol (OTLP) that can be sent to a wide variety of observability backends. These include Prometheus, Jaeger, Zipkin, Tempo, and many commercial observability platforms.
OpenTelemetry collector works as a central processing pipeline. It performs the transformation, filtering, and routing of the telemetry data to different locations simultaneously. This is why it is widely popular among teams that want to avoid vendor lock-in.
Prometheus, on the other hand, stores all the metrics in a local time-series database (TSDB). It supports remote-write capabilities for long-term storage and integration with other systems. This feature enables you to send metrics to compatible remote storage solutions, such as Thanos, Cortex, VictoriaMetrics, etc.
Verdict: OpenTelemetry is preferred in this case due to its vendor-agnostic nature and ability to avoid vendor lock-in.
For more information Middleware’s Prometheus integration, click here.
Ecosystem & Community
OpenTelemetry and Prometheus are both Cloud Native Computing Foundation (CNCF) graduated projects, which highlights their maturity and widespread adoption.
Prometheus has been around for quite a long time now. This is why it has become a little more mature and popular, especially within the Kubernetes and DevOps communities.
It has a rich collection of exporters for various technologies, a robust alerting system, and provides seamless integration with Grafana for appealing visualizations of metrics. It also offers extensive documentation, a highly active community, and a proven track record in production environments.
OpenTelemetry, on the other hand, is growing rapidly and has an active community. One of the key things about OpenTelemetry is that it has strong backing from major cloud providers and observability vendors. At this stage, it is increasingly seen as the industry standard for unified observability.
Verdict: Prometheus is a clear winner here as it is considered a gold standard due to its maturity and production-ready monitoring.
Alerting and Visualization
OpenTelemetry does not natively provide any alerting or visualization features. But this functionality can be explicitly added to the observability backend, where the telemetry data is actually stored. This is a more modular approach, as developers are free to use tools of their choice. For example, Alertmanager for alerting and Grafana for dashboards.
Prometheus comes up with a robust alerting mechanism that works along with its AlertManager component. Alerting rules that you define are evaluated by Prometheus using the PromQL queries.
AlertManager handles the routing, grouping, and deduplication of notifications to various servers like Slack, Email, PagerDuty, etc. On the visualization front, Prometheus has a basic web UI, but it can be paired with Grafana for even richer and customized dashboards.
Verdict: Prometheus is the superior choice for built-in alerting and visualization, providing a robust, integrated alerting system.
Querying Capabilities
OpenTelemetry does not provide any built-in query language; instead, it relies on the capabilities of the chosen observability backend for querying and analysis. This way, it offers more flexibility, for example, you can use PromQL for Prometheus-compatible backends, LogQL for logs, and other custom query languages.
Prometheus utilizes a powerful and flexible query language, PromQL, which is especially designed for time series data. PromQL allows you to perform mathematical operations, complex aggregations, etc., making it highly effective for real-time analysis.
Verdict: Prometheus is the best choice if you are highly focused on querying capabilities.
Use Cases of Prometheus and OpenTelemetry
By now, you are aware that Prometheus vs OpenTelemetry are used for different needs. You must understand when to use each to build an effective monitoring solution.
When to use Prometheus?
Prometheus is a metrics-based monitoring system and primarily focuses on infrastructure and infrastructure health monitoring. It excels in Kubernetes-like environments where you want to scrape and store metrics from services, nodes, and workloads.
If your monitoring goals are centered around alerts, dashboards, and time series analysis, then Prometheus is the best choice for you. It provides a self-contained setup with minimal dependencies.
When to use OpenTelemetry?
OpenTelemetry is ideal when you need to collect more than just metrics. For example, traces for end-to-end request tracking and logs for event details. Suppose your observability needs are based on flexible data pipelines that can ingest data from multiple sources and export data to different backends like Prometheus, Jaeger, Zipkin, etc.. In that case, OpenTelemetry is the right choice for you.
Hybrid Models in Production Today?
A typical pattern is to use Prometheus for metrics storage, alerting, and dashboard capabilities, while OpenTelemetry handles the instrumentation and trace/log collection.
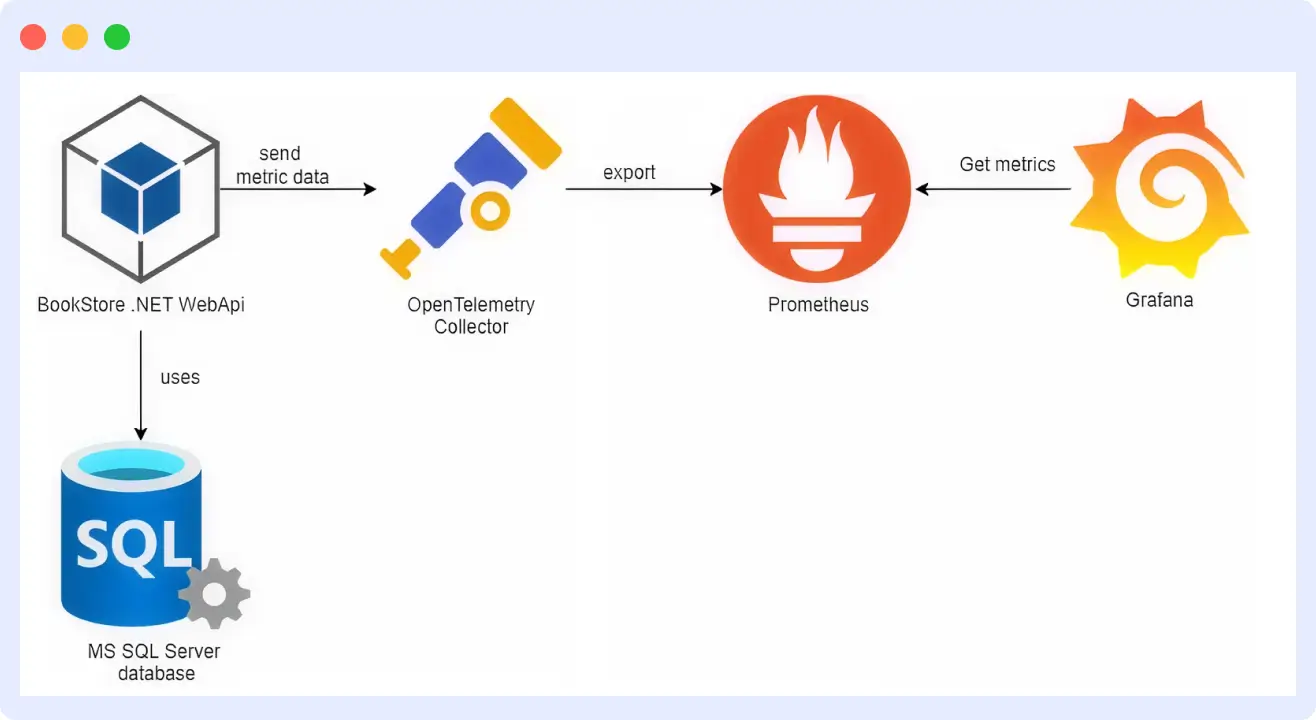
For example, OpenTelemetry can be used to generate and export metrics, which can then be scraped and stored by Prometheus. This combination works the best as you benefit from cross-signal observability from OpenTelemetry and a mature metrics stack from Prometheus.
Integration: Can Prometheus and OpenTelemetry Work Together?
As you might have understood by now, both OpenTelemetry and Prometheus are leading solutions for observability. But they both follow fundamentally different approaches for monitoring. Despite their differences, they can be used together to use the benefits of both observability tools.
There are two possible ways of integrating Prometheus and OpenTelemetry. Let’s check a detailed breakdown of both of these ways:
OpenTelemetry Collector as a Bridge
OpenTelemetry Collector works as a central hub, capable of receiving telemetry data in various formats, transforming it, and forwarding it to multiple backends. This collector mainly offers two critical components:
Prometheus Receiver
The collector can be easily configured to act like a Prometheus server. It allows metrics to be directly scraped from the Prometheus exposed endpoints.
This typically means you can continue to use your existing Prometheus client libraries and exporters, and OpenTelemetry can take care of your data ingestion needs. This could be really helpful if you want to shift to OpenTelemetry gradually or if you prefer not to change the legacy system configuration, which already exposes Prometheus metrics.
Prometheus Exporter
On the other hand, the OpenTelemetry collector can also be configured to export the collected telemetry data in the Prometheus-compatible format.
This allows Prometheus metrics to scrape metrics that were initially instrumented using the OpenTelemetry APIs. This is highly useful for organizations that heavily rely on Prometheus for metrics storage, querying, and alerting.
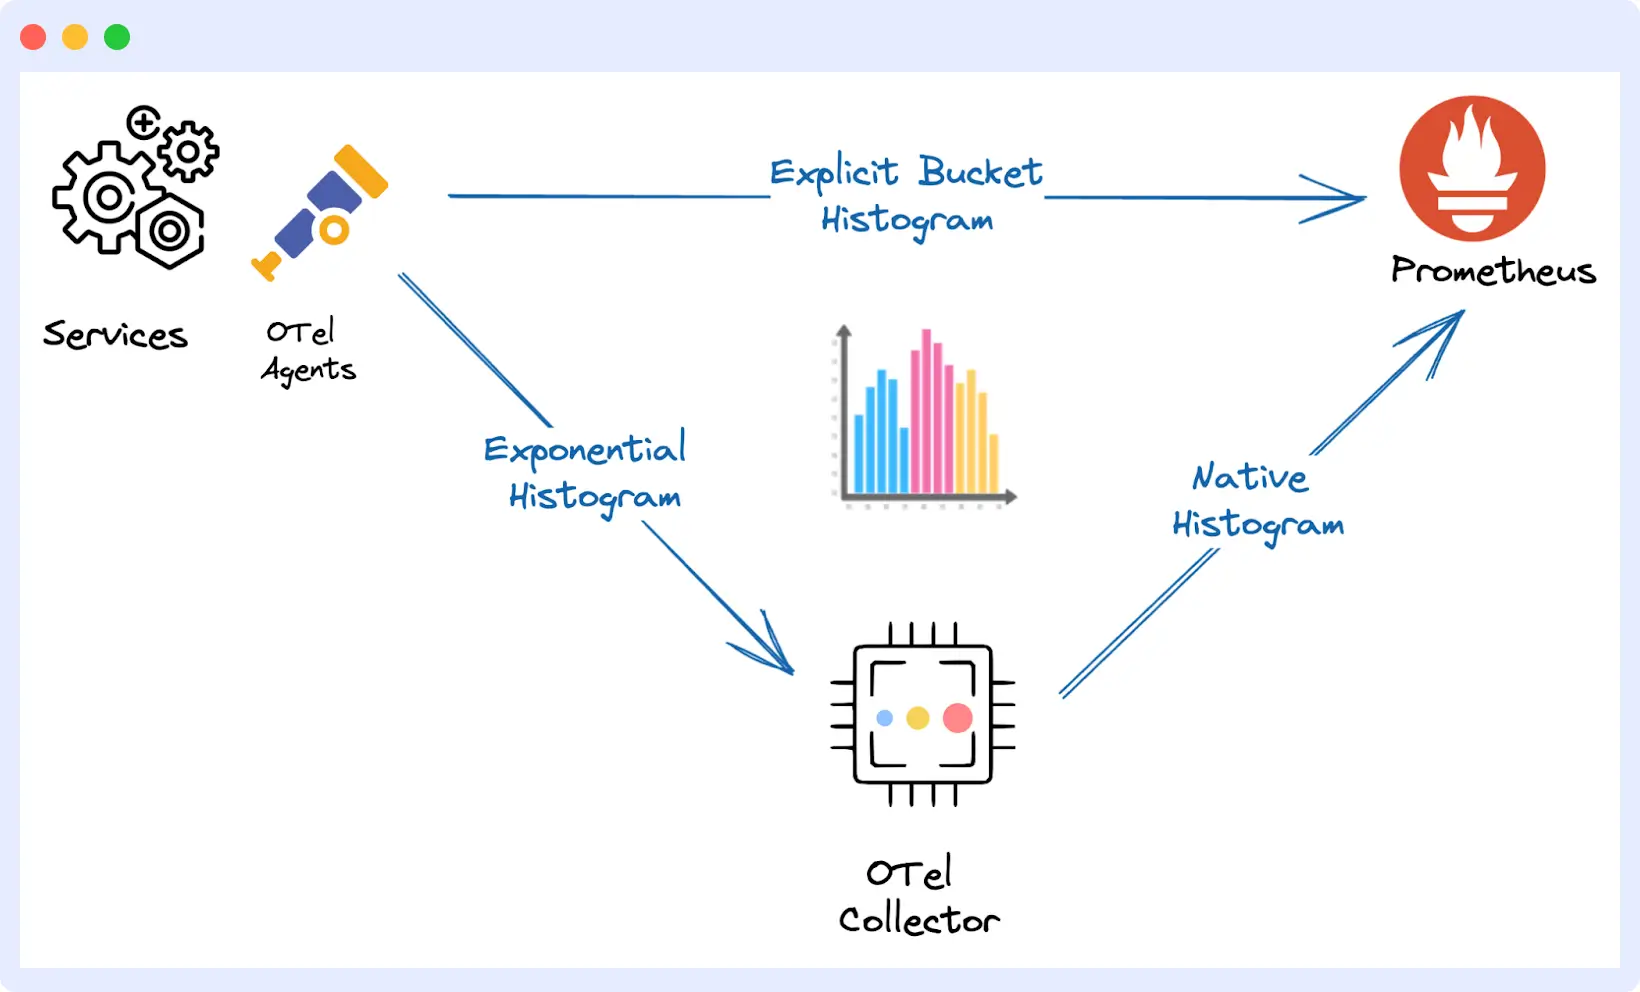
Prometheus as an OpenTelemetry Backend
With the latest Prometheus 3.0 updates, you can now configure Prometheus to accept metrics directly in the OpenTelemetry Protocol (OTLP) format over HTTP. This clearly means that OpenTelemetry metrics become more queryable via PromQL as soon as they come to Prometheus.
Middleware: A Better Alternative?
While OpenTelemetry and Prometheus are strong competitors as powerful open source solutions for observability, combining them requires a significant amount of work and knowledge.
In this case, you might want a tool that has the best aspects of both of these tools without the complexity of stitching multiple components together.
Middleware is one of the compelling alternatives that offers an all-in-one unified observability platform that integrates metrics, traces, logs, and alerting.
New to Middleware? Follow our Quickstart guide to begin monitoring with Prometheus in minutes, no complex setup required.
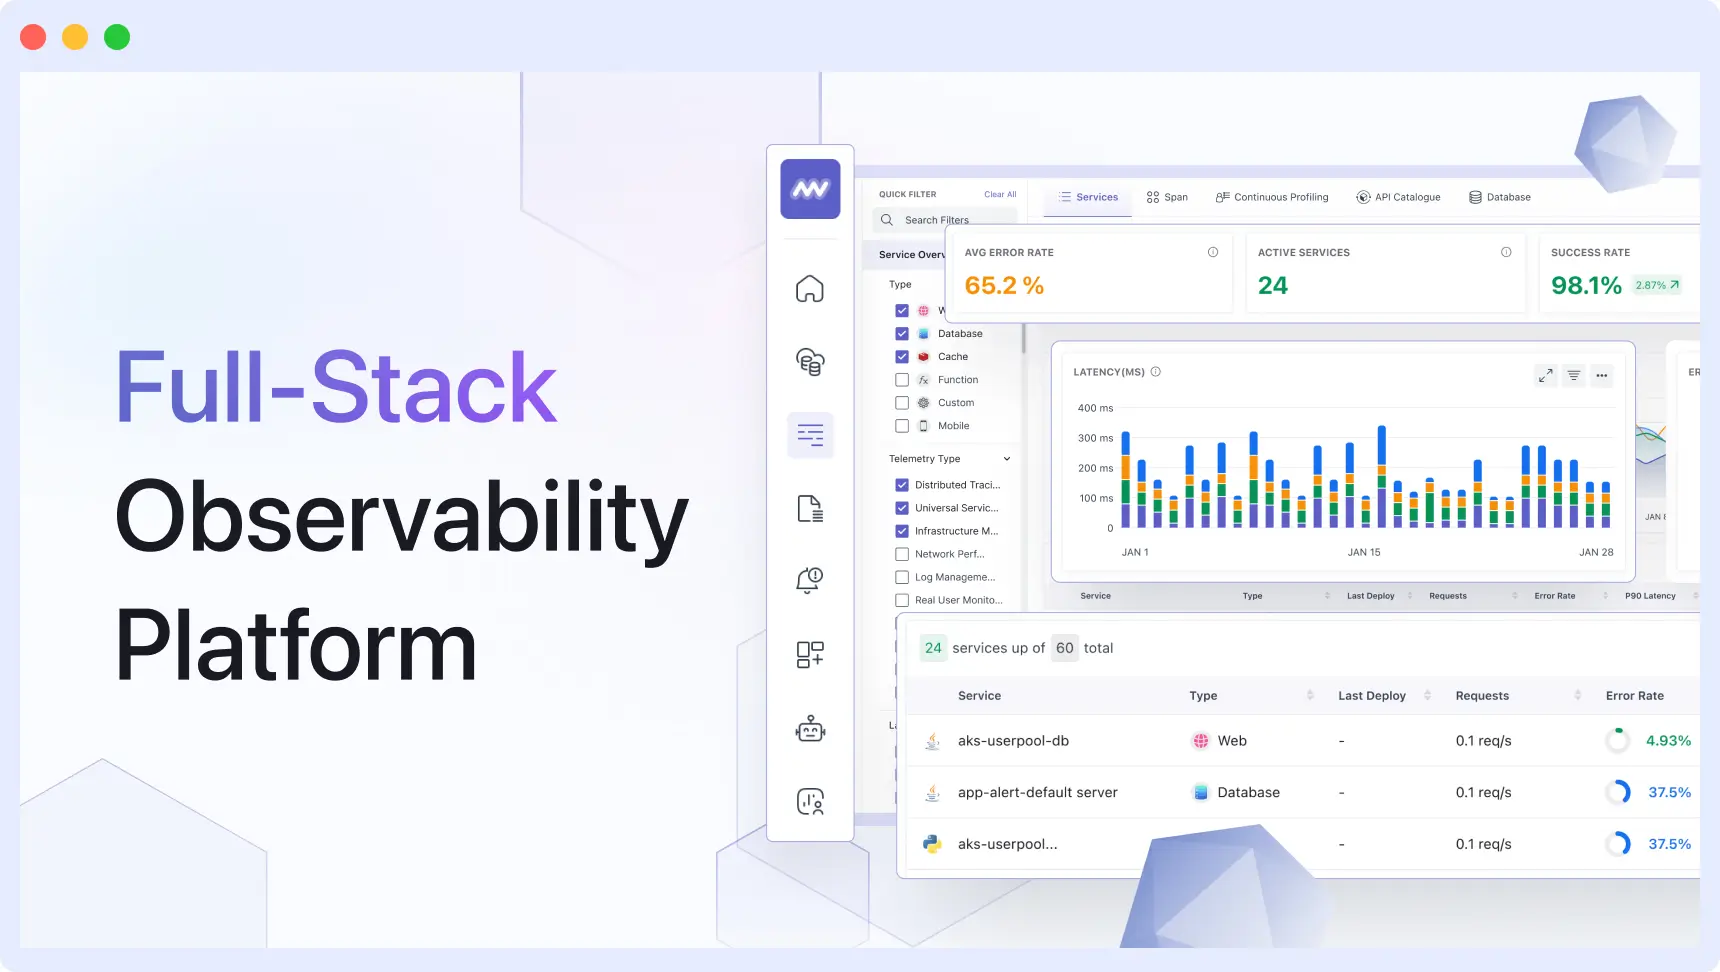
Some of the key features of Middleware include:
- Unified Telemetry: All your events, logs, traces, and events can be integrated in a unified view.
- AI-Driven Issue Detection and Resolution: Middleware Ops AI to proactively detect and even automatically resolve production issues to a great extent.
- End-to-End Monitoring: A unified platform that supports infrastructure, application performance, serverless, database, and real user monitoring.
- Intuitive Dashboard: Middleware provides a customizable UI, enhanced user dashboard, and alerting workflows for diverse user needs.
For teams that want the power of Prometheus-style metrics, the flexibility of OpenTelemetry, and the convenience of a unified SaaS solution, Middleware is the go-to solution that delivers enterprise-grade observability without the enterprise overhead.
Conclusion
While Prometheus is a more self-contained solution, OpenTelemetry provides a more flexible approach for collecting logs, traces, and metrics. Although they work on different principles, they are actually not mutually exclusive. In fact, they work better together where OpenTelemetry can handle the instrumentation and data exportation, and Prometheus can work as a backend for collecting the data and analysis.
Configuring and understanding OpenTelemetry, Prometheus, or a combination of them can take a certain amount of effort and time. Using a solution like Middleware can combine the strengths of both tools. For organizations requiring enterprise-grade observability with minimal setup and maximum insight, Middleware offers a scalable and highly efficient solution.
Still Exploring Other Observability Tools?
We understand choosing the right monitoring stack isn’t always simple. If you’re still reviewing options, these in-depth comparisons will help you decide what best fits your needs:
- Grafana vs Datadog
- Prometheus vs Grafana vs Middleware
- Grafana vs New Relic
- Kubernetes vs Docker
- Datadog vs Dynatrace
- Datadog vs New Relic
- Prometheus vs Grafana
Prefer an all-in-one solution? Try Middleware for unified logs, metrics, traces, and more without juggling multiple tools.