
DevOps – a portmanteau of Development and Operations is a functional, smart combination of cultural philosophies, tools, and practices that improve an organization’s output and efficiency in delivering applications and services to the end users. DevOps metrics are quantitative measurements used to assess the effectiveness of DevOps practices.
An Atlassian survey found that 99% of respondents agreed that DevOps had a positive impact on their organizations. However, high-performing DevOps teams don’t rely solely on intuition. According to Google’s DORA research, elite DevOps teams deploy code 973x more frequently and recover from incidents 6570x faster than low performers.
In 2026, DevOps metrics are no longer just engineering KPIs; they are business-critical indicators tied to customer experience, revenue stability, and cloud cost optimization.
Through this blog, you will learn about the key DevOps metrics you should be tracking, the DevOps tools you need to measure them, and the best practices that allow you to implement DevOps.
What Are DevOps Metrics?
DevOps metrics are measurable indicators used to evaluate the speed, quality, reliability, and efficiency of software delivery pipelines.
Using these DevOps performance metrics, you can quickly identify the bottlenecks and inefficiencies in your software development pipelines and environments.
For example, a low deployment frequency combined with a high change failure rate often indicates manual release processes or inadequate testing. On the other hand, high deployment frequency with low MTTR is a strong signal of DevOps maturity.
Why DevOps Metrics Matter in 2026
In 2026, DevOps metrics are no longer limited to engineering dashboards. They are increasingly used by engineering managers, platform teams, and CTOs to:
- Evaluate software delivery performance across teams
- Improve deployment speed without compromising stability
- Reduce Mean Time to Detect (MTTD) and Mean Time to Recover (MTTR)
- Measure the business impact of technical decisions
- Support data-driven decision-making in DevOps and SRE practices
How DevOps Metrics Impact Business
| DevOps Metric | What It Signals | Business Impact |
| Deployment Frequency | How often is new code released to production | Faster time-to-market, quicker feature delivery |
| Lead Time for Changes | Speed from code commit to production | Higher engineering efficiency and responsiveness |
| Change Failure Rate | Stability of production releases | Lower downtime, improved customer trust |
| Mean Time to Detect (MTTD) | How quickly issues are identified | Reduced incident impact and support costs |
| Mean Time to Recover (MTTR) | Speed of service restoration after failure | Higher system reliability and SLA compliance |
| Code Coverage | Effectiveness of test coverage | Fewer production bugs and regressions |
| Defect Escape Rate | Quality of CI/CD and testing processes | Reduced rework and customer-facing issues |
| Availability (Uptime) | System reliability over time | Direct impact on revenue and user satisfaction |
| Performance Metrics | Application speed and responsiveness | Better user experience and retention |
Types of DevOps metrics
There are several types of DevOps metrics; however, they can be broadly classified into two categories:
- DORA metrics DevOps
- Supplemental metrics
DORA Metrics
DORA is a convenient acronym for DevOps Research and Assessment. There are four key metrics that you can measure under DORA:
- Deployment Frequency: Measures how often your team releases an app to production.
- Lead time for changes: If you wish to measure the time it takes for a committed code to go into production, this is your metric.
- Change failure rate: This metric measures the percentage of deployed production failures that require bug fixes.
- Mean time to restore service: If you need to measure the time your organization takes to recover from a failure, this is the right metric to track.
Supplemental Metrics
In addition to the DORA metrics, the five supplemental metrics detailed below will help you establish a good map of your DevOps culture.
- Defect escape rate: This metric represents the total number of bugs that escape detection during the testing phase.
- Mean time to detect: This metric measures the time elapsed from incident initiation to detection.
- Percentage of code covered by automated tests: This tells you about the percentage of code that is tested automatically in your processes.
- App availability: As is evident, this metric tells you the percentage of time that an app is fully functional to meet the end-user’s needs.
- Application usage: This metric indicates the total number of users accessing your systems.
What are Key DevOps Metrics to Track in 2026
Organizational success depends on the success of its processes and internal efficiencies.
Listed below are the 11 key DevOps metrics that companies will track in 2026 to better understand their DevOps initiatives.
1. Deployment Frequency
Deployment frequency is a measure of how often your organization achieves deployments. It is ideal to do more deployments that are smaller in size because it allows for better and scalable testing and release.
It also helps you create an exclusive QA pipeline to speed up your testing times.
How to measure it:
Total number of production deployments within a defined time period (daily, weekly, or monthly).
Ideal range:
- Elite teams: Multiple deployments per day
- High-performing teams: Daily to weekly deployments
Tool examples:
GitHub Actions, GitLab CI/CD, Jenkins, Middleware (deployment tracking dashboards)
2. Lead Time for Changes
The time elapsed between the start of work and the deployment of the item is defined as lead time. This metric helps you track the time your DevOps team spends on each project before it goes into production. This is important for resource planning.
How to measure it:
Timestamp difference between code commit and successful production deployment.
Ideal range:
- Elite teams: Less than 1 day
- Low performers: More than 1 month
Tool examples:
GitLab, Bitbucket, Jira, Middleware (CI/CD pipeline visibility)
3. Change the Failure Rate
The percentage of code changes you make for hotfixes, bug fixes, or other remediations after your product has gone into production can be measured using the Change Failure Rate. This metric identifies errors that aren’t detected and fixed before code deployment.
How to measure it:
(Number of failed deployments ÷ total deployments) × 100
Ideal range:
- Elite teams: 0–15%
- Risky zone: Above 30%
Tool examples:
Datadog, Sentry, Middleware (incident correlation with deployments)
4. MTTD
The mean time to detection is the average time between the start of a problem and its detection. Ideally, this metric should be as small as possible, because the longer an error goes undiscovered, the more resources it will take to fix it if it reaches production.
How to measure it:
Time between the start of an incident and when it is first detected or alerted.
Ideal range:
- Mature teams: Minutes
- High-risk teams: Hours or days
Tool examples:
Middleware (AI-based alerts), Prometheus, Grafana, New Relic
5. Mean Time to Recovery (MTTR)
Mean time to recovery is an important metric that helps you understand the time it takes for your business to recover from a problematic DevOps incident. This metric is measured during business hours to gauge its real-time impact on operations. The higher this metric, the greater the impact.
How to measure it:
Total downtime ÷ number of incidents during a specific period.
Ideal range:
- Elite teams: Less than 1 hour
- Acceptable: Under 24 hours
Tool examples:
Middleware (root-cause analysis), Datadog, PagerDuty, Opsgenie
6. Code Coverage
Code coverage is the percentage of your code that your testing suite can optimally test. You want this metric to be balanced to test the most critical parts of the code while avoiding unnecessary testing of trivial code that is less likely to exhibit errors. The metric varies by code.
How to measure it:
Executed lines of code ÷ total lines of code) × 100
Ideal range:
- Practical range: 70–85%
- Focus on critical paths rather than 100%
Tool examples:
JaCoCo, SonarQube, Codecov, CI/CD testing frameworks
7. Test Automation Coverage
Test automation coverage metric tells you how much of your code is lined up for automated testing. This is represented as a percentage of the total code.
The amount of code your organization sets up for automated testing depends on your customized DevOps process and requirements. While 100% automated testing doesn’t always guarantee high quality, neither does under-testing.
How to measure it:
(Automated test cases ÷ total test cases) × 100
Ideal range:
- Mature DevOps teams: 60–80%
- Over-automation risk: Near 100% without test quality checks
Tool examples:
Selenium, Cypress, Playwright, Jenkins, GitHub Actions
8. Defect Escape Rate
The total number of errors that were not caught by your CI/CD process is expressed as a percentage, known as the defect escape rate. A higher defect escape rate depicts that your testing is inadequate.
You can improve this metric by revisiting your code coverage and reconfiguring the testing suite.
How to measure it:
(Production defects ÷ total defects found) × 100
Ideal range:
- Strong pipelines: Below 5%
- Warning zone: Above 10%
Tool examples:
Jira, Bugzilla, Sentry, Middleware (post-deployment issue tracking)
9. Customer Impact
Customer impact is reflected in metrics such as the number of tickets raised, app usage time and patterns, social media mentions, and more. It can also be measured by the Net Promoter Score.
This metric tells you about the general opinion of your product from a customer’s perspective – whether or not they are satisfied with the product.
How to measure it:
Using support tickets, downtime incidents, usage drops, NPS scores, and error reports.
Ideal range:
- Fewer customer-facing incidents
- Stable or improving NPS and retention
Tool examples:
Zendesk, Intercom, Google Analytics, Middleware (Real User Monitoring/Digital Experience Monitoring)
10. Availability
Availability, also called Uptime, is the metric that tells you the percentage of the time the application remained available to the users. To get a better perspective, consider the numbers in the table below:
| Uptime | Annual downtime |
| 99.9% | 8 hours, 45 minutes, 56 seconds |
| 99.99% | 52 minutes, 35 seconds |
| 99.999% | 5 minutes, 15 seconds |
Even a difference of 0.1% can have a huge impact on app availability.
How to measure it:
(Uptime ÷ total time) × 100
Ideal range:
- Business-critical apps: 99.9%–99.99%
- Mission-critical systems: 99.999%
Tool examples:
Pingdom, UptimeRobot, Datadog, Middleware (SLA monitoring)
11. Performance
Application performance is a metric that highlights aspects like hidden errors, performance problems, or any other issues that compromise app functionality for the end users.
These errors should be visible during the app testing phase.
How to measure it:
Using response time, latency, throughput, and error rates.
Ideal range:
- API response times: < 300 ms
- Page load times: < 2 seconds
Tool examples:
Middleware APM, New Relic, Dynatrace, Lighthouse
Tools for Measuring DevOps Metrics
Today, tracking key DevOps metrics is as simple as adopting the right tools to monitor your KPIs. Listed below are five high-performing tools you can use to understand your DevOps environment in numerical terms.
1. Middleware
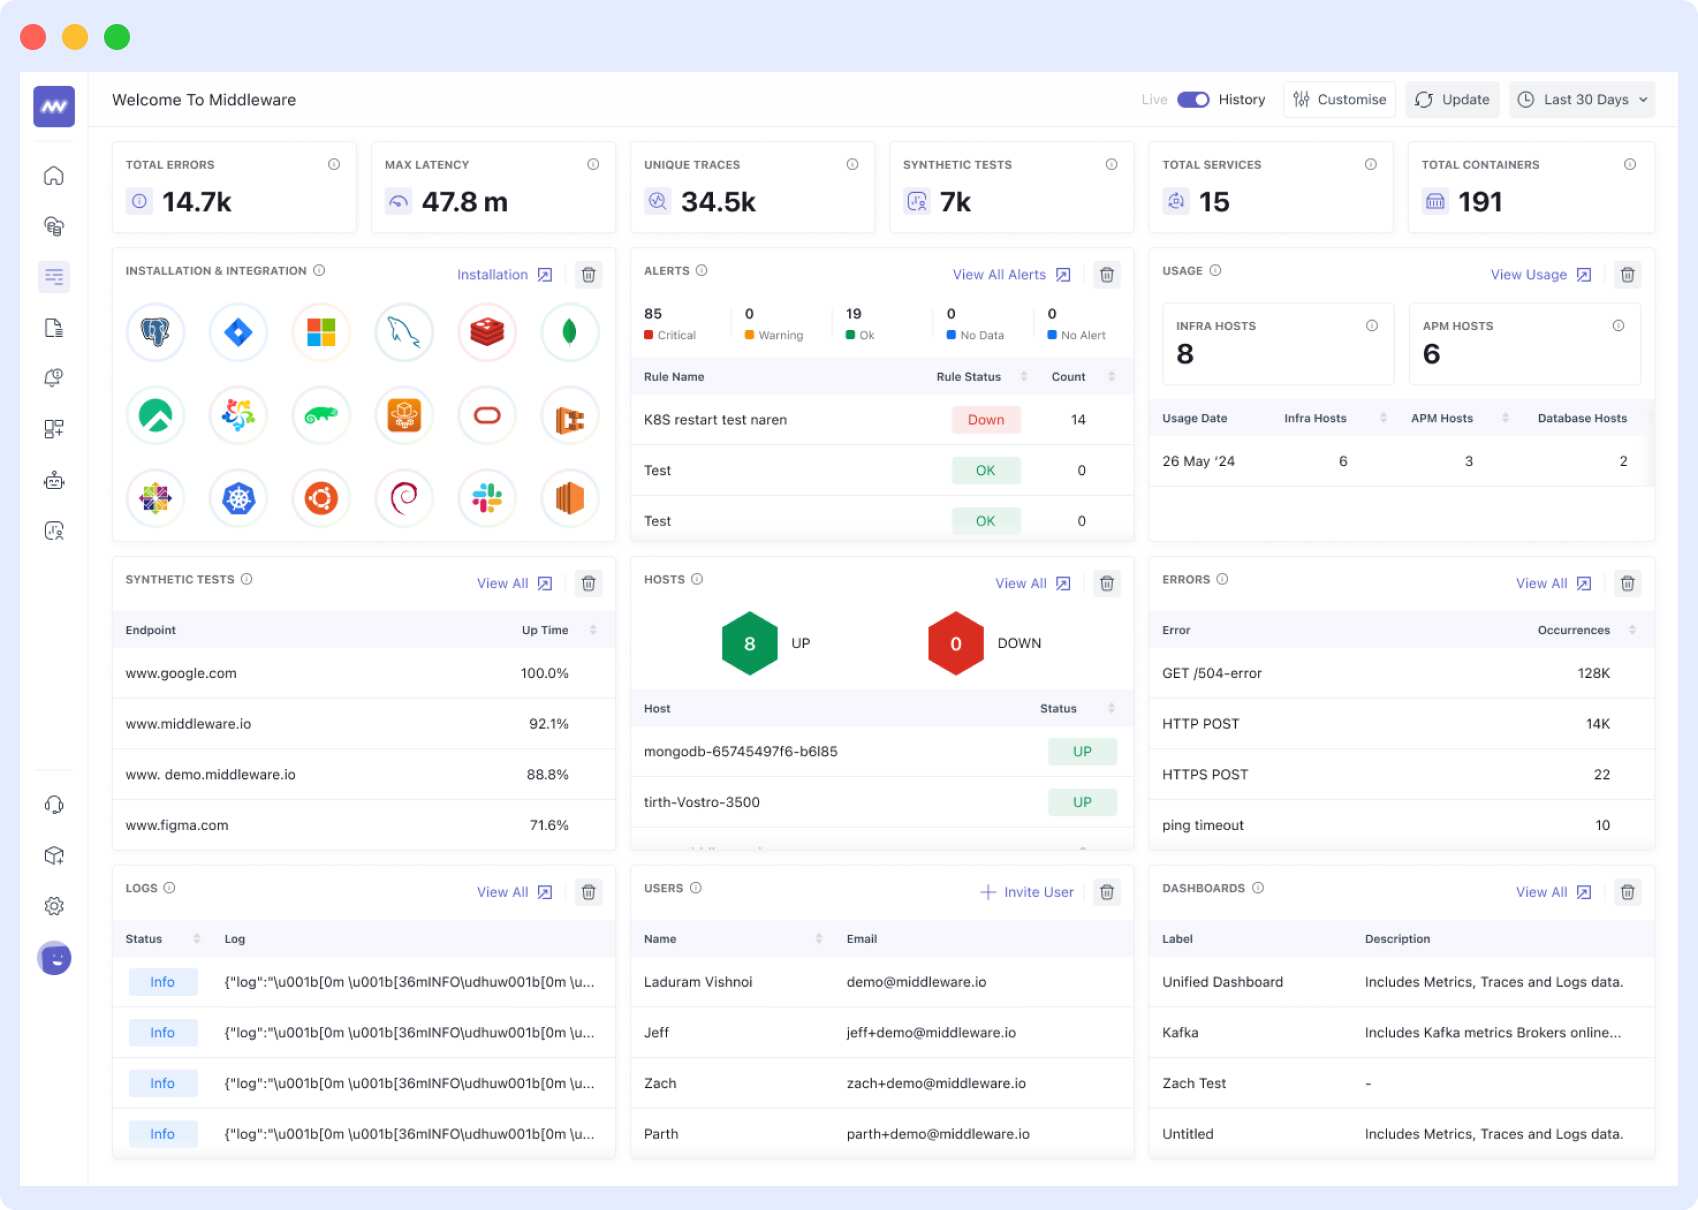
Middleware is a full-stack cloud observability platform that gives you a unified view of the overall health of your DevOps initiative.
All the metrics listed in the blog can be monitored in real-time and with AI-backed insight using only one tool – Middleware.
Some of the exciting features this platform offers are:
- Full-stack visibility and flexible deployment options
- Capability to track metrics for entire infrastructure and microservices
- Real-time monitoring and interactive data visualizations
- AI-based, automated alerts to reduce MTTD
Key Reasons DevOps Teams Prefer Middleware
- Single source of truth: Monitor DORA metrics, supplemental DevOps KPIs, logs, and traces from one platform without context switching.
- Faster root-cause analysis: AI-powered insights automatically connect anomalies to their underlying causes, reducing Mean Time to Detect (MTTD) and Mean Time to Recover (MTTR).
- Reduced tool sprawl: Replace multiple disconnected monitoring tools with one unified observability solution, lowering operational complexity and costs.
- Real-time visibility at scale: Gain full-stack visibility across cloud infrastructure, containers, Kubernetes, and microservices.
- Actionable alerts: Intelligent, noise-free alerts help teams focus on critical incidents instead of alert fatigue.
By consolidating observability into a single platform, Middleware enables teams to move from reactive troubleshooting to proactive DevOps optimization, making it easier to scale DevOps practices while maintaining high reliability and performance.
2. Prometheus
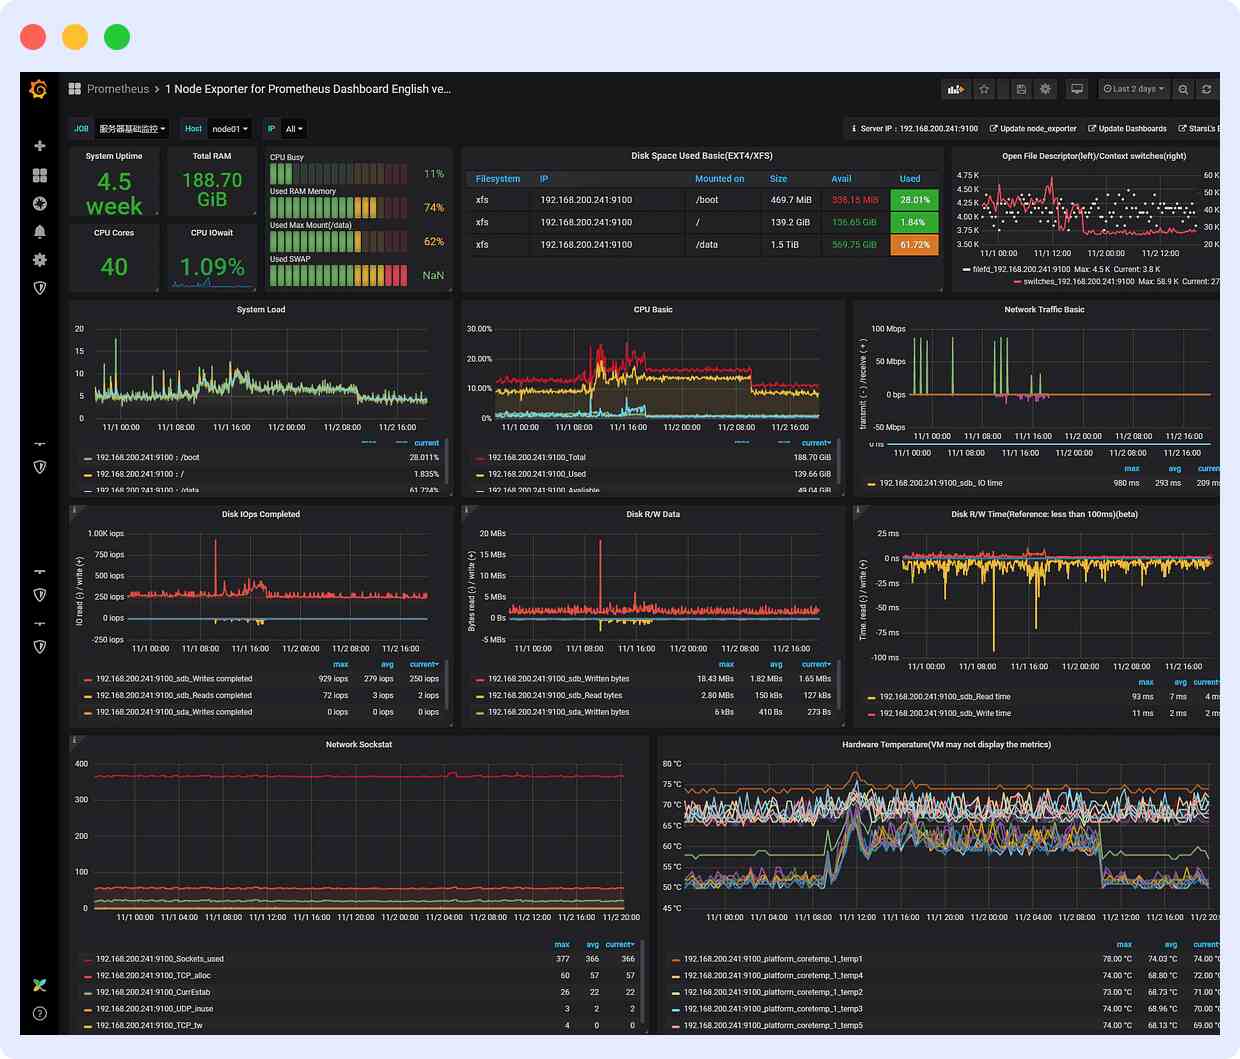
Prometheus is an open-source systems-monitoring platform that is majorly based on time series. It employs a dimensional data model in which time series are identified by a key-value pair.
You can track the key DevOps metrics using this platform; however, it may not give you information on the supplemental or all of the metrics mentioned above.
You get a host of features with Prometheus:
- PromQL and Grafana integration for data visualizations
- Local disk storage
- AlterManager for prompting incident alerts
3. Grafana
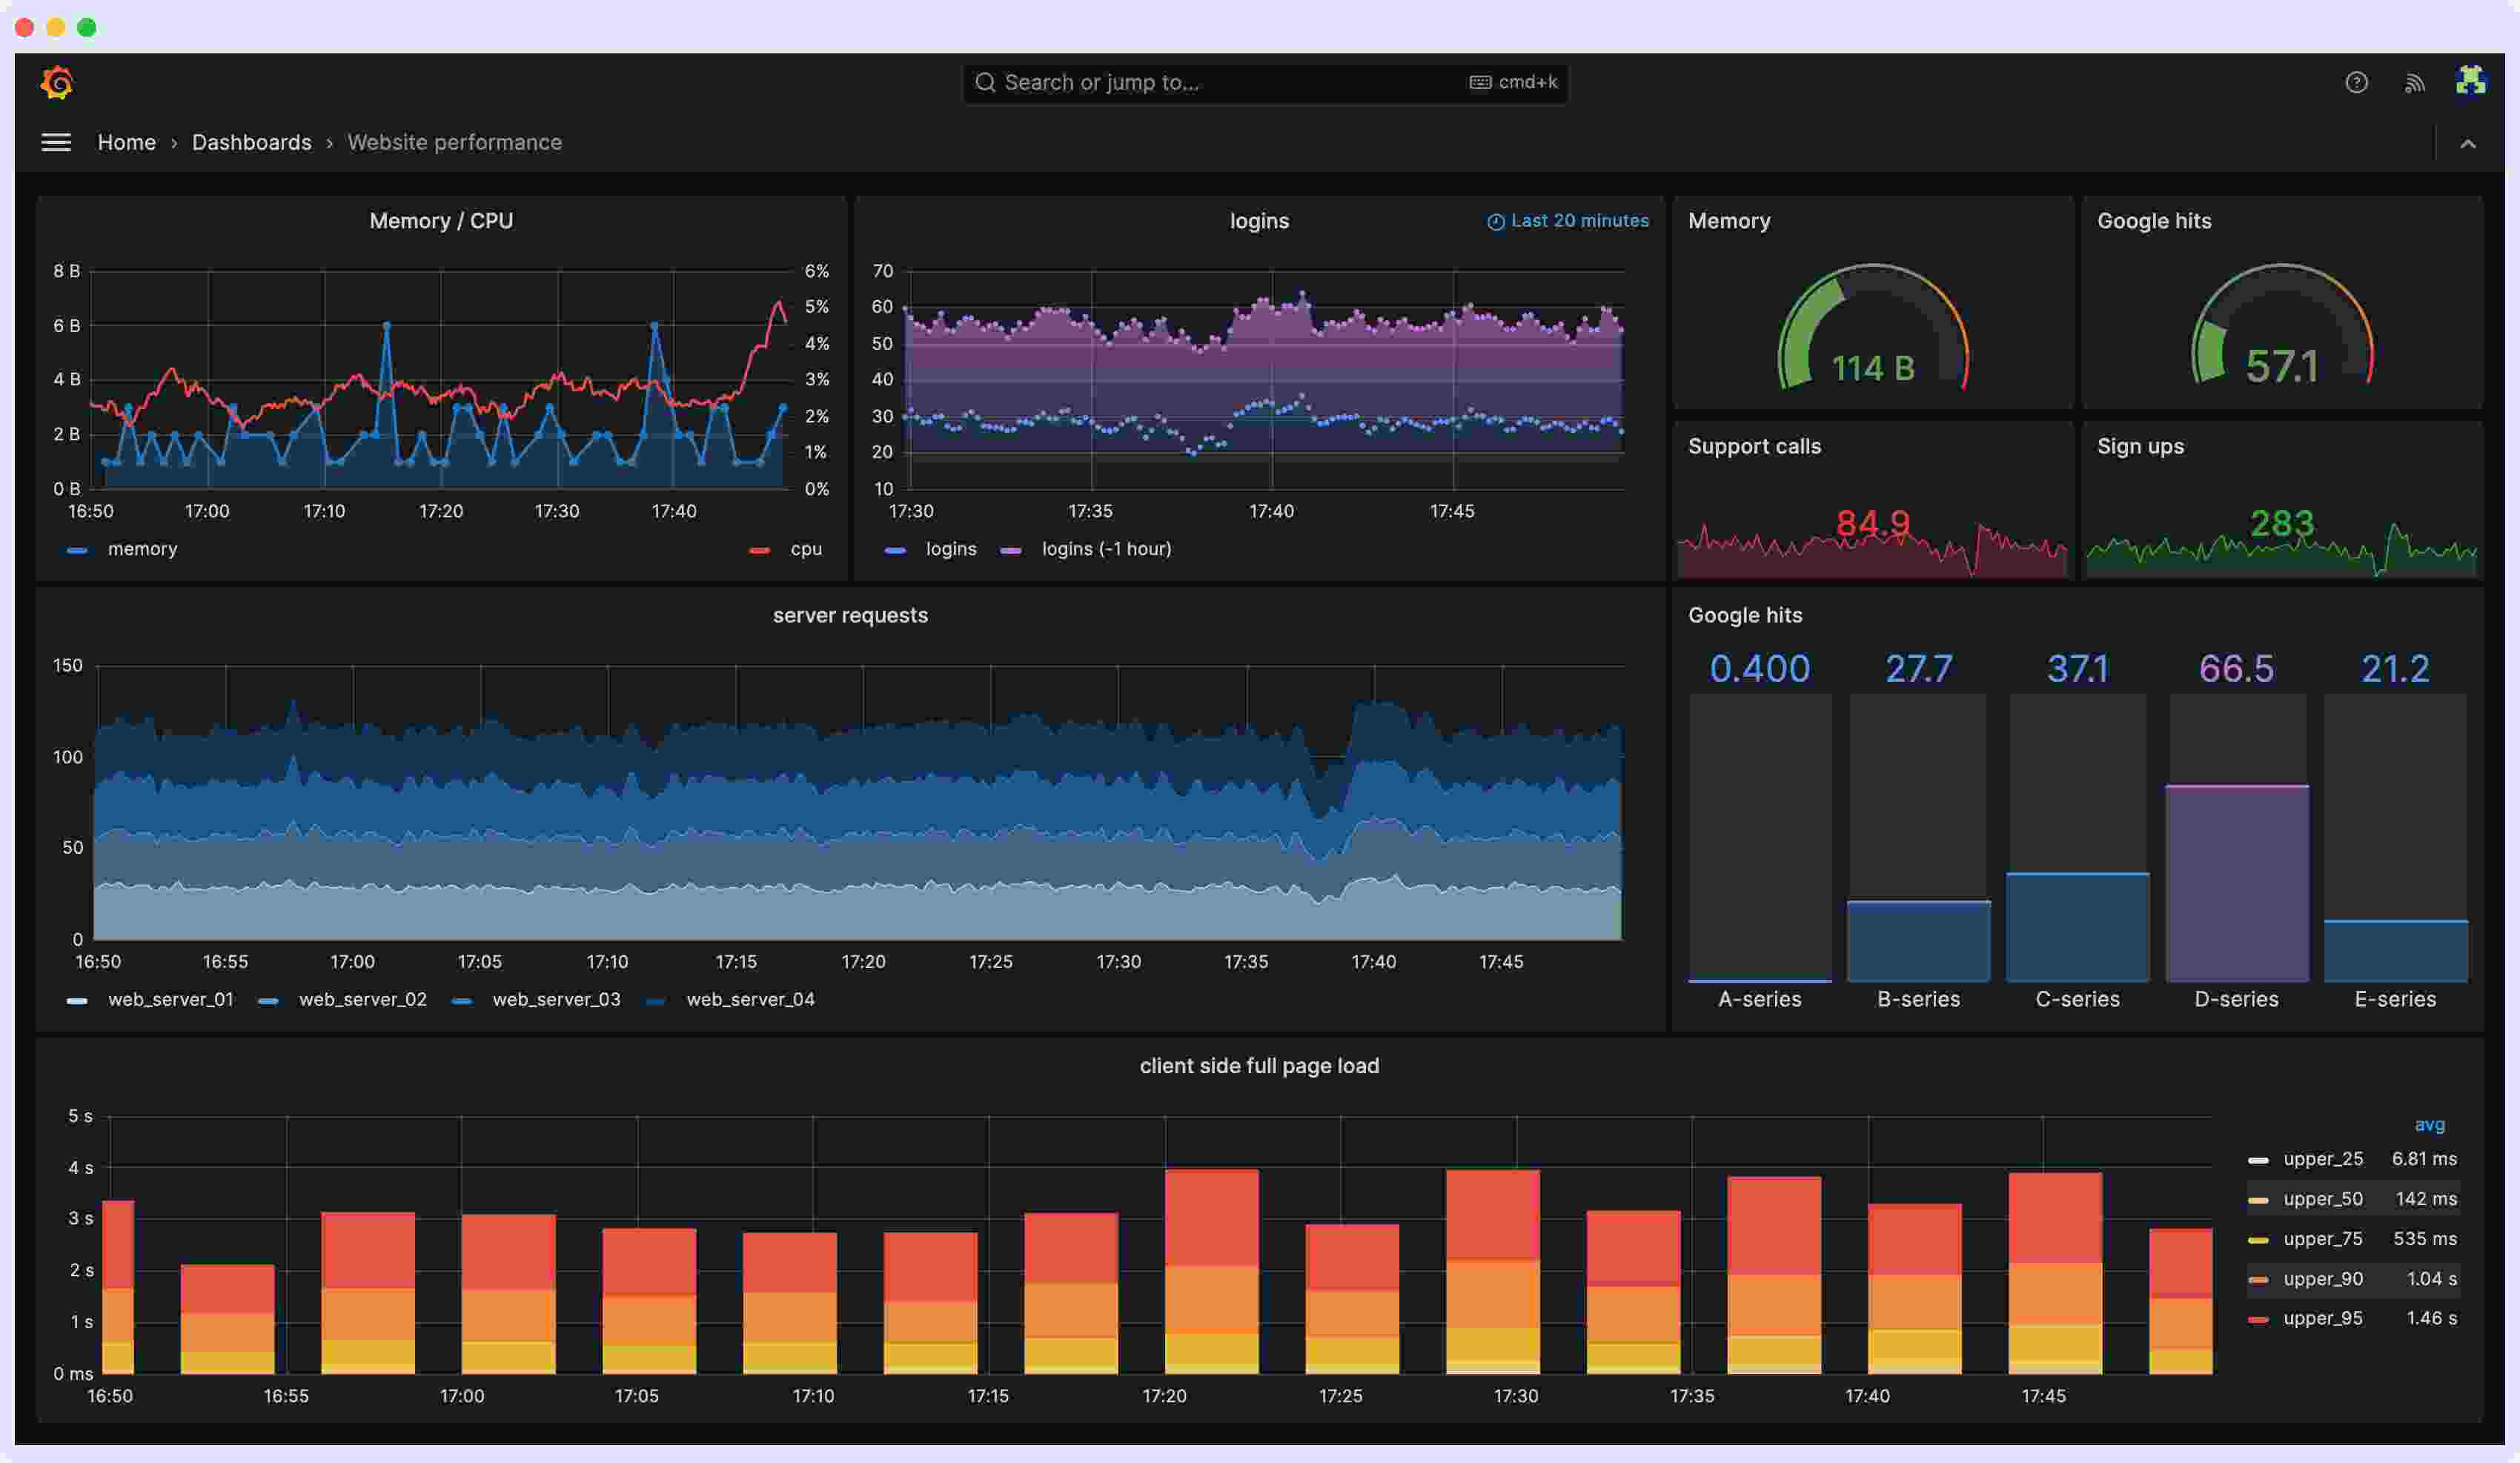
Grafana is a powerful tool that helps you unify your metrics from across various systems. Using this tool, real-time monitoring of one or two of the key DevOps metrics is possible. It may, however, not be sufficient as a full-scale DevOps monitoring tool.
Some of its key features include:
- Fast querying and global view
- Scalable and multi-tenant storage for metrics
- Out-of-the-box assembly for ready usage
- Versatile and customizable dashboards
4. Datadog
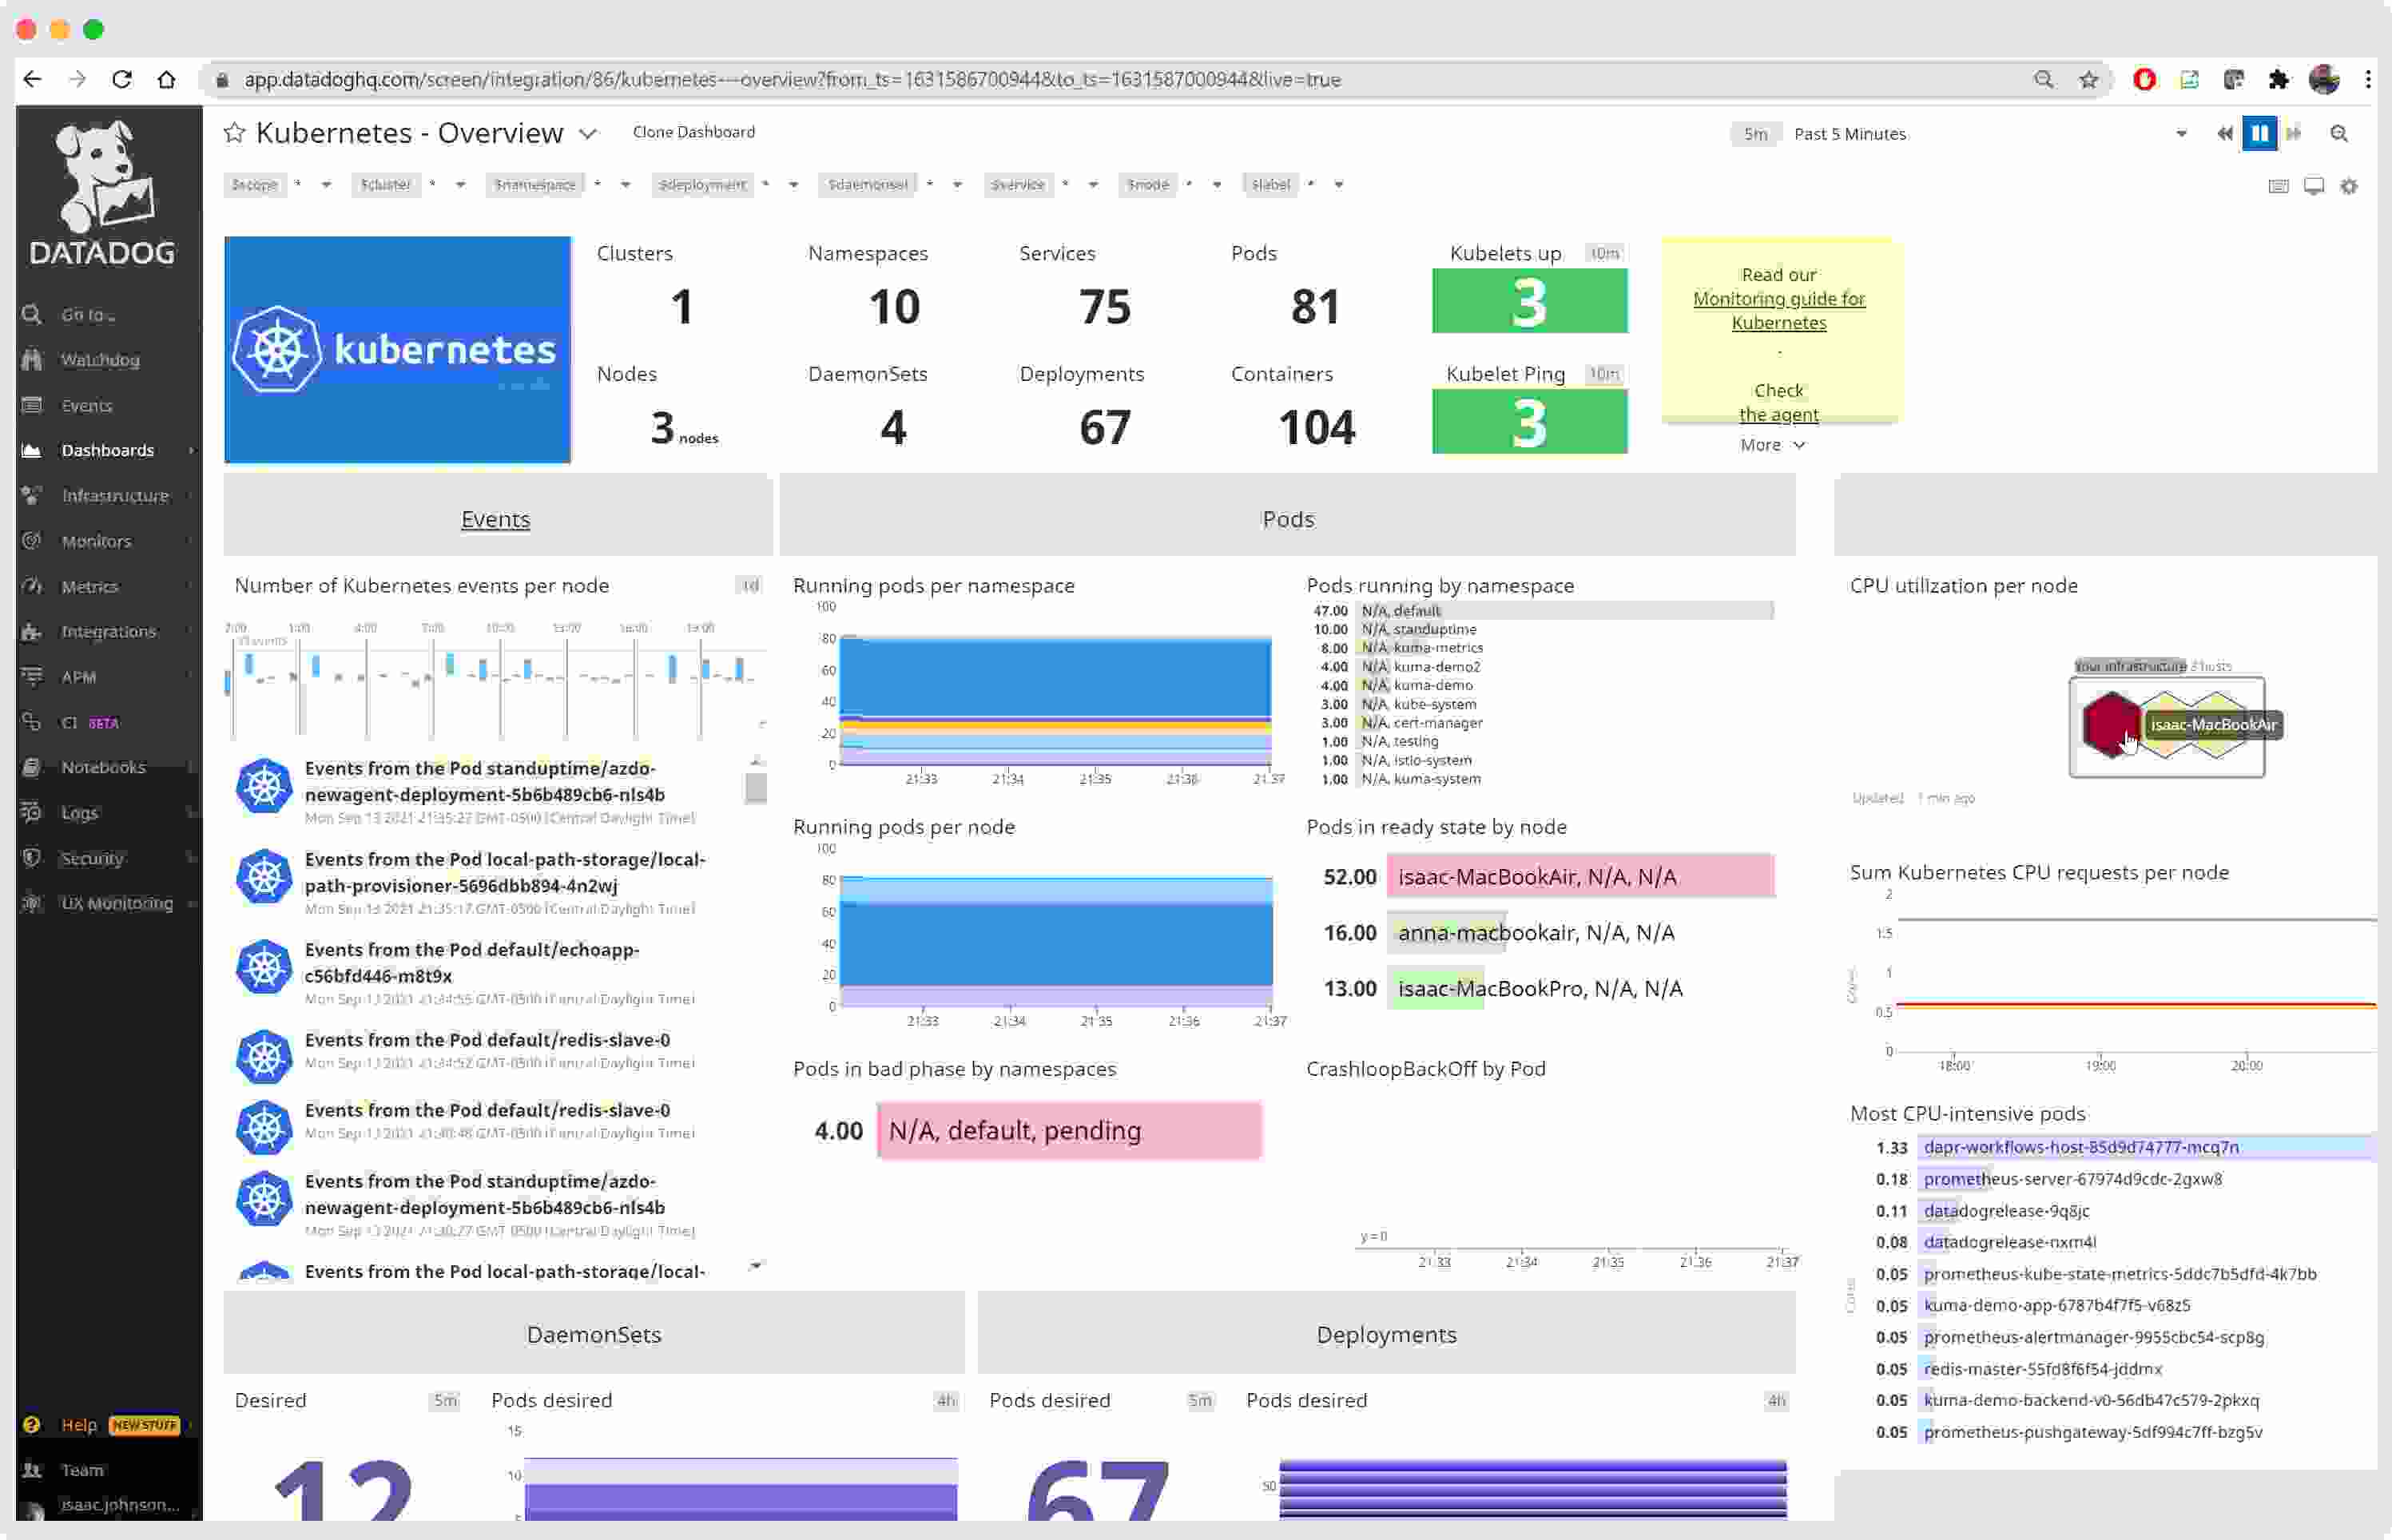
Datadog enables you to optimize your DevOps workflows by providing context-rich metrics, logs, traces, and more in a single interface.
You can measure key DevOps metrics using this tool. However, if you require full visibility into your DevOps environment, Middleware is a better option.
Some of Datadog’s excellent features include:
- A long list of supported integrations for data collection
- Real-time dashboards for instantaneous DevOps health statuses
- Event overlays to provide context to DevOps metrics
Explore Datadog pricing to find the plan that best fits your monitoring and observability needs.
5. Splunk
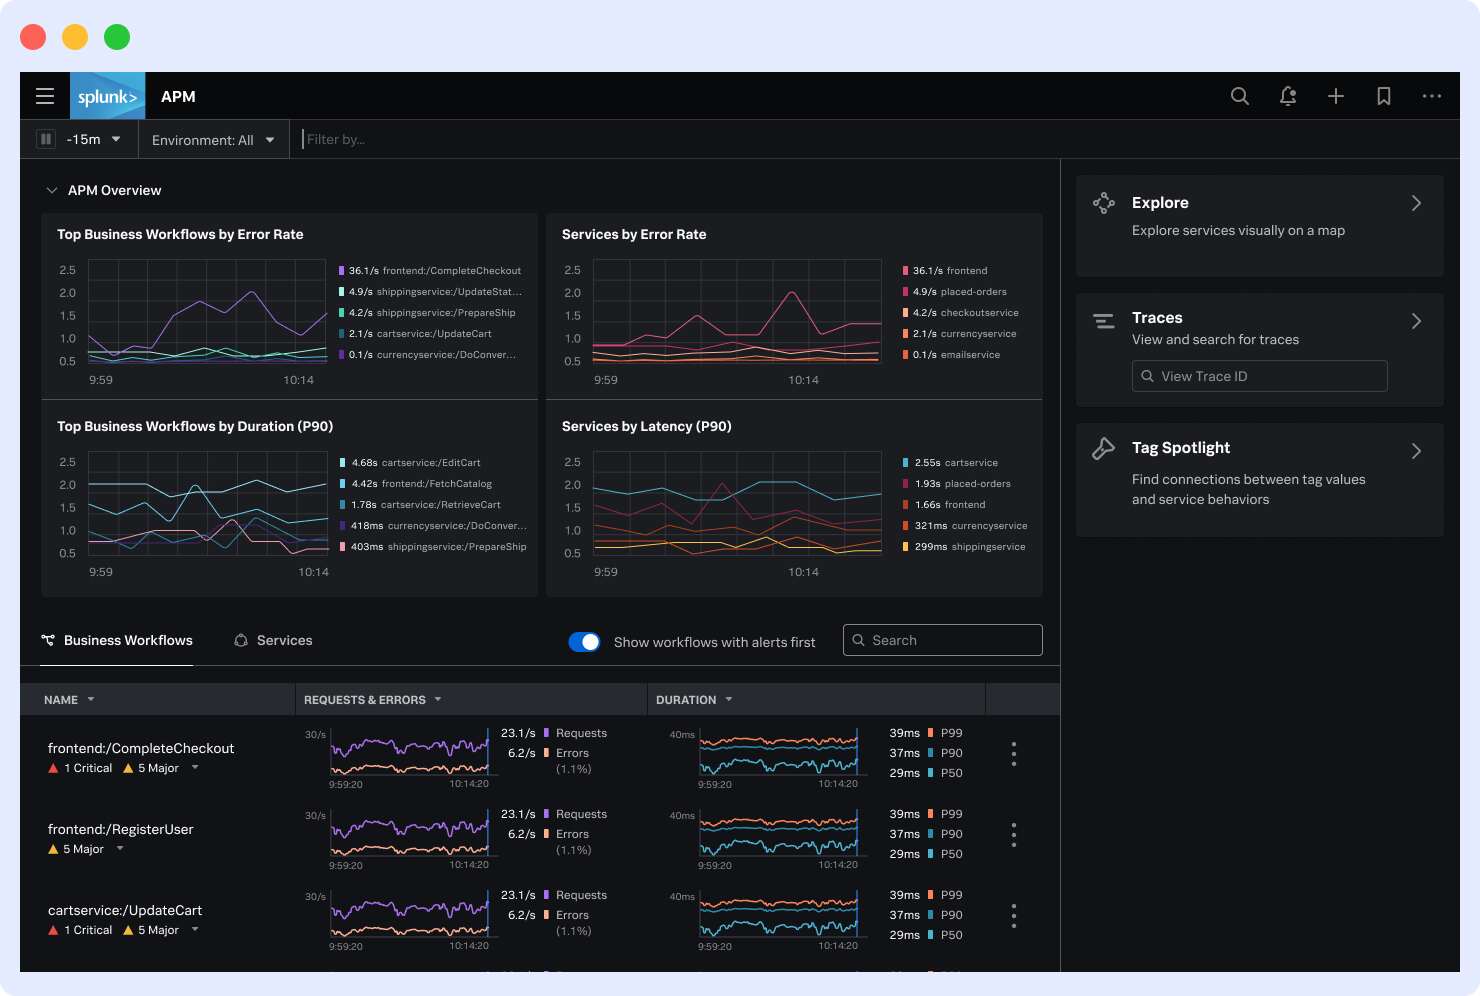
Splunk is a monitoring and visibility improvement tool that helps you eliminate the siloes in your DevOps process that enhance performance tracking and data mapping. This tool is good for monitoring operational metrics.
Some of its key features include:
- End-to-end visibility using automated observability
- Real-time insights
- Shared visibility to facilitate collaboration
- Alert routing, incident integration, and post-incident reports to improve team services
- System behavior monitoring to boost app uptime
Wrapping up: Turning DevOps Metrics Into Measurable Impact
It becomes easier to improve your software and app development cycles when you know exactly what is going on, even at a microscopic level.
DevOps metrics help you gain visibility into your software development funnels and pipelines, enabling you to identify and address issues before critical errors occur.
These DevOps metrics are used by SaaS, fintech, and enterprise engineering teams globally, including organizations operating at scale across North America, Europe, and APAC.
Platforms like Middleware support this approach by providing unified observability, bringing metrics, logs, traces, and deployment data into a single view. This makes it easier for DevOps and SRE teams to detect issues early, reduce recovery times, and make informed decisions based on real-time insights.
What are the most important DevOps metrics in 2026?
In 2026, key DevOps metrics will be vital to success. The DORA metrics deployment frequency, lead time, change failure rate, and mean time to recovery (MTTR) are essential. Additionally, monitoring defect escape rate, system availability, and customer impact metrics is crucial for driving positive business outcomes and enhancing customer satisfaction.
How do DORA metrics differ from DevOps KPIs?
DORA metrics measure delivery performance, while DevOps KPIs connect those metrics to business outcomes such as customer satisfaction, uptime, and revenue impact.
Which tools are best for tracking DevOps metrics?
Unified observability platforms like Middleware, along with tools like Prometheus, Grafana, and Datadog, are commonly used to track DevOps metrics in real time.