




A service can be up and running while still delivering a poor experience to the people using it.
Traditional monitoring tells you when something crosses a threshold: error rates increase, latency spikes, or a service becomes unavailable. But reliability is more than a single metric or incident. It’s whether a service is holding up to the standard your users actually expect, measured over time.
That’s why Middleware now supports Service Level Objectives (SLOs). It’s a new way to define, measure, and act on service reliability, built directly into the platform you already use for logs, traces, and metrics. See how SLO monitoring works in Middleware.
With Middleware SLOs, you can define reliability targets for your services, monitor error budgets and burn rates in real time, get alerted before reliability is at risk, and drill directly into the logs and traces behind an issue.
Set the target. Track the budget. Understand the burn. Investigate the issue.
Key takeaways
- An SLO sets a measurable reliability target for a service, like 99.9% of requests succeeding.
- The error budget is how much failure that target still allows before it’s breached.
- Burn rate shows how fast the budget is being used, so you can tell a slow drift from a fast-moving incident.
- Multi-window, multi-burn-rate alerts flag risk before the SLO is actually breached.
- Every SLO links to the logs, traces, and deployment events behind it for faster root-cause analysis.
- The SLO Dashboard gives developers, SREs, and business stakeholders one shared view of reliability.
Turn service reliability into a measurable target
An SLO defines the reliability target you expect a service to maintain over a specific period.
Example: 99.9% of checkout requests should be successful.
Instead of looking at individual errors or latency spikes in isolation, an SLO gives your team a measurable way to determine whether a service is delivering the expected level of reliability.
In Middleware, an SLO is built on the alerts you already have. It tracks up to 20 existing alerts and stays up while none are firing critical, and down while any are, so you don’t need new instrumentation to start measuring reliability.
This gives developers, SREs, engineering leaders, and other stakeholders a shared understanding of what “reliable” means for each service.
Establish SLOs in a few clicks
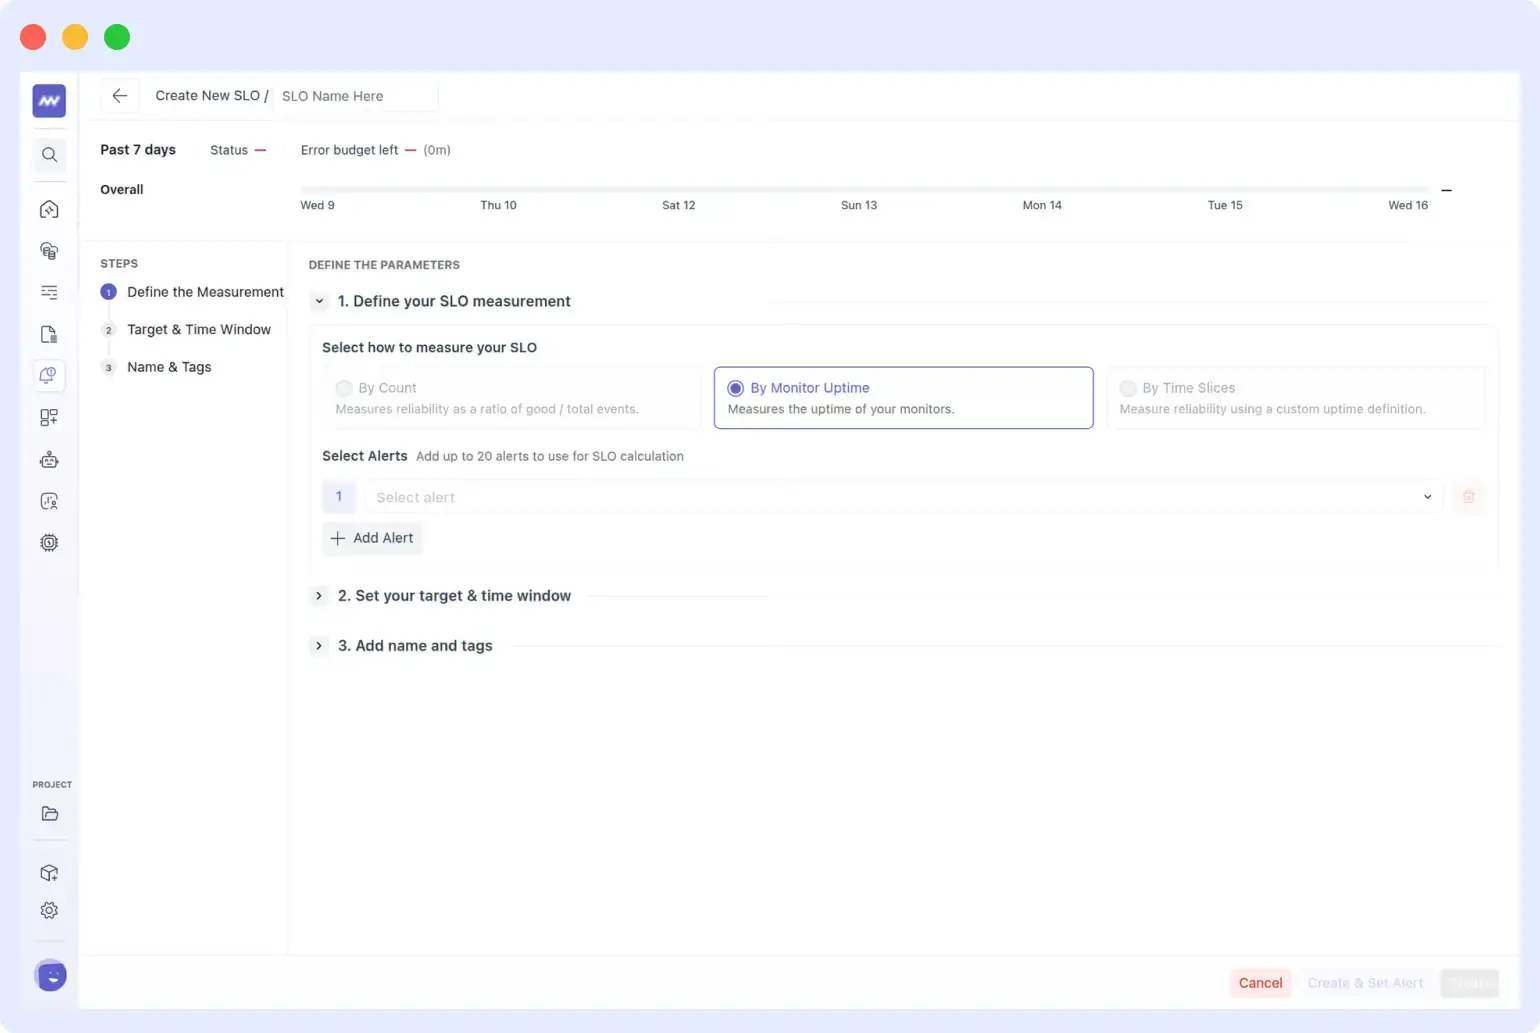
Creating an SLO in Middleware takes three steps.
First, pick the alerts the SLO should measure, up to 20 of them, from any alert type: Metrics, Host, Logs, APM, RUM, LLM, Billing, Anomaly, Forecast, or Error Tracking. Middleware previews the uptime of those alerts over the last 7 days as you build it.
Next, set the time window, a rolling 7, 30, or 90 days, and the target: the percentage of that window during which the alerts must not be critical. You can optionally add a warning level above the target so your team gets an early signal before the SLO is actually breached.
Finally, name the SLO, add tags, and save it, or save it and go straight into setting up an alert on it.
Middleware continuously evaluates performance against that target and shows the current SLO status: OK, Warning, or Breached.
From a single view, you can quickly identify services that are meeting their targets, approaching an SLO breach, or consuming their reliability budget faster than expected.
This makes it easier to monitor reliability across multiple services without reviewing each service individually.
Know how much failure you can tolerate with error budgets
An SLO does more than tell you whether you’re meeting your target. It also shows how much failure your service can still tolerate.
That allowance is your error budget.
For example, with a 99.9% SLO, the remaining 0.1% represents the amount of failure the service can tolerate during the selected SLO window.
Over a 30-day window, that’s about 43 minutes of allowed downtime. Over 7 days it’s roughly 10 minutes, and over 90 days it’s a little over 2 hours.
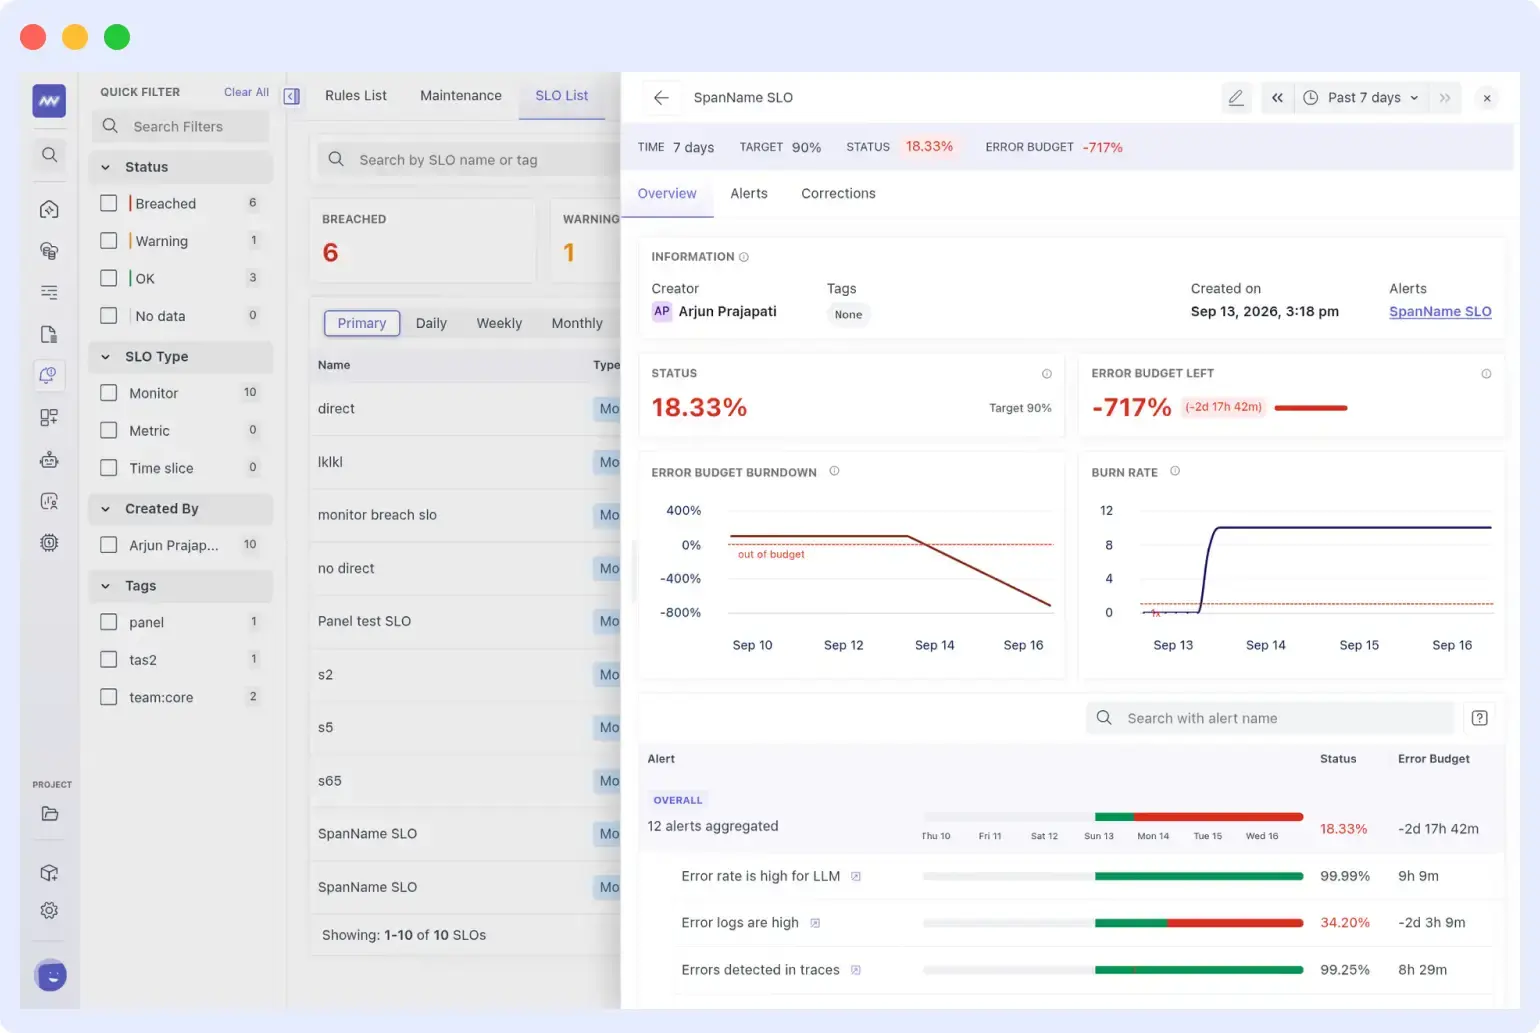
Middleware continuously tracks how much of that error budget has been consumed and how much remains.
This gives teams a more practical way to balance reliability and development velocity.
When plenty of error budget remains, teams may have more flexibility to release new features or make infrastructure changes. When the budget is being consumed quickly, it can signal that reliability work needs more attention.
Instead of making these decisions based on isolated incidents, teams can use the actual reliability performance of the service.
Understand how quickly you’re consuming the budget with burn rates
Knowing that your error budget is being consumed is useful. Knowing how quickly it is being consumed gives you much more context.
The burn rate measures how fast a service is using its error budget.
A burn rate of 1 means the budget is being spent exactly as fast as the target allows across the window. A burn rate of 10 means it’s being spent ten times faster, usually the difference between something to keep an eye on and something to page someone about right now.
A slow burn can indicate a gradual reliability degradation that may become significant over time. A fast burn can signal a more serious issue that could exhaust the error budget quickly.
Middleware lets you monitor burn rates alongside your SLO, so you can distinguish minor reliability changes from issues that require immediate investigation.
Instead of asking
“Are we seeing errors?”
Your team can ask
“How quickly is this issue consuming our reliability budget?”
That context helps teams prioritize incidents based on their impact on service reliability.
Get alerted before reliability becomes a bigger problem
You shouldn’t have to wait until an SLO has already been breached.
Middleware lets you create alerts around SLO performance so your team can respond when reliability is at risk, or the error budget is being consumed too quickly.
With multi-window and multi-burn-rate alerting, you can detect both fast-moving incidents and slower reliability degradation.
You can alert in two ways: when the share of error budget consumed crosses a threshold for example, alert at 90%, warn at 80%- or when the burn rate exceeds a multiple of the allowed pace across both a long window and a short window for example, 6 hours and 30 minutes.
The rule fires only when both windows agree, catching sustained fast burns without paging on a short blip.
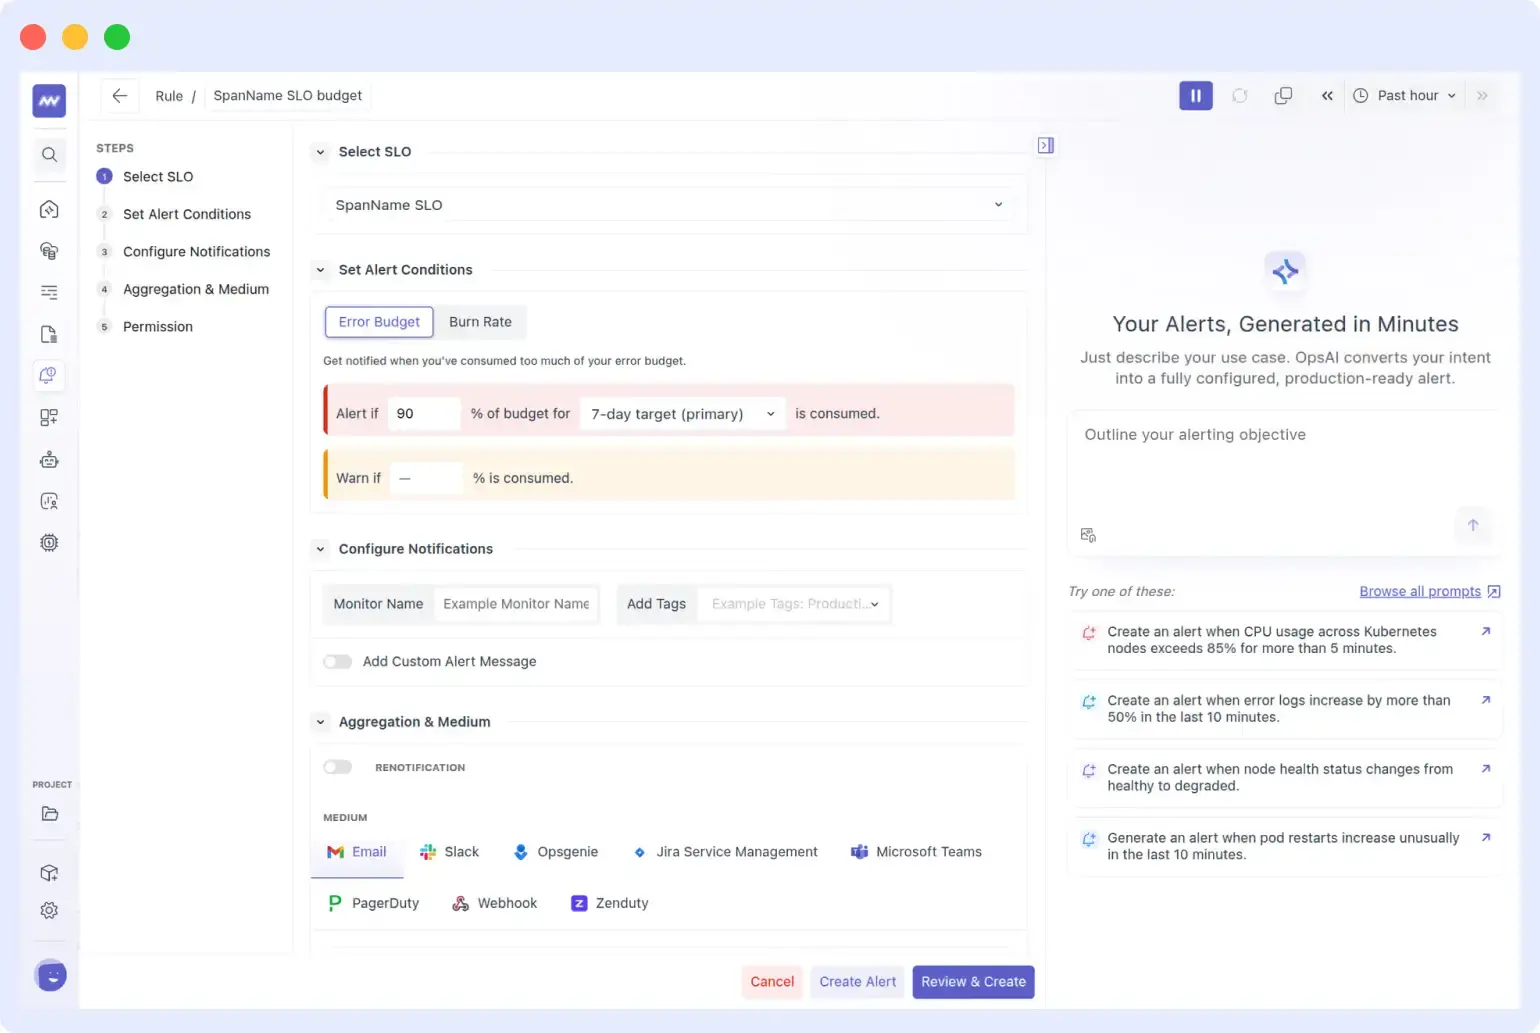
This provides a more meaningful reliability signal than reacting to every individual metric spike or error.
Teams can focus on issues that affect their ability to meet reliability objectives while reducing unnecessary alert noise.
Go from SLO to the underlying issue
An SLO tells you that reliability is changing.
The next question is:
Why?
Middleware connects your SLO directly with the observability data behind it.
When reliability starts degrading, you can move from the SLO into the relevant logs and traces to understand what is driving the change.
For example:
SLO → Error Budget → Issue → Logs & Traces
If the checkout service suddenly starts consuming its error budget faster than expected, you don’t have to jump between disconnected tools or dashboards to investigate the cause.
Your SLO becomes the starting point for deeper troubleshooting.
See how deployments affect reliability
Reliability often changes after a deployment, configuration update, infrastructure change, or other operational event.
Middleware lets you correlate deployment events with SLO performance, helping you identify whether a recent release may have contributed to a reliability issue.
For example:
Deployment → Error rate increases → Burn rate increases → Error budget decreases
This gives developers and SREs additional context when investigating changes in service behavior.
Instead of knowing only that reliability dropped, teams can understand when the change started and what happened around that time.
Monitor all your SLOs from one dashboard
As your environment grows, tracking SLOs service by service quickly becomes difficult. The Middleware SLO Dashboard gives you a single view of reliability across your services.
The SLO List gives you a single view of every SLO in the project: its target, current status, and remaining error budget.
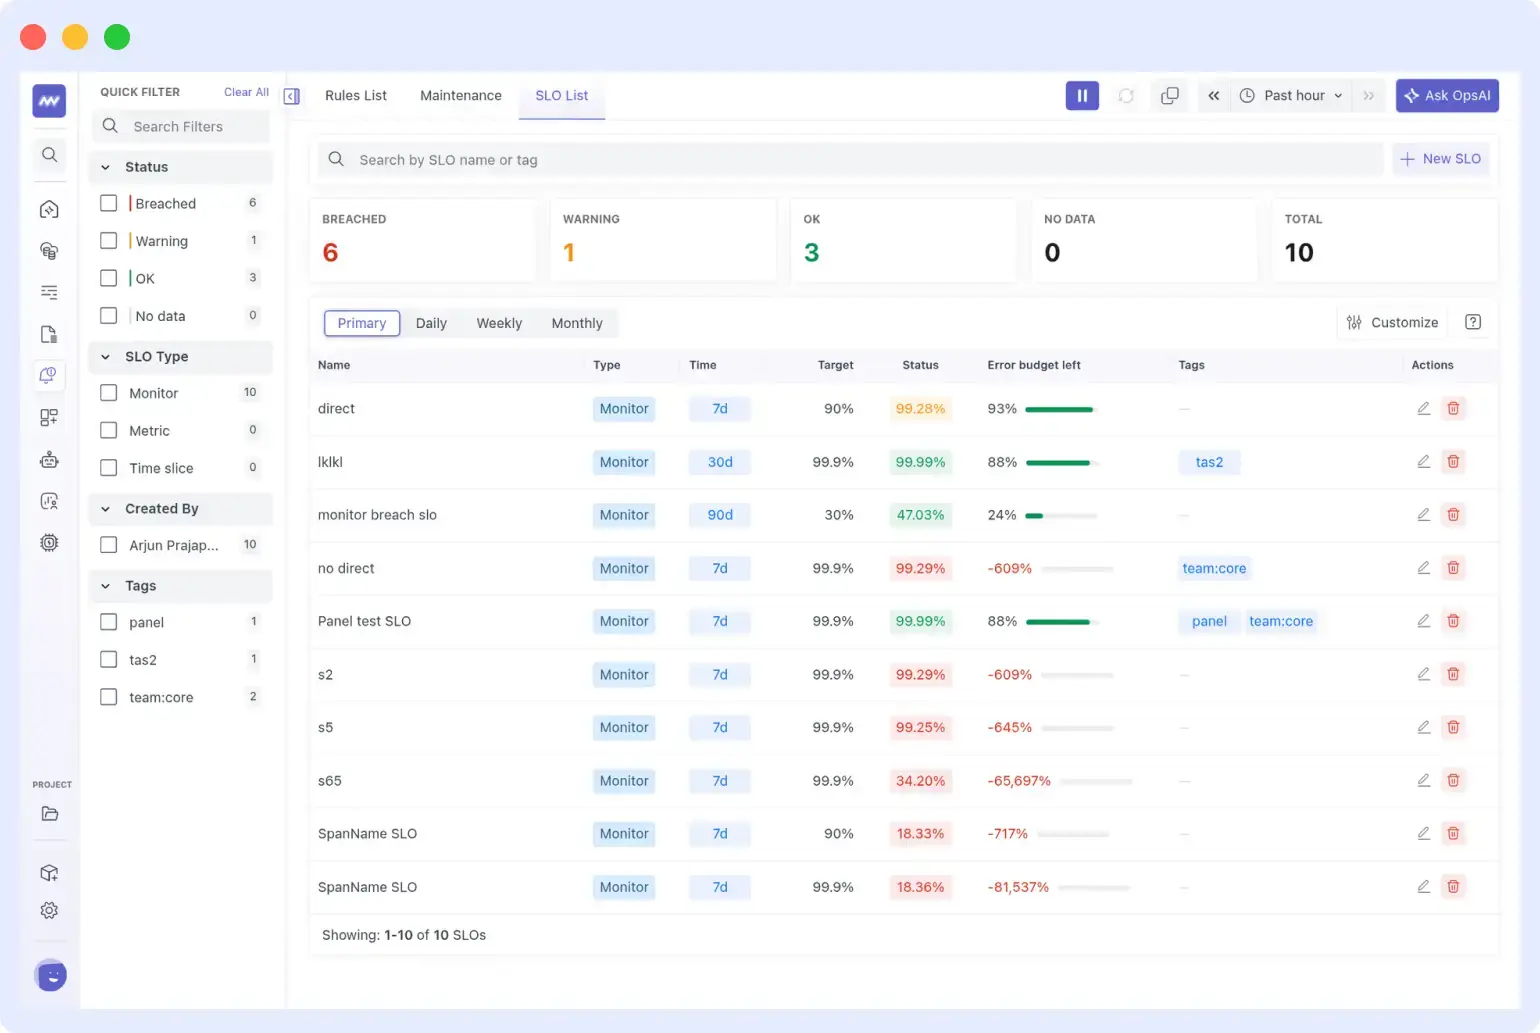
Summary cards let you filter to just the SLOs that are breached or in warning. Switch between daily, weekly, and monthly views to compare recent periods, or filter and search by status, type, creator, or tag.
The dashboard also creates a common reliability view across teams.
Developers and SREs can use it to prioritize investigations. Engineering leaders can understand reliability across services. Business stakeholders can track the reliability of critical services without digging through individual logs, traces, metrics, or alerts.
Make reliability useful across engineering and business teams
SLOs create a shared language for discussing reliability.
Developers and SREs can use error budgets and burn rates to understand when reliability work should take priority.
Engineering leaders can see how reliability is changing across services and identify recurring problem areas.
Business stakeholders can see whether customer-facing and business-critical services consistently meet their reliability targets.
Instead of discussing reliability only when incidents happen, teams can continuously measure it against a clearly defined objective.
Turn observability data into actionable reliability signals
Your observability platform already contains the metrics, traces, logs, alerts, and service data needed to understand system performance.
SLOs add an important layer on top of that data: What level of reliability do we expect, and are we staying within that target?
With Middleware, the reliability workflow becomes:
- Define – Set a reliability target for your service.
- Measure – Continuously evaluate service performance against the SLO.
- Monitor – Track error budgets and burn rates to understand how reliability is changing.
- Alert – Get notified when reliability is at risk, or the error budget is being consumed too quickly.
- Investigate – Drill into the underlying logs and traces to understand what caused the change.
- Improve – Resolve the issue and continue monitoring service reliability.
Make reliability measurable with Middleware SLOs
With the addition of Service Level Objectives, Middleware gives teams a clearer way to move from monitoring individual signals to managing reliability as a measurable engineering objective.
Know your reliability target. Know how much budget you have left. Know when you need to act.
Define reliability targets, track error budgets and burn rates, detect reliability risks earlier, correlate changes with deployments, and investigate the logs and traces behind an issue from the same observability platform.
FAQs
Why do I need SLOs if I already have alerts and dashboards?
Traditional alerts flag individual spikes or outages, but they don’t tell you whether a service is meeting the reliability standard your users expect over time. SLOs turn scattered signals into one measurable target, so your team reacts to real impact instead of every metric blip.
Does every service need an SLO?
No. SLOs are most useful for services your users depend on directly, like checkout, login, or a customer-facing API. Setting one for every low-traffic internal service adds overhead without adding much signal.
What should my team do when an error budget runs out?
Most teams pause new feature releases and shift focus to reliability work until the budget recovers. Treating budget exhaustion as a trigger, not just a number to watch, is what makes SLOs actionable.
How is an SLO different from traditional uptime monitoring?
Uptime monitoring usually just reports whether a service is up or down. An SLO measures the quality of the experience over a time window, error rate, latency, and gives you a consistent target to compare against.
How often should I revisit an SLO target?
Review it when user expectations, traffic, or architecture change significantly, typically every quarter or after a major release. A target set once and never revisited stops reflecting what “reliable” actually means for the service.

