A website monitoring tool is software that continuously tracks a website’s availability, performance, and user experience in real time. These tools measure key indicators, including uptime, page load speed, response time, Core Web Vitals, API performance, and error rates, to help teams detect and resolve issues before they impact users or revenue.
Modern website monitoring tools go beyond basic uptime checks. They combine synthetic monitoring (simulating user interactions), Real User Monitoring (capturing actual user sessions), and infrastructure observability to give teams complete visibility into how their website performs across devices, browsers, and geographies.
In this detailed guide, I’ve shared various monitoring solutions with their impactful features and real-world benefits that will help you track and optimize the website’s performance, uptime, and overall user experience.
What is a website monitoring tool?
A website monitoring tool is a dedicated software designed to track and optimize a website’s health, availability, and overall performance. It is widely used by webmasters, marketers, IT professionals, and businesses of every scale to ensure their online presence remains reliable and effective.
It provides key metrics such as:
- Uptime: Checking if the website is online and available.
- Response Time: Measures how fast the website loads.
- Performance: Analyzing page speed, server response, and other critical factors.
- Security: Detecting potential threats, errors, downtime, or breaches.
14 Best Website Monitoring Tools for 2026
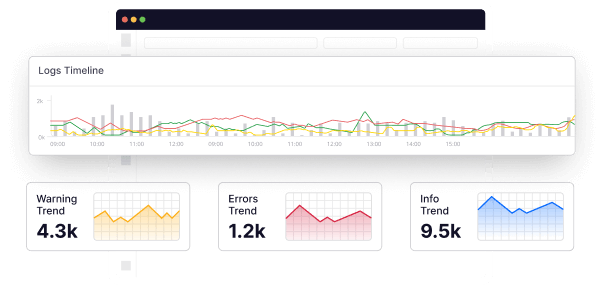
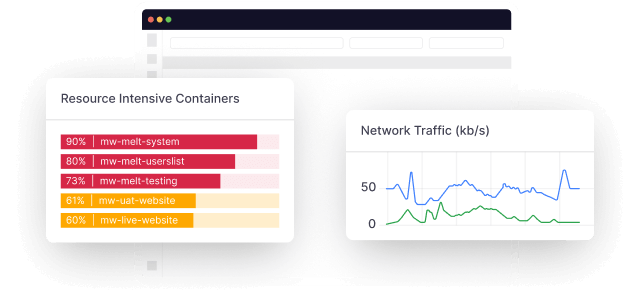
1. Middleware
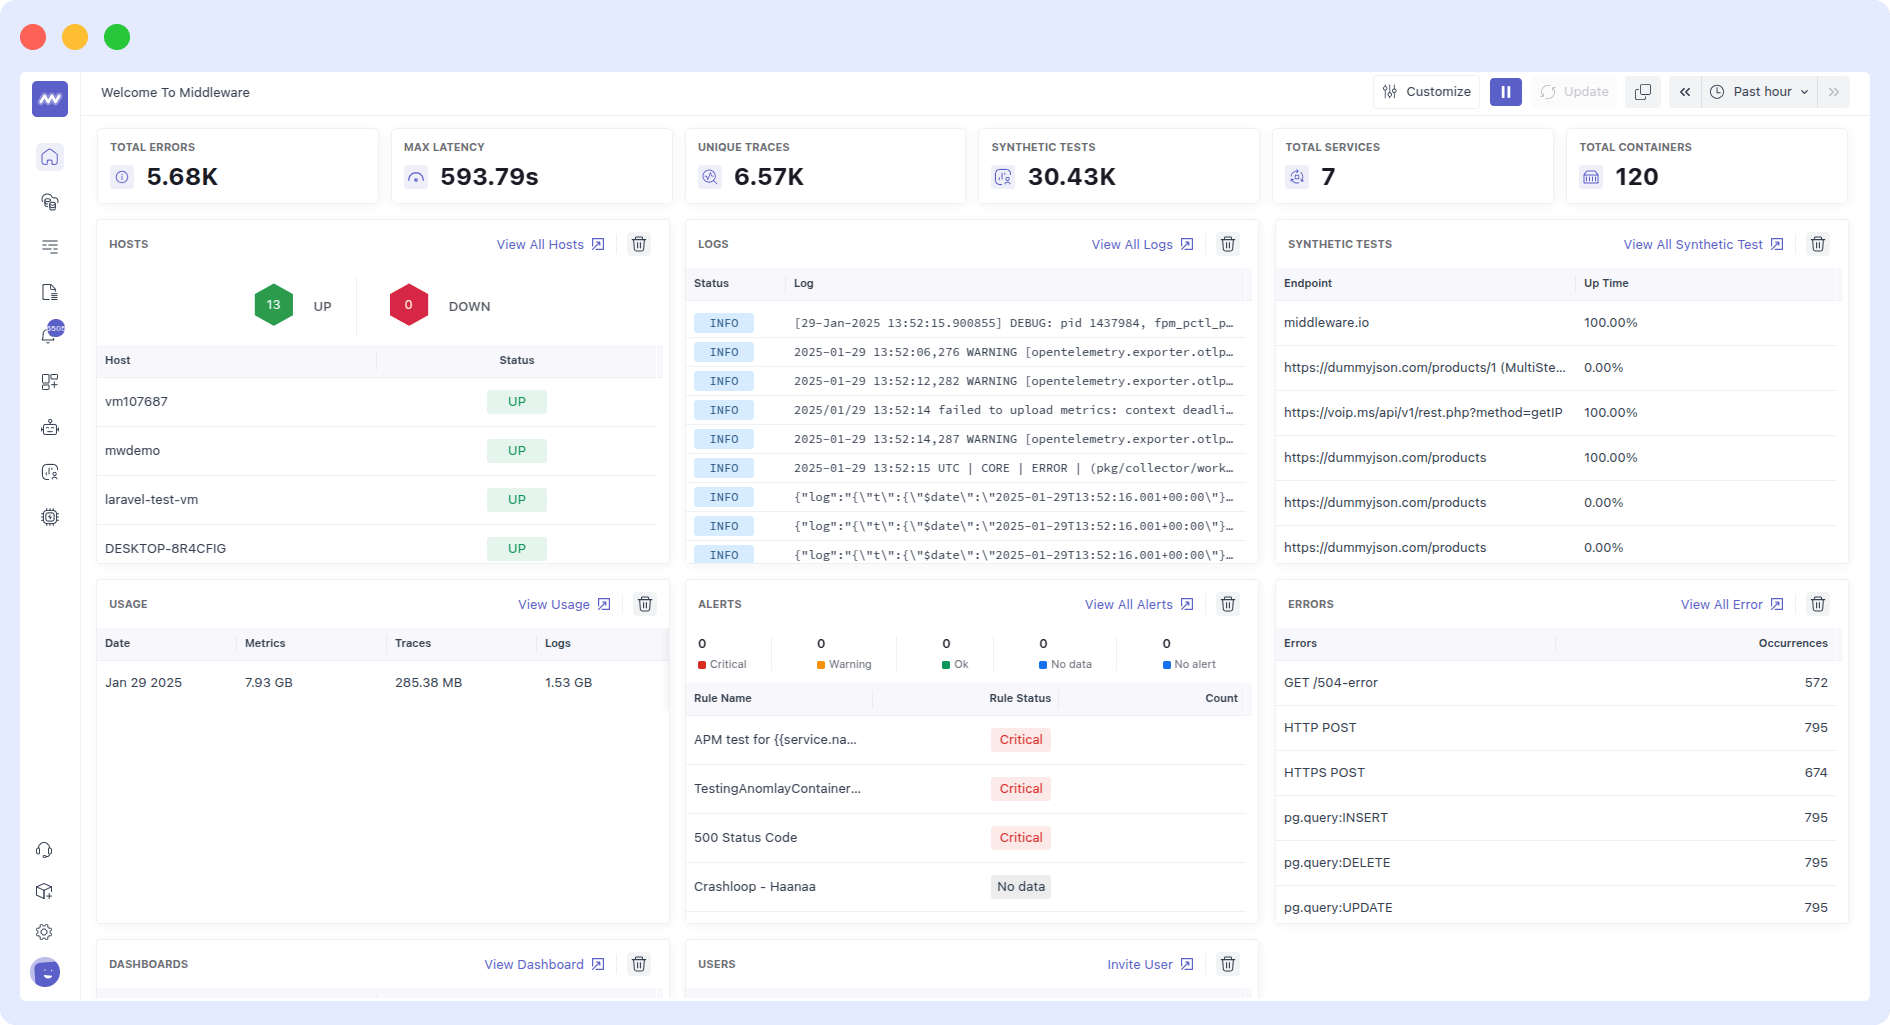
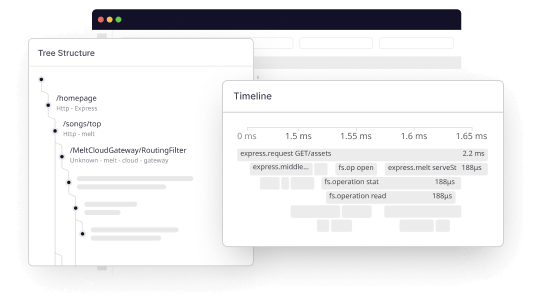
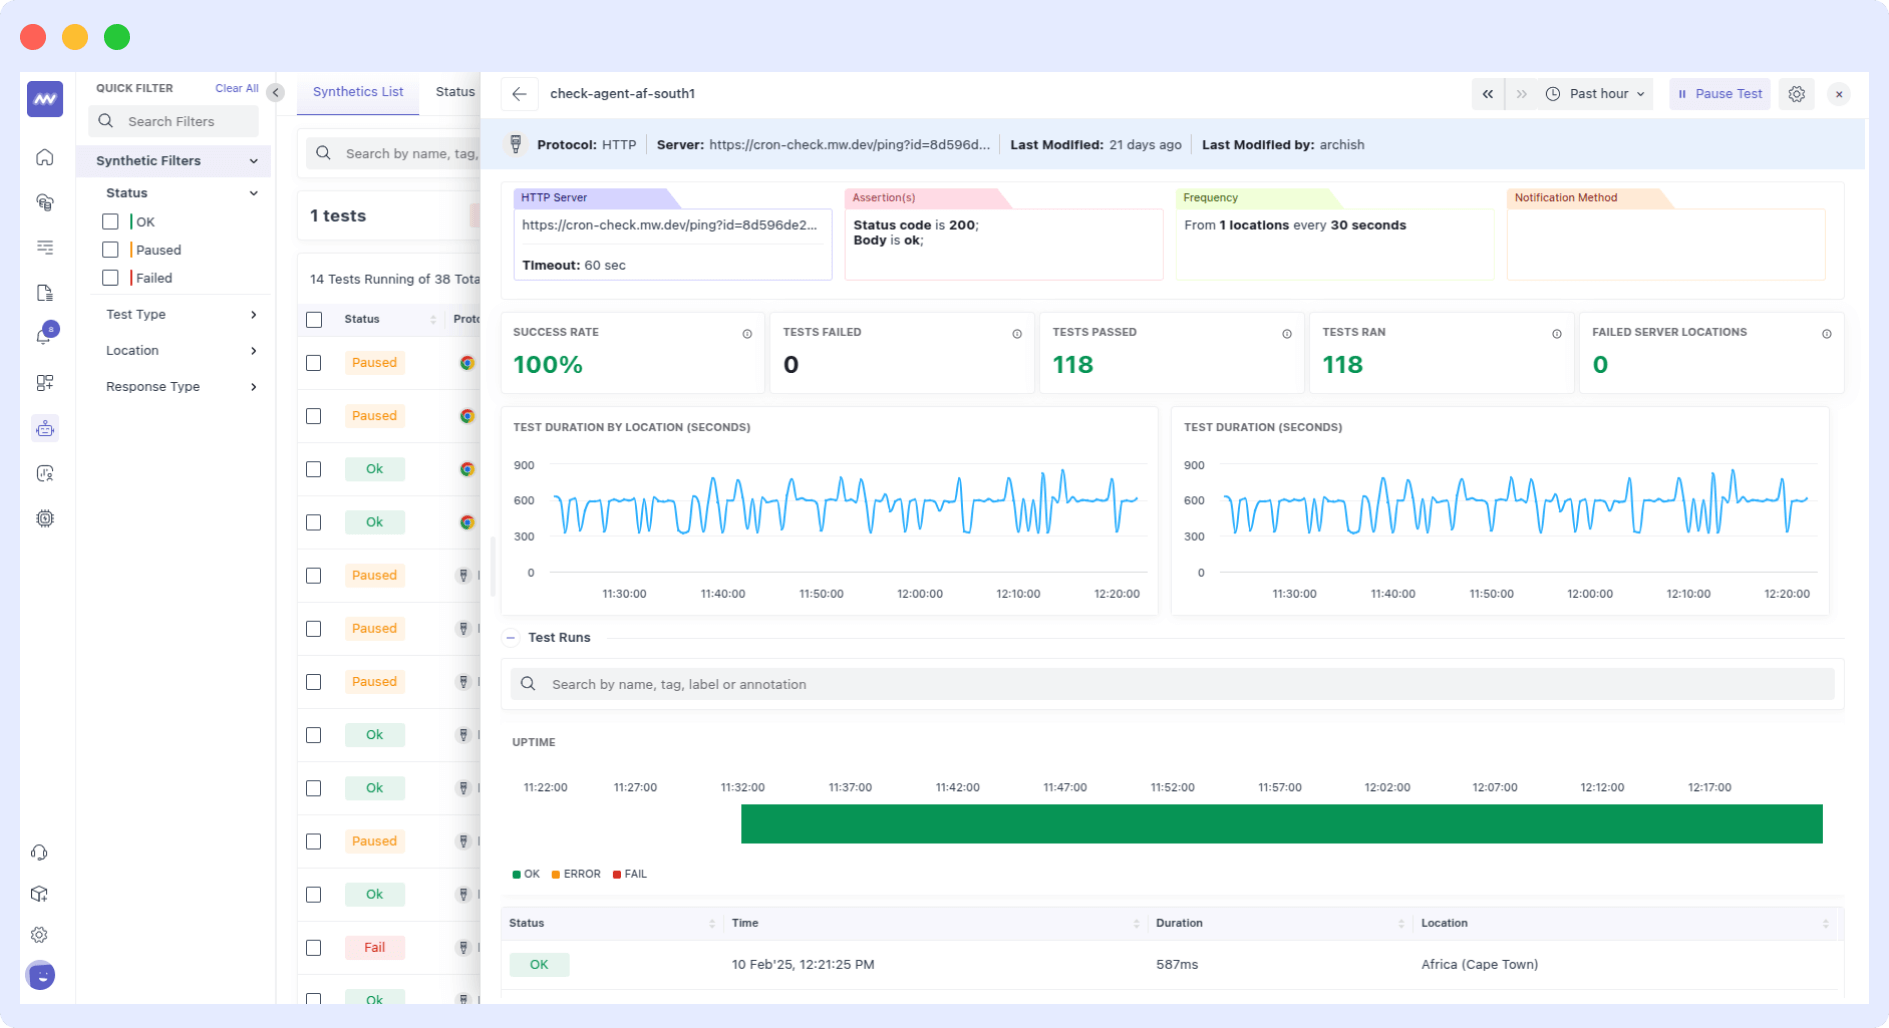
Middleware is a full-stack observability platform that specializes in monitoring, debugging, and improving your entire website and application stack. Using its RUM, Synthetic monitoring, and Browser testing capabilities, developers can monitor websites and gain end-to-end visibility of their performance and health.
Middleware helps you track the performance of APIs at various network levels. Developers can even set up alerts to be notified when there is an anatomy or other issues.
Middleware’s Browser Testing helps you proactively monitor end-to-end user flows with real-time insights, step-by-step screenshots, and session replays. It allows you to run tests across multiple locations, browsers, and devices to gain insights into how different browsers and devices affect UX.
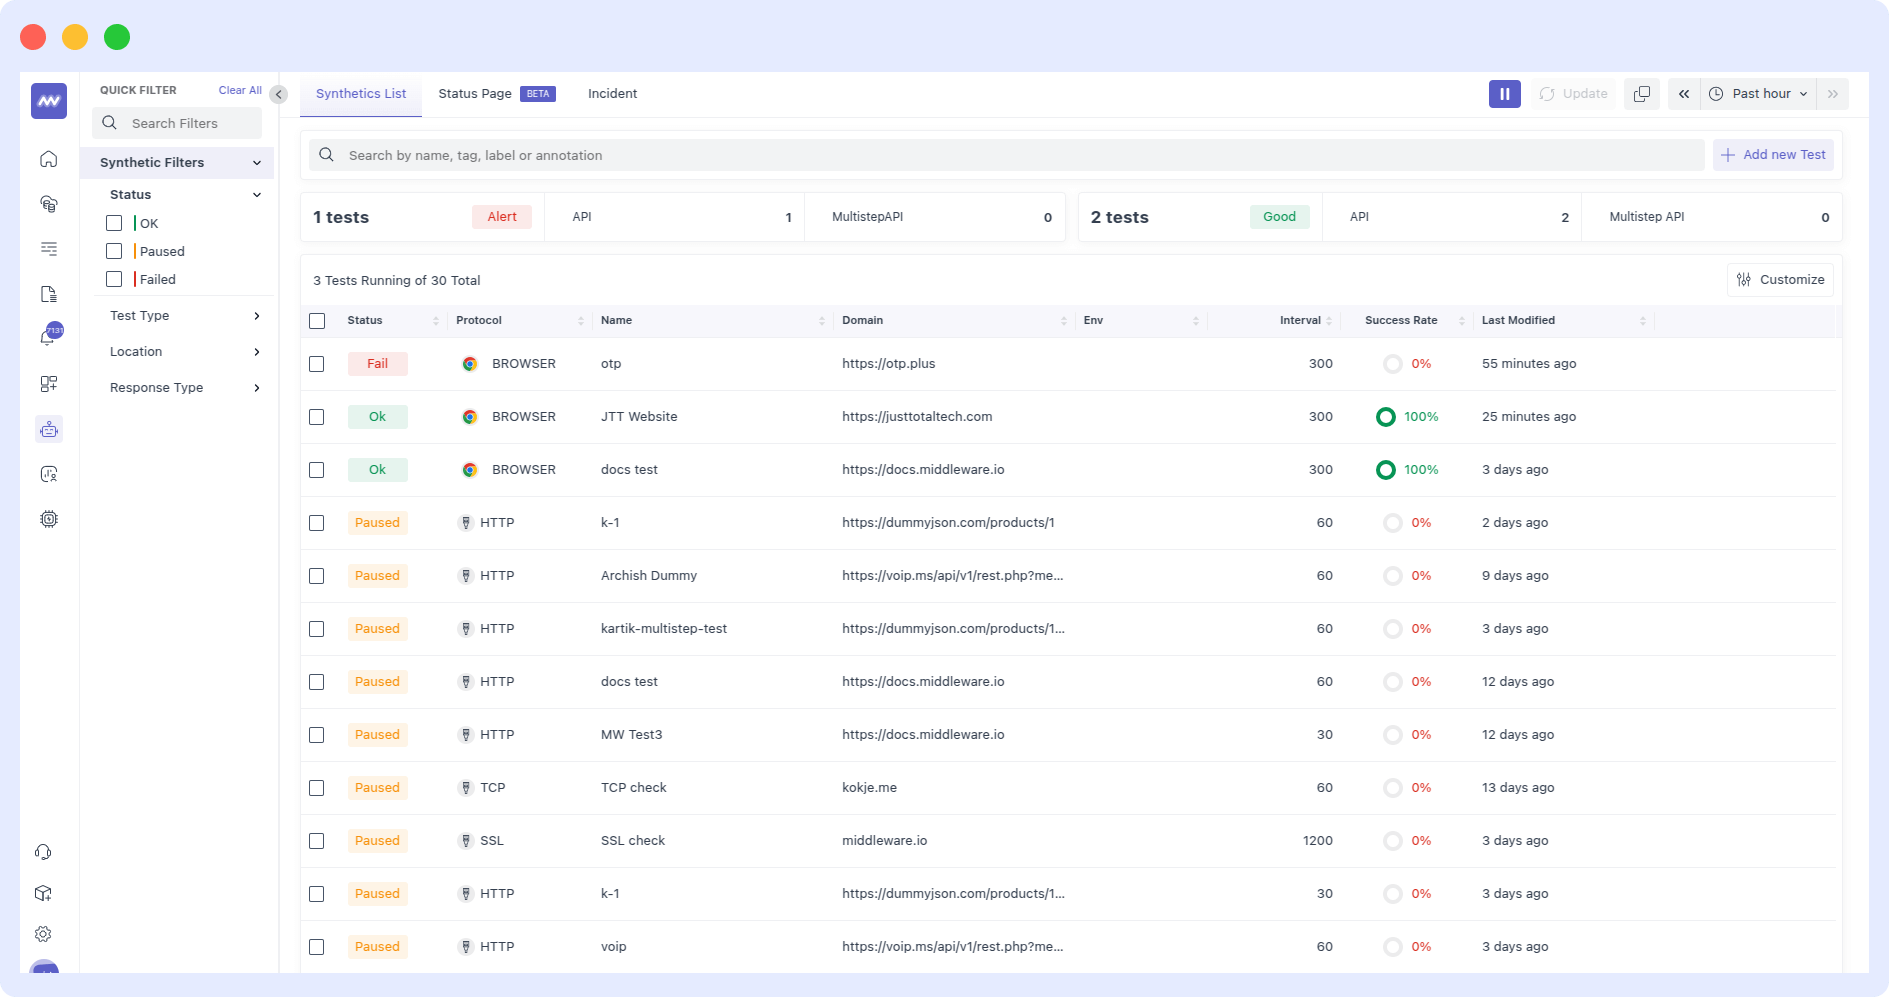
Synthetic Monitoring
Synthetic monitoring actively evaluates and assesses the performance and functionality of a website. Simulating user interactions and transactions provides valuable insights into how the website behaves under different conditions, ensuring a proactive approach to identifying potential issues before real users experience them.
- Performance Testing: Synthetic monitoring tools simulate user interactions, such as measuring page load times, form submissions, and API calls, to analyze the performance of critical website components.
- Transaction Monitoring: Synthetic monitoring enables the creation and monitoring of multi-step transactions, such as login processes or e-commerce transactions. This helps identify any bottlenecks or errors that users might encounter while navigating the website.
- Availability Monitoring: Synthetic monitoring tools regularly check the website’s availability from multiple global locations, ensuring accessibility to users across different geographical regions. This highlights any downtime or performance issues that need attention.
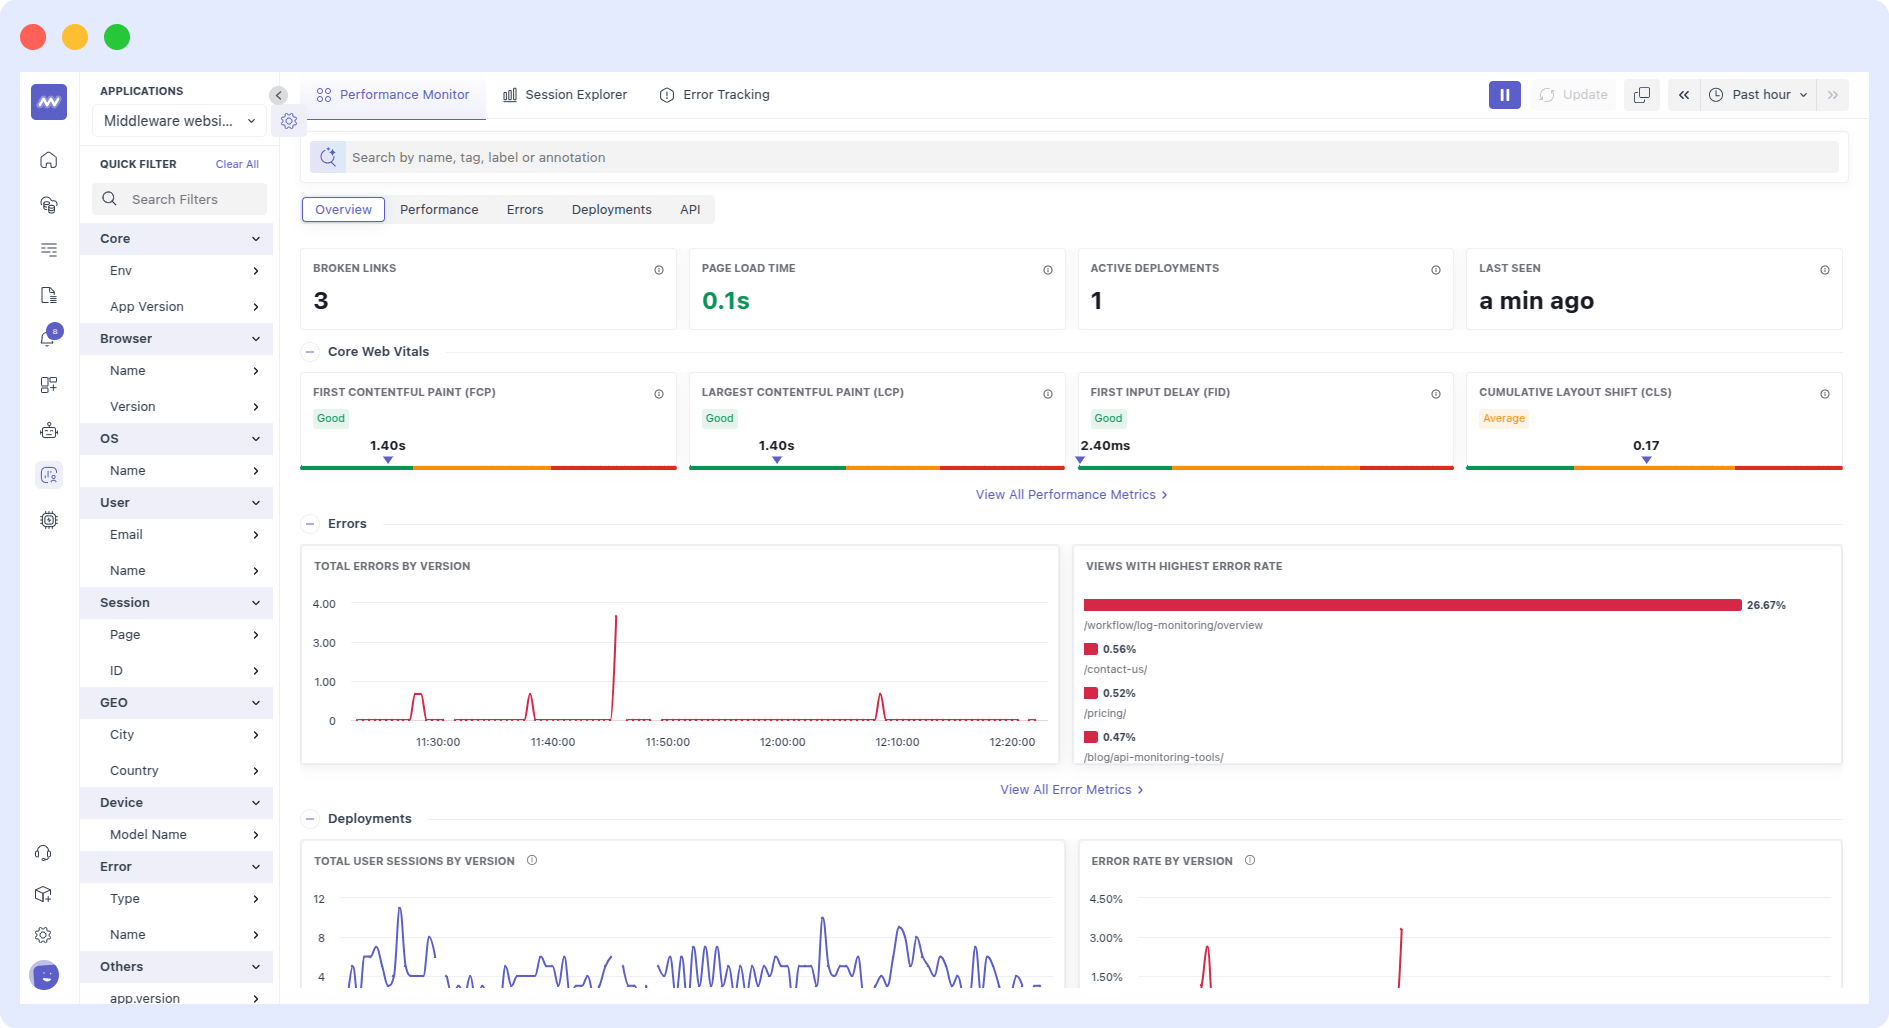
Real User Monitoring
Real User Monitoring (RUM) actively captures and analyzes user data to provide valuable insights into the experiences of real website users. By monitoring user interactions and browsing behavior in real-time, RUM enables website owners to understand how users interact with the website and the performance they actually experience.
- User Experience Analysis: RUM tools capture data on user interactions, such as measuring page load times, click-through rates, and navigation patterns. This data enables the analysis of the user experience and the identification of any performance bottlenecks or usability issues that may impact user satisfaction.
- Device and Browser Performance: RUM tools provide insights into how users experience the website across different devices and browsers. This helps optimize the website for compatibility and performance on various platforms, ensuring a consistent and smooth user experience for all visitors.
- Geographic and Demographic Insights: RUM tools track user data based on geographic location and demographic information. This data enables businesses to understand their user base and tailor their website’s performance and content to specific audience segments.
Some of the Key features
- Visualize website performance and uptime data alongside key business metrics to find issues faster.

- Monitor API endpoint performance with automated API testing and monitor results with various graphs and parameters.
- View a breakdown of network timing data and response time by location for faster root cause analysis.
- Leverage synthetic monitoring to measure the uptime of API endpoints.
- To improve the customer experience, look at core vitals such as largest contentful paint (LCP), First Input Delay (FID), and cumulative layout shift (CLS).
- Get your users’ journeys recorded for each session to understand them better.
Pros:
- Easy and quick to set up. Developers can start monitoring in as little as a minute.
- Interactive and customizable dashboard for monitoring.
- Middleware can correlate issues faster, enabling developers to improve the user experience.
- View session replays to understand your user behavior.
- Fosters proactive monitoring to help developers spot any issues before it impacts the end-user.
Cons:
- Supports limited tech stack; WordPress, Node Js, React Js, and next.js Vercel for now.
Pricing:
- 14-day free trial with unlimited data ingestion, 10 browser tests, and 2M OpsAI tokens. No credit card required.
- Pay-as-you-go plan:
- $0.30/GB for metrics, logs, and traces
- Synthetic monitoring: $2 for 10K synthetic checks
- Real user monitoring: $1 per 1000 sessions/month
2. Datadog
Datadog is a comprehensive monitoring and analytics platform that provides businesses with real-time visibility into their infrastructure, applications, and user experience.
With Datadog, businesses can monitor their website’s performance, track key metrics, and receive alerts for any issues or anomalies.
Datadog offers features such as server monitoring, application performance monitoring (APM), log management, and synthetic monitoring.
Key features
- Monitor endpoints with API tests, validating system layers from worldwide locations for comprehensive coverage and faster root cause analysis.
- Verify critical transactions and workflows with step-by-step screenshots, waterfall visualizations, and meaningful assertions to ensure accurate user experiences.
- Incorporate synthetic tests into CI pipelines, automate rollbacks, and eliminate separate testing scenarios to improve collaboration and minimize downtime.
Pros:
- Enables monitoring from multiple global locations.
- Offers both internal and external monitoring.
- Provides near real-time updates.
Cons:
- The cost of log storage and retention can be high.
- Complex installation.
- Steep learning curve.
Pricing:
- The free plan includes core collection and visualization features, with 1-day metric retention and up to 5 hosts.
- The Pro plan starts at $15 per host, per month (billed annually) or $18 on-demand. It includes features like alerts, container monitoring, and custom metrics, with 15-month metric retention.
- The Enterprise plan starts at $23 per host, per month (billed annually) or $27 on-demand. It includes advanced features like machine learning-based alerts, live processes, and customizable metric retention.
3. Dotcom-Monitor
Dotcom-Monitor is a premier synthetic monitoring solution that delivers real-time insights into your website’s performance. With features like uptime monitoring, real browser testing, instant alerts, application performance monitoring, and global monitoring from multiple geolocations, Dotcom-Monitor ensures your website stays accessible and efficient.
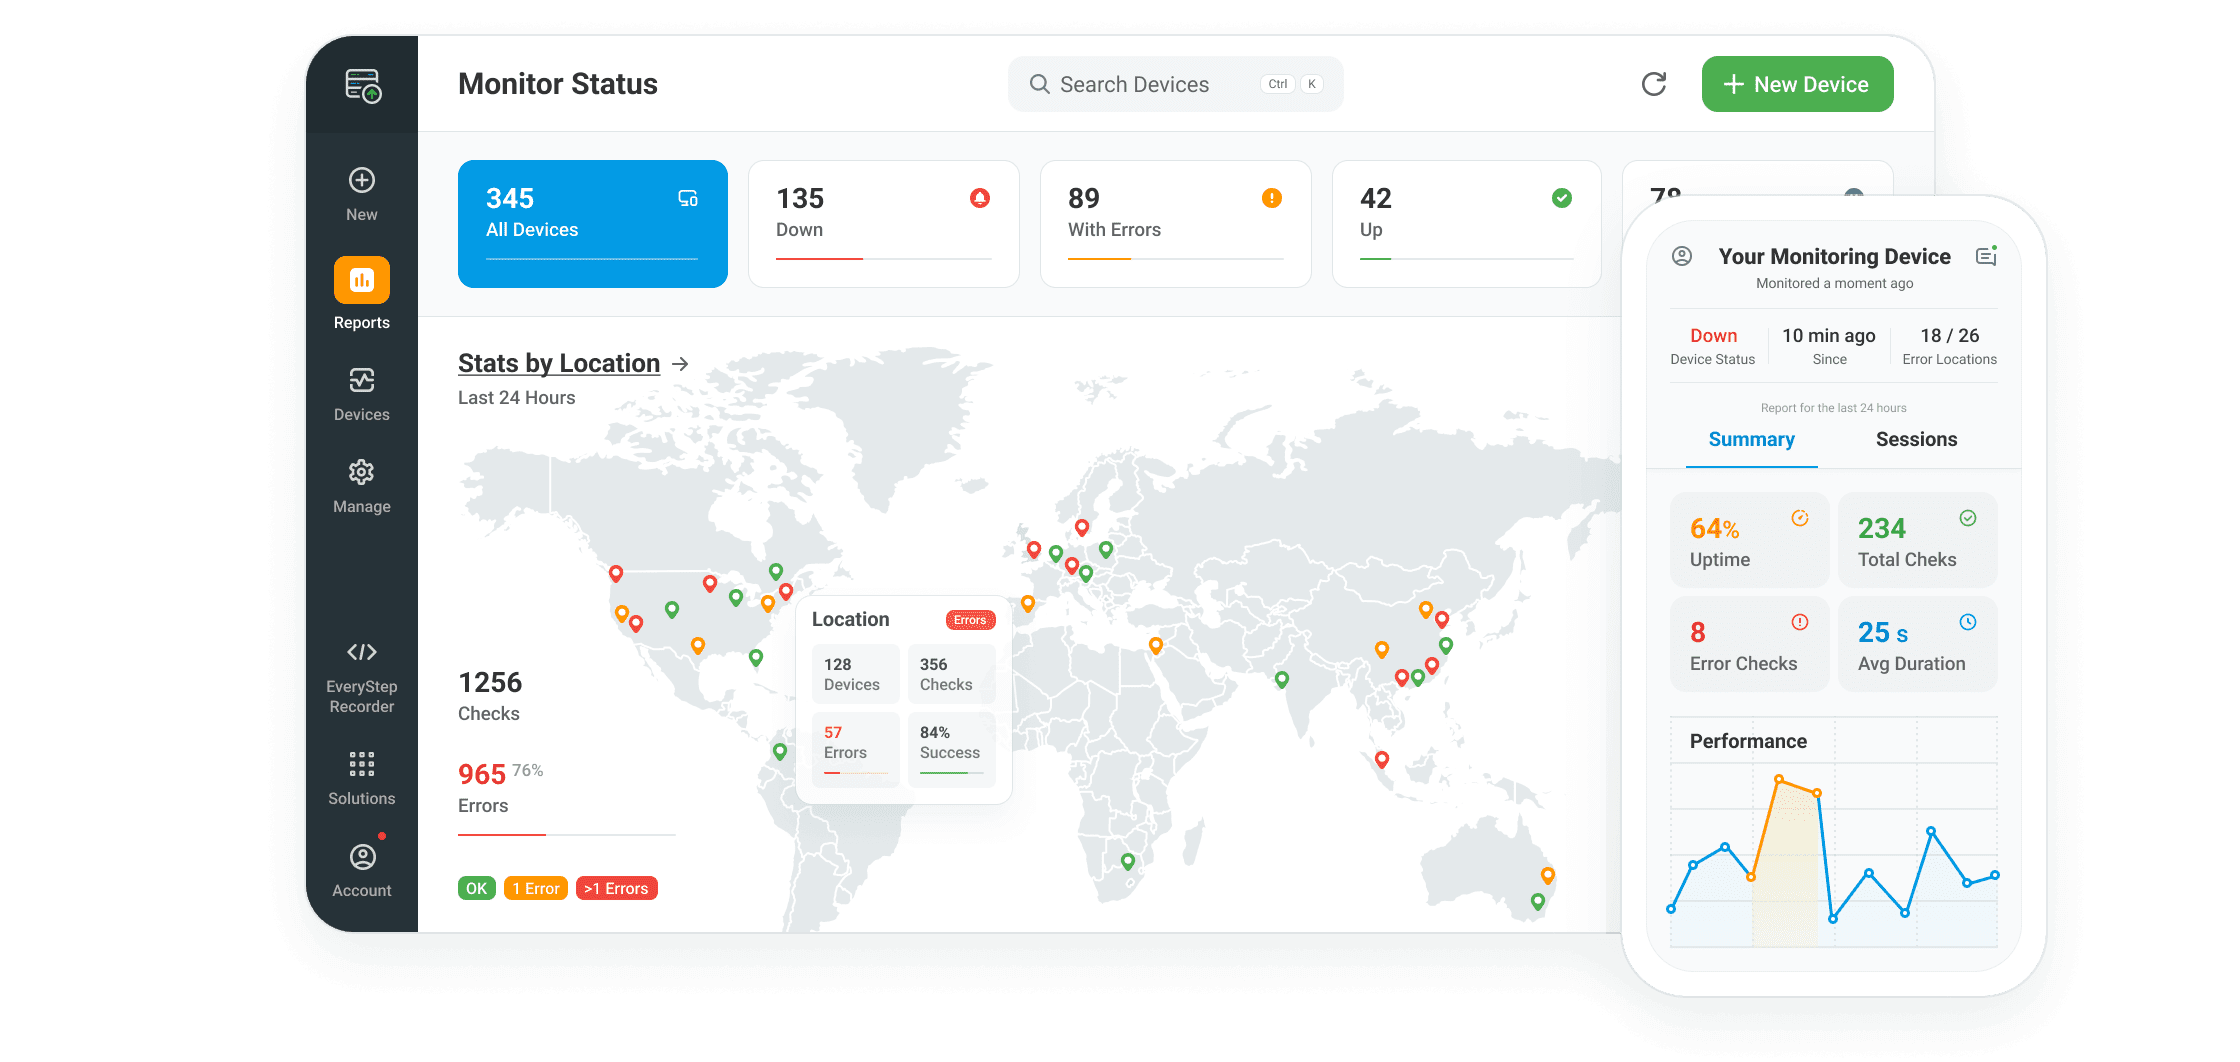
Dotcom-Monitor’s platform also supports website, server, and application monitoring that provides businesses with end-to-end, real-time visibility into their performance. With advanced reporting and alerting features, the platform helps teams stay informed and connected while being able to respond swiftly to any disruptions.
Key features
- Use real web browsers to monitor websites to ensure accurate performance data and user experience validation.
- Test and monitor website performance from over 30 global locations to ensure your websites are accessible and fast for users globally.
- Simulate user interactions with your web applications to monitor your most critical transactions and workflows with the EveryStep Web Recorder.
Pros
- Extensive range of monitoring protocols and customizable monitoring options.
- Real browser monitoring for accurate user experience insights.
- Global coverage with 30+ monitoring locations.
Cons
- There’s no RUM as Dotcom-Monitor specializes in synthetic monitoring.
Pricing
- Websites and APIs: Starts at $19.99/month, with a minimum of 10 targets.
- Internet Infrastructure: Starts at $40.00/month, with a minimum of 5 targets.
- Page Performance: Starts at $29.96/month, with a minimum of 5 web pages.
- Web Applications: Starts at $38.95/month, with a minimum of 5 steps.
4. Zipy
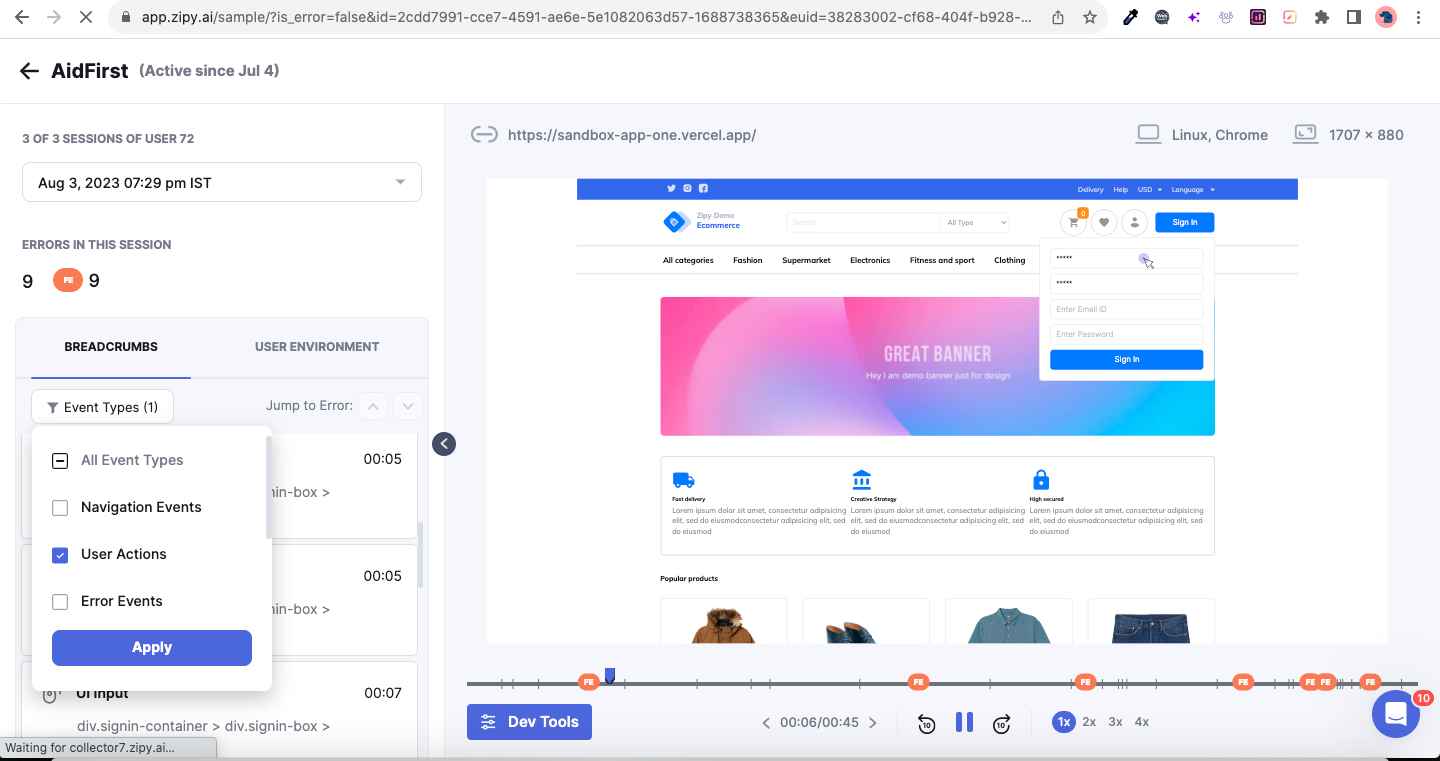
Zipy is a digital experience tool that records user sessions, tracks site errors, and helps you debug issues. It helps you identify gaps in user experience and fix them, resulting in better conversion rates, product adoption, and user retention.
With Zipy, against every session, you can see the user events, user environment info, errors that occurred, and log details.
Key features
- Track website errors and performance issues, resolve them using AI and make sure your users have a consistent experience.
- Monitor website visitors in real-time and figure out any rage clicks or frustration issues on web pages.
- Track user events, including clicks, scrolls, page navigation, user environment, OS, browser, geography, and IPs.
Pros
- Real-time monitoring of website visitors and errors.
- Error Monitoring, API Performance, and Session Replay – all in one tool.
- User-friendly and very easy to implement. Takes just a minute to get started.
Cons
- Features like performance monitoring and Jira integration are not available in the basic plan.
Pricing
- Zipy offers a 14-day free trial with limited features. The paid version starts at $49/month.
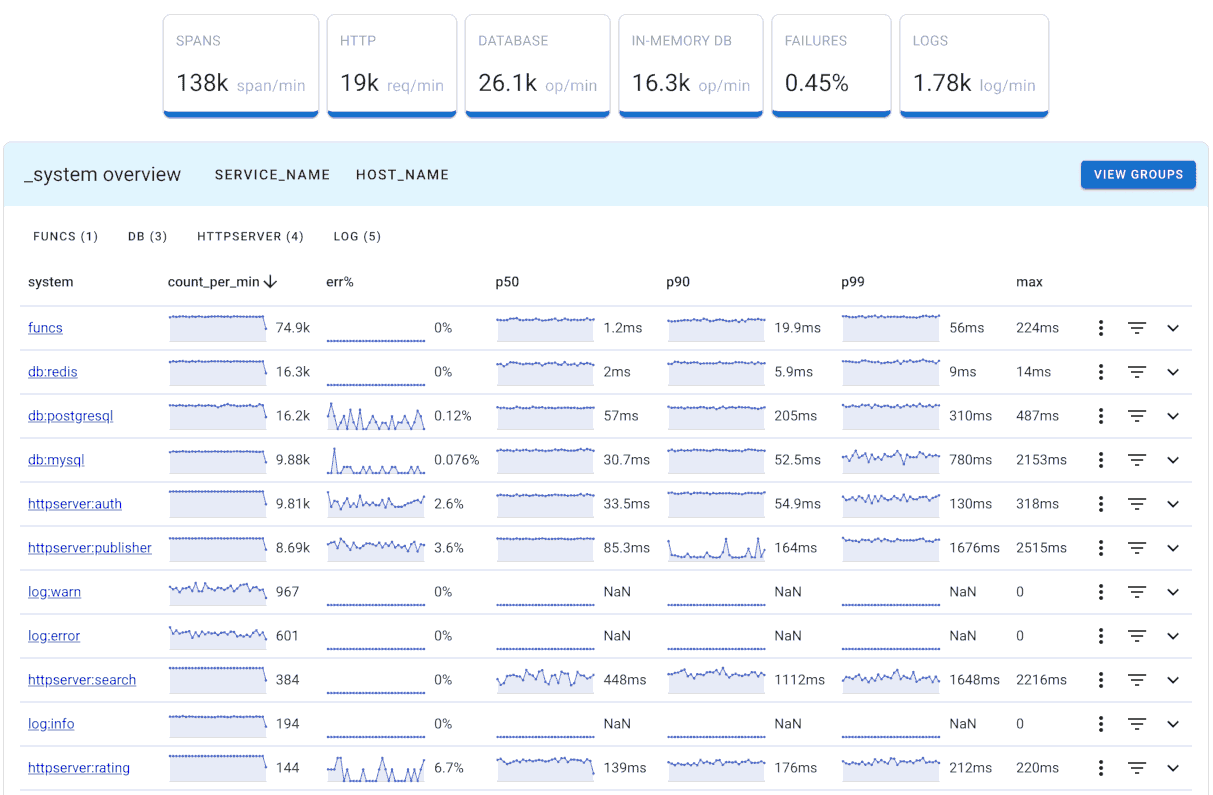
5. Uptrace
Uptrace is a comprehensive observability platform that gives developers real-time visibility into their applications’ performance, errors, and infrastructure metrics. With Uptrace, teams can monitor, debug, and optimize applications using distributed tracing, metrics monitoring, and error tracking capabilities.
Key features
- Advanced distributed tracing with OpenTelemetry support for end-to-end visibility into system performance.
- Real-time metrics collection and visualization with custom dashboards and alerts.
- Error tracking and aggregation with detailed context for faster debugging
- SQL query performance monitoring and optimization tools.
- Built-in APM features for popular frameworks and technologies.
Pros
- Unified platform for traces, metrics, and errors.
- Native OpenTelemetry integration.
- Easy to set up and maintain.
- Comprehensive visualization tools.
Cons
- Limited third-party integrations.
- The community edition has feature limitations.
- Documentation could be more detailed.
Pricing
- The free tier includes basic monitoring features with limited retention.
- The pro plan starts at $0.10 per million spans.
- Enterprise plans offer custom pricing based on usage.
- Self-hosted option is available for all plans.
6. Sematext
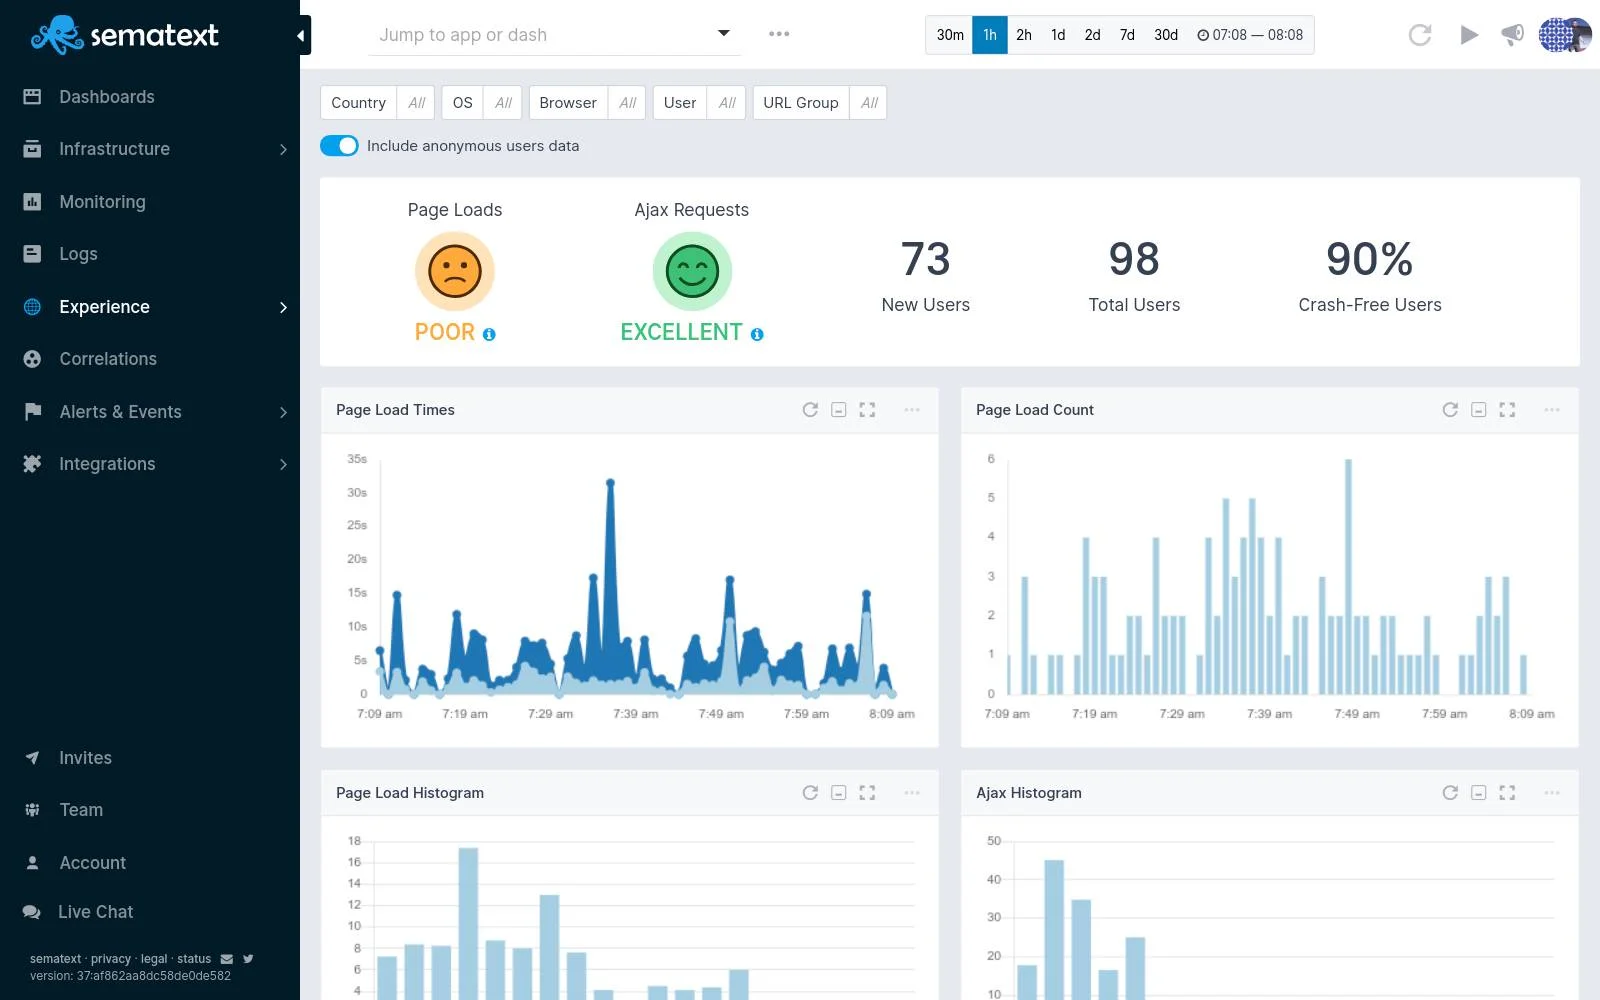
Sematext is a reliable website monitoring tool that provides real-time performance monitoring and alerting. It offers Sematext Cloud, a comprehensive solution for infrastructure and application performance monitoring and log management.
This integrated solution provides businesses with full-stack visibility, consolidating logs, metrics, and traces into a unified platform.
Key features
- Measure and track the performance of your web pages, ensuring a fast and responsive user experience.
- Track network timings at various layers, including DNS, TCP, SSL, and HTTP.
- Track the performance and adherence to Service Level Agreements (SLAs) of third-party services integrated with your website, ensuring they do not negatively impact overall performance.
Pros:
- Easy to set up.
- Sematext offers fully managed Elasticsearch and Kibana.
- Offers server uptime monitoring.
Cons:
- Complexity of Small Applications.
Pricing:
- Synthetic Monitoring: This plan is priced based on the number of monitors and runs. The Pay-As-You-Go plan costs $2 per HTTP monitor and $7 per Browser monitor.
- Infrastructure Monitoring: This plan is priced per host, with costs depending on the number of hosts, containers, plan, and data retention.
- Logs Management: Pricing for this plan depends on daily log volume, retention duration, and the selected plan. The Basic plan costs $0.1/GB for data received and $0.15/GB for data stored.
- Experience Monitoring: This plan is priced based on page views per day and data retention. The Startup plan costs a specified amount per month for 25k views/month.
7. Uptime.com
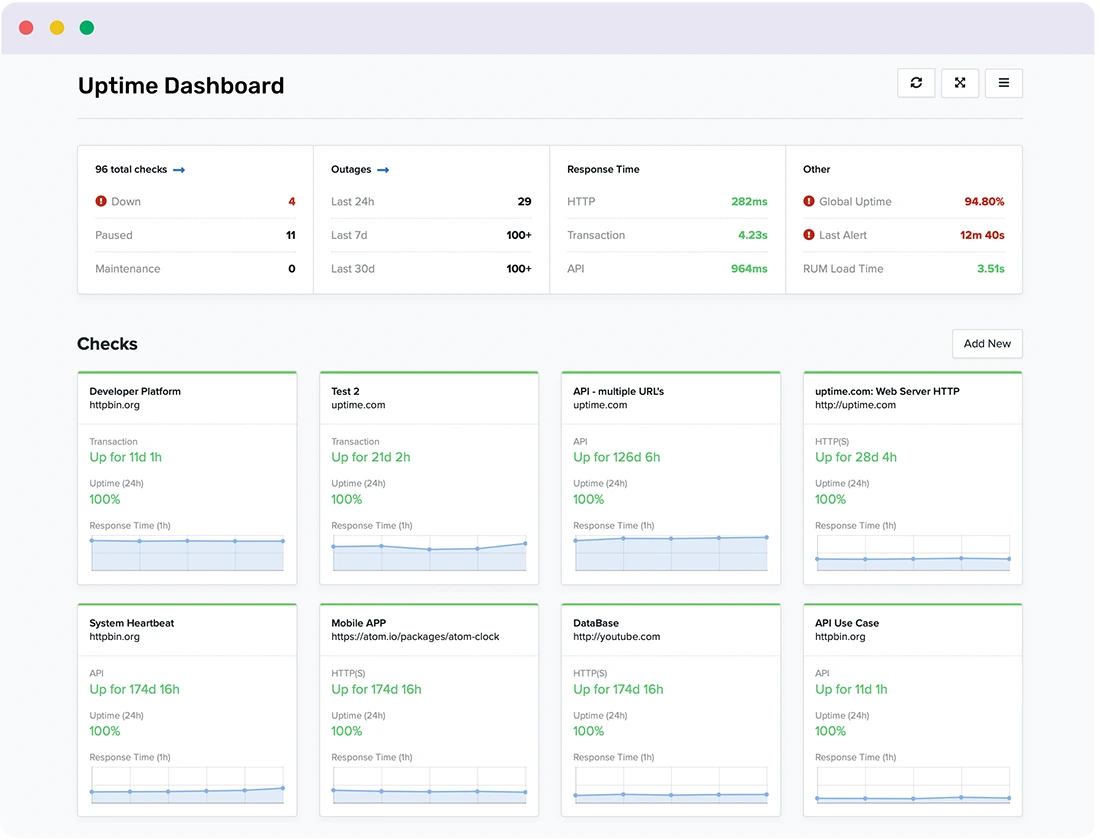
Uptime.com is a reliable website monitoring tool that helps businesses ensure their websites are accessible and functioning properly. With Uptime.com, businesses can proactively monitor their website’s uptime and receive alerts in real-time if any issues occur.
This tool offers a range of features to track website performance, including server monitoring, SSL certificate monitoring, and transaction monitoring.
Key features
- Quickly diagnose and resolve website speed issues by comparing page trends, evaluating errors, and identifying root causes with Uptime.com’s RUM.
- Identify and reference 4xx, 5xx, and JavaScript issues impacting URLs to confirm whether systems function correctly or whether site-wide issues exist.
- Monitor both user experience and uptime in a single platform, empowering precise development efforts to enhance frontend performance.
Pros:
- Quick and easy setup
- User-friendly and intuitive dashboard
- Offers a free trial without requiring credit card information
Cons:
- Lacks an intermediate tier between the basic and advanced plans
- Notification settings may be limited
Pricing:
- Starter: This plan starts at $20/month (or $24/month when paid annually). It includes basic monitoring necessities like 30+ basic checks, 1+ transaction checks, 1+ API checks, and more.
- Essential: The Essential plan starts at $67/month (or $80/month when paid annually). It includes everything in the Starter plan, plus additional features like 50+ basic checks, 5+ transaction checks, and 10+ API checks.
- Premium: This plan starts at $285/month (or $342/month when paid annually). It includes all the features from the Essential plan, plus advanced features like 200+ basic checks, 15+ transaction checks, and 20+ API checks.
8. Dynatrace
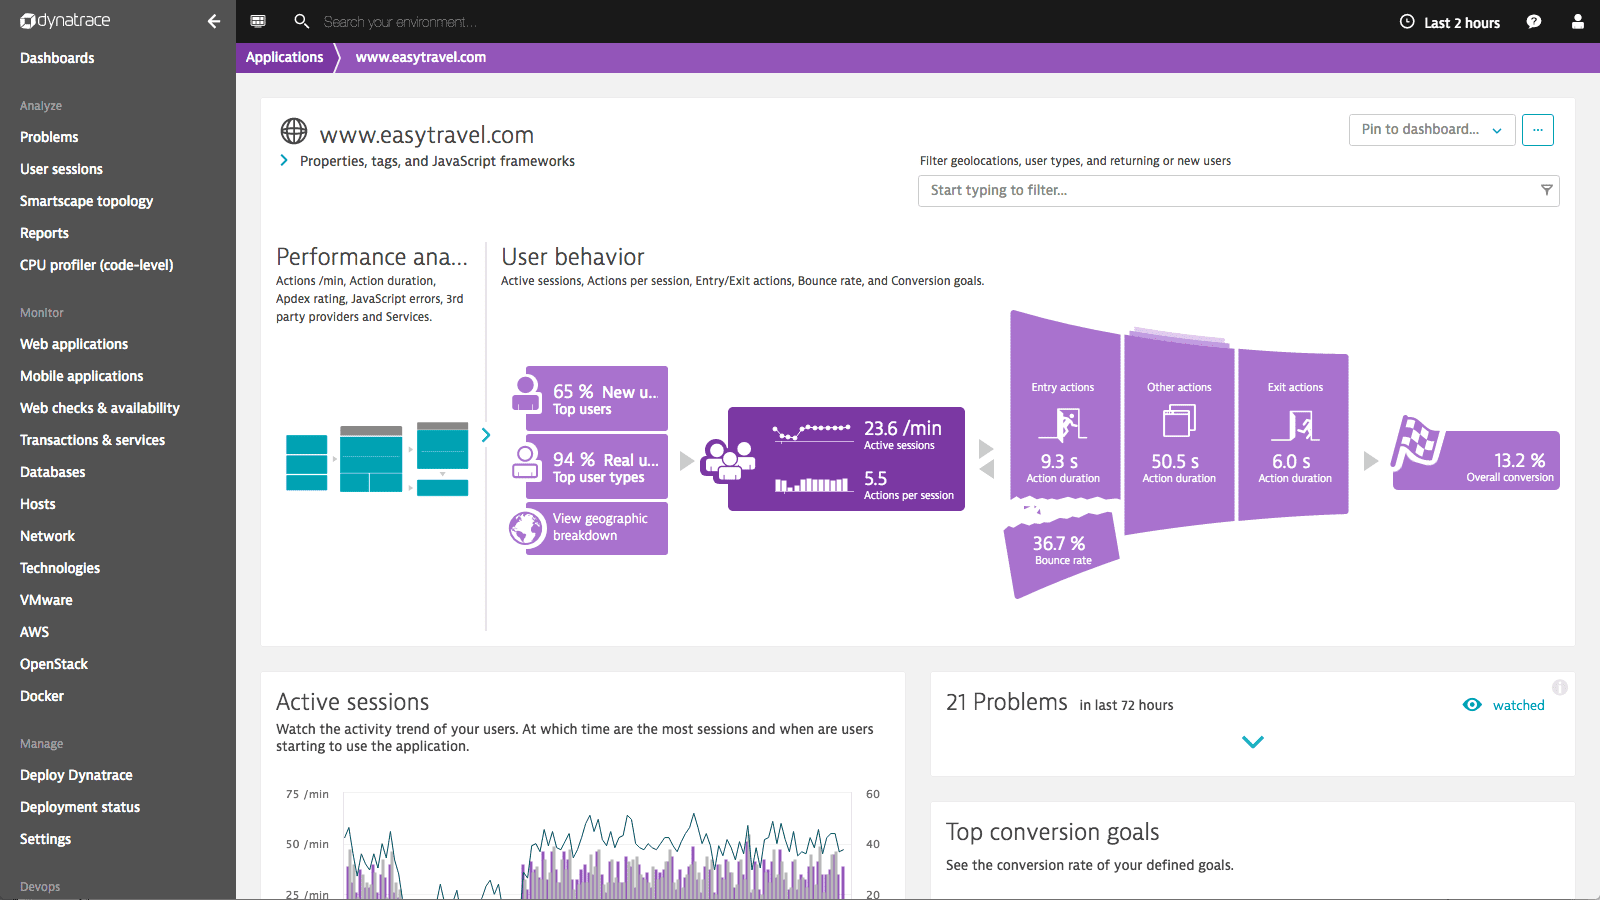
Dynatrace is an advanced monitoring and observability platform that provides comprehensive insights into the performance and health of your applications, infrastructure, and user experience.
With Dynatrace, you can gain real-time visibility into the entire stack, detect anomalies, and troubleshoot issues before they impact your users.
Key features
- Boost team productivity with Dynatrace’s AI-assistance, which monitors infrastructure, detects anomalies, and delivers precise answers prioritized by business impact.
- Gain deeper insights into system performance by extending infrastructure observability to log data with custom metrics.
- Break down application and infrastructure silos with Dynatrace’s all-in-one monitoring solution, providing a unified view and AI-driven analysis for precise root cause determination.
Pros:
- User-friendly interface.
- Compatible with both Windows and Linux operating systems.
- Operates in the cloud, eliminating the need for installation or on-premise servers.
Cons:
- May pose challenges for non-technical users.
- Primarily designed for enterprise use.
Pricing:
- Full-Stack Monitoring – $0.08 per hour for 8 GiB host
- Infrastructure Monitoring – $0.04 per hour for any size host
- Real User Monitoring – $0.00225 per session
9. New Relic Browser
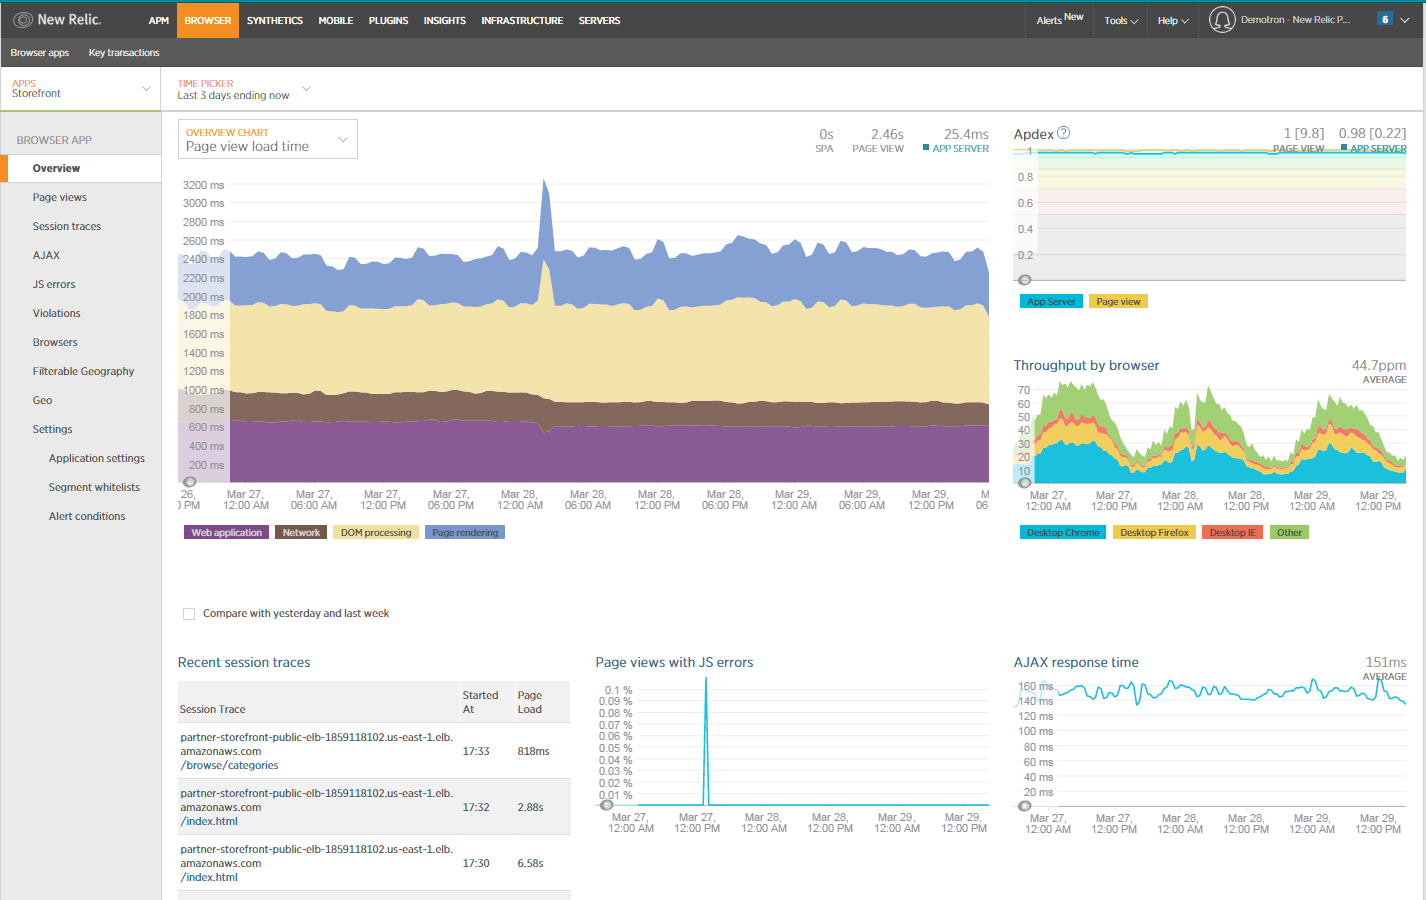
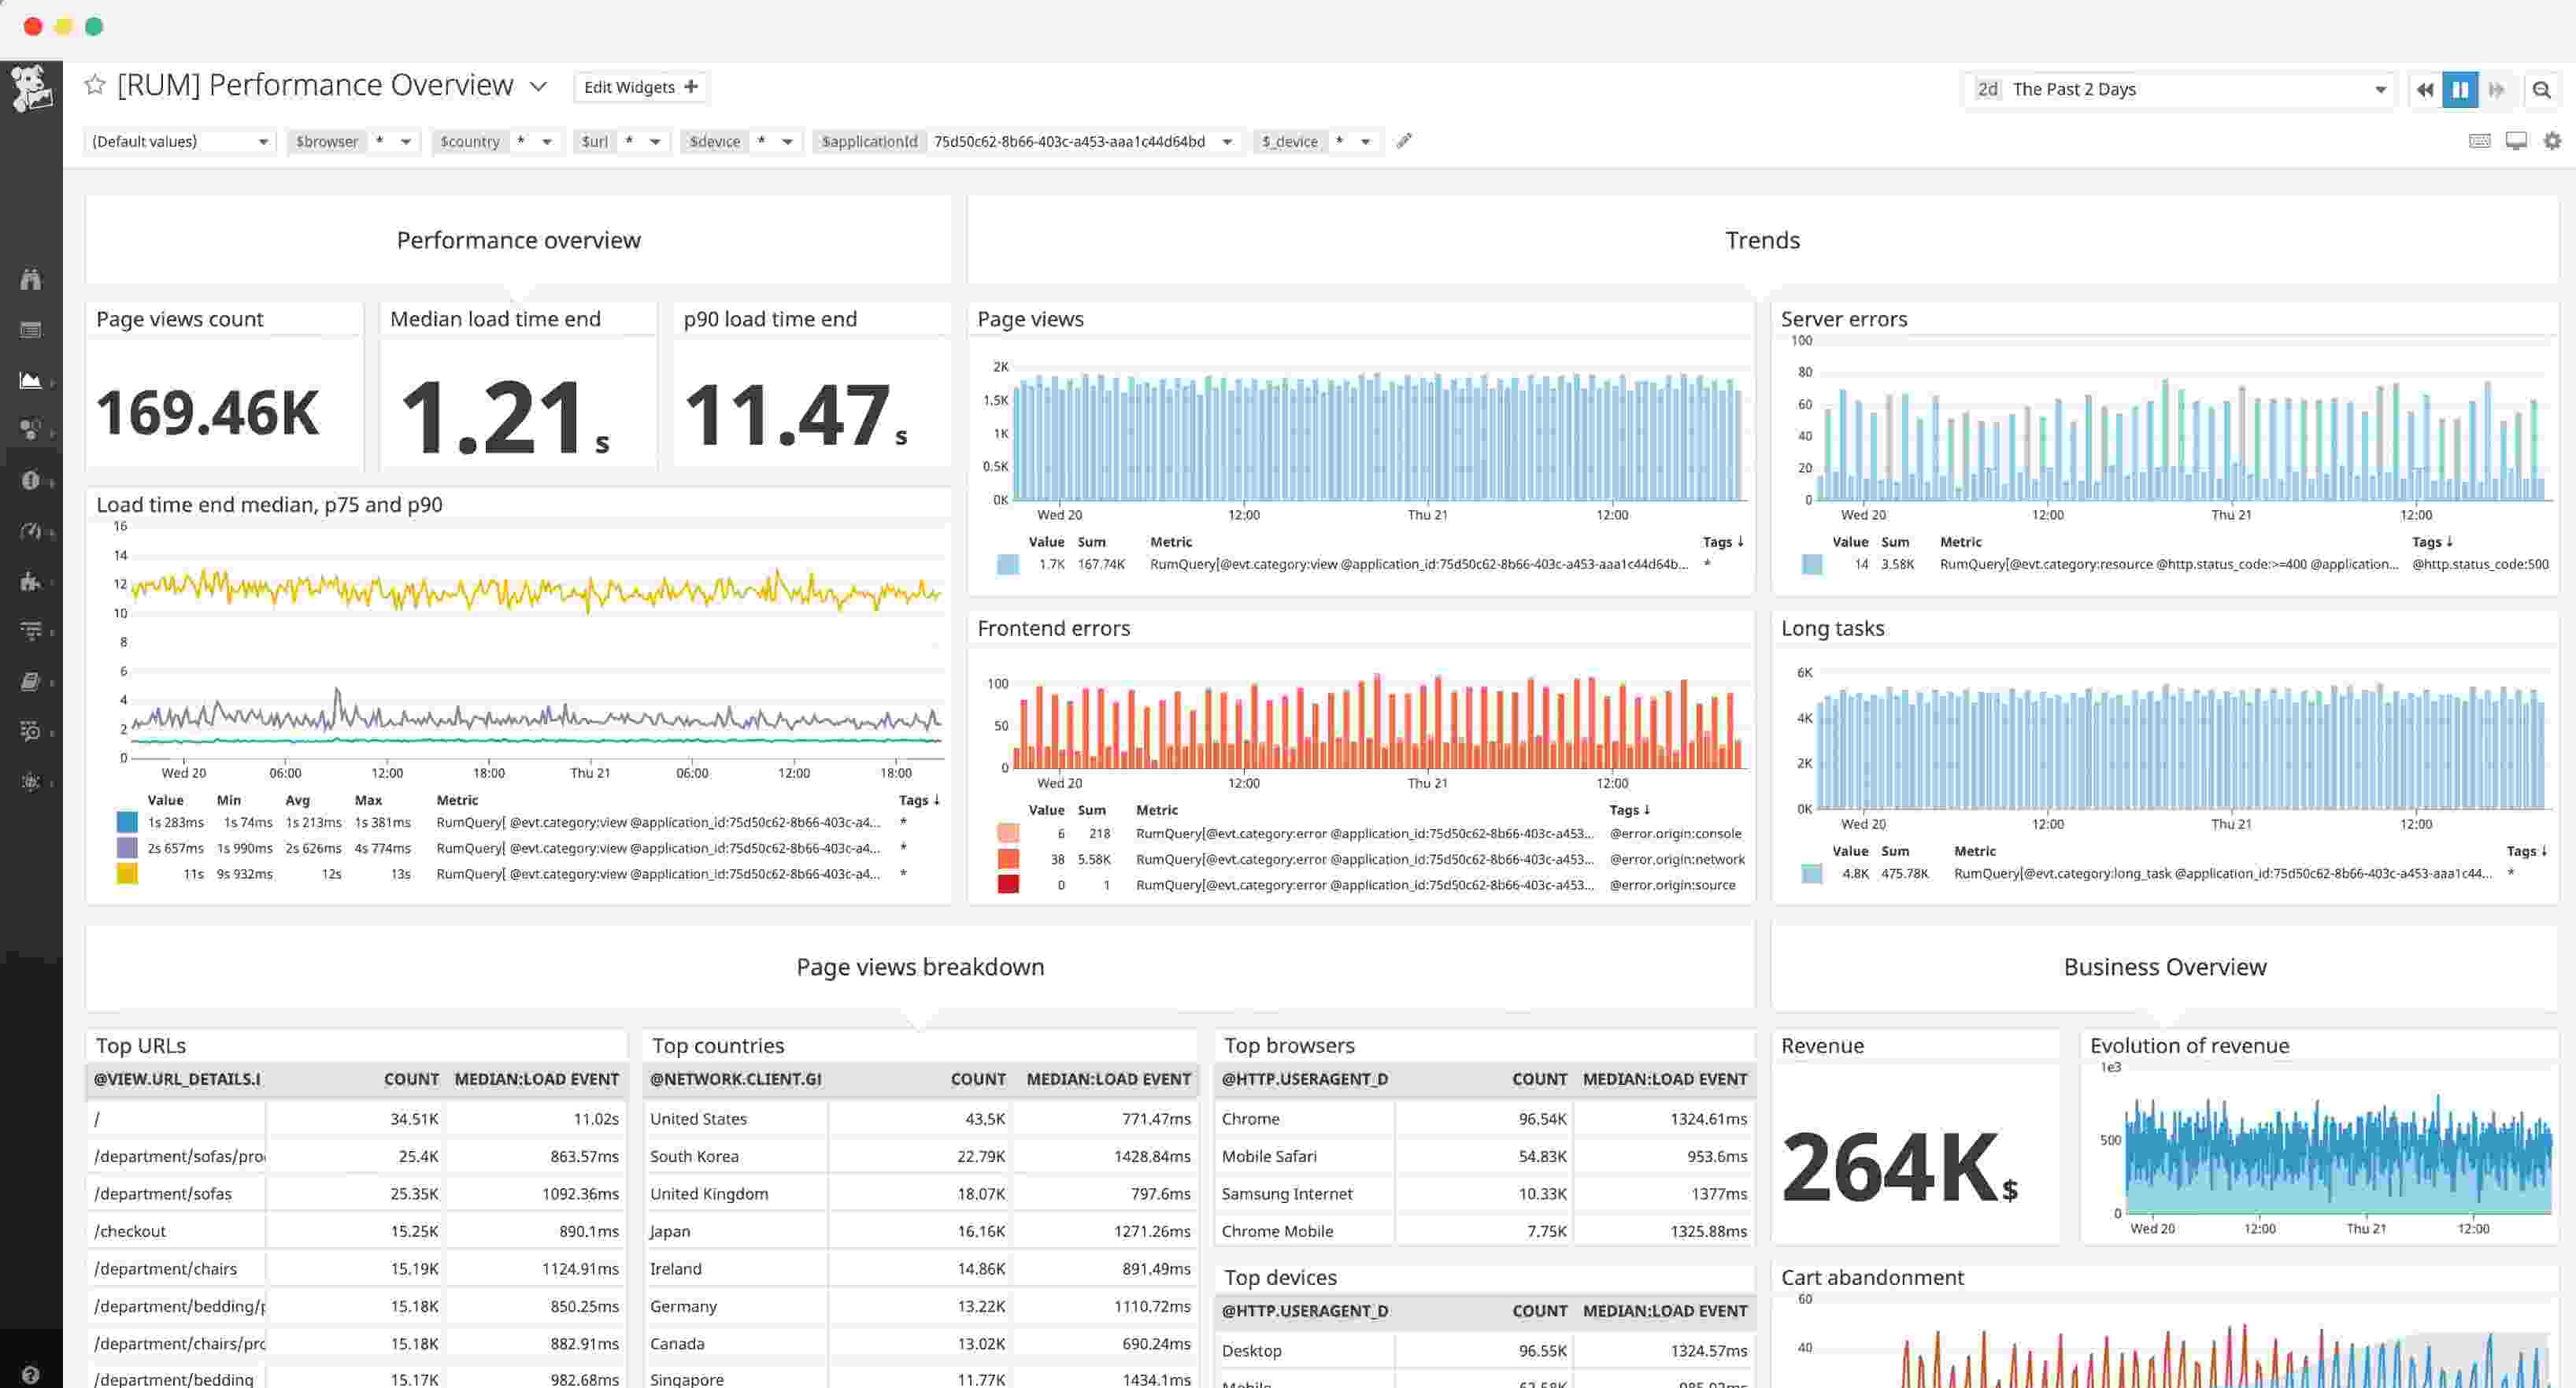
New Relic Browser offers real user monitoring (RUM) to measure website speed, performance, and user experience across browsers, devices, and networks.
This helps optimize performance, troubleshoot issues, and deliver a seamless digital experience.
Key features
- New Relic helps you monitor and track Google’s core web vitals, enabling you to gauge and optimize your app’s performance for a better user experience.
- Gain insights into your app’s performance with New Relic’s additional web vitals. Instrument different data types to optimize the page load experience and address end-user issues.
- Compare real user browser interactions with synthetic monitoring trends in specific geographical locations or end-user activities.
- Identify issues related to browsers, browser versions, or device types to effectively pinpoint and address performance problems.
Pros:
- Enables monitoring from multiple global locations.
- User-friendly dashboard
- Web vitals monitoring
Cons:
- High pricing
- Steep learning curve
Pricing:
- Free: Offers 100 GB of free data ingestion per month, unlimited basic users, and one free full-platform user.
- Standard: Pricing starts at $10 for the first full-platform user, with additional users costing $99 each. Data ingestion beyond 100 GB costs $0.35/GB.
- Pro: Pricing starts at $349 per user (annual commitment) or $418.80 per user (monthly pay-as-you-go).
- Enterprise: Custom pricing for large-scale organizations with advanced security and support needs. The plan includes additional features like FedRAMP Moderate and HIPAA eligibility.
10. Pingdom
Pingdom is a powerful website monitoring tool that allows you to proactively monitor the uptime, performance, and availability of your websites and online services.
With Pingdom, you can receive instant alerts when issues arise, track performance trends, and gain valuable insights to optimize your website’s performance.
Key features
- Pingdom combines synthetic and real user monitoring to provide complete visibility into your website’s end-user experience, allowing for enhanced troubleshooting and overall performance optimization.
- Simulate visitor interactions with your site to identify any issues with critical pages or flows. Monitor uptime, analyze page speed, and test complex transactions to ensure a smooth user experience.
- Gain insights into how actual users are interacting with your website in real-time. Understand their experience based on browser, device, and location, and compare usage metrics over time to track performance improvements.
11. Uptrends
Uptrends provides comprehensive monitoring from various locations worldwide. It offers advanced features to track uptime, measure web performance, and detect issues to ensure a seamless user experience.
Key features
- Ensure your website’s uptime and speed are monitored worldwide with extensive coverage and error detection capabilities across 233 checkpoints.
- Monitor user journeys within your web application, such as shopping carts and logins, by easily recording scripts or seeking assistance from support.
- Identify performance bottlenecks on your website by tracking load times and analyzing specific elements that may be causing slowdowns, including Core Web Vitals and W3C metrics.
12. Uptime Robot
Uptime Robot is a reputable website monitoring service provider based in Malta since 2010. A global presence and testing from multiple locations ensure accurate monitoring results.
Its advanced features include multi-location checks, recurring notifications, and the ability to analyze incidents with root causes, providing comprehensive insights for effective website monitoring.
Key features
- Pause monitoring during maintenance windows to avoid false alerts.
- Analyze incidents with root causes to minimize the risk of recurrence.
- Visualize response times in a chart to identify performance issues.
- Customize HTTP requests with advanced headers for more precise monitoring.
13. Linko
Linko is a dependable and advanced website monitoring tool that ensures the well-being and performance of your website.
It actively monitors your website’s SSL certificate health, detects broken links, regularly checks its availability across global regions, and provides timely notifications two weeks prior to your domain expiration.
Additionally, it offers customizable reporting options to keep you informed about any issues affecting your website.
Key features
- Linko ensures regular monitoring of broken links, SSL certificate health, and domain status, providing you with a complete overview of your website’s performance and security.
- With servers located in various regions worldwide, Linko offers extensive coverage and the ability to monitor your website’s availability from multiple locations, giving you valuable insights into its global performance.
- Linko offers efficient crawlers, multi-step API integration, instant email alerts, and seamless integration with NODATA. It also provides a range of monitoring features, including SSL monitoring, website uptime monitoring, log analysis, and domain expiry check, enabling you to proactively manage and optimize your website.
14. Better Stack
Better Stack is a monitoring platform that brings together ping and uptime monitoring, incident management, and status pages into a unified solution. The ability to log and troubleshoot everything offers comprehensive visibility into your entire stack.
By aggregating logs into structured data and enabling SQL-based queries, Better Stack empowers you to easily analyze and visualize your system for efficient troubleshooting and improved performance.
Key features
- Ensure accurate incident alerts by verifying each HTTP and ping-based incident from at least 3 locations, eliminating false incidents.
- Monitor a wide range of elements, including web pages, APIs, pings, POP3, IMAP, SMTP, DNS, and generic network parameters to cover all aspects of your system.
- Capture error messages from your APIs and provide screenshots of website downtime, allowing you to quickly identify and understand the cause of any issues.
How to choose the right website monitoring tool?
Choosing the right website monitoring tool is crucial for businesses to ensure their online presence is consistently accessible, secure, and optimized. Before choosing the right monitoring tool, let’s consider a few important things.
URL Monitoring Frequency
URL monitoring frequency refers to how often a website monitoring tool checks the availability and performance of a specific URL or web page. The frequency can vary depending on the monitoring tool and the specific needs of the website owner.
Choosing a monitoring frequency that strikes a balance between detecting issues in a timely manner and avoiding unnecessary strain on the website’s resources is important.
Common monitoring frequencies range from every minute to every hour, but it ultimately depends on the requirements of the website and the desired level of monitoring granularity.
Integrated server and log monitoring
Integrated server and log monitoring refers to the capability of a monitoring tool to simultaneously monitor both the performance and health of servers as well as log files.
This integration allows for a comprehensive approach to monitoring, where the tool can track server metrics such as CPU usage, memory usage, disk space, and network traffic while also analyzing log files for errors, warnings, and other relevant information.
Combining server and log monitoring into a single solution makes it easier to correlate server performance with log events, identify potential issues, and troubleshoot problems more effectively.
This integrated approach provides a holistic view of the infrastructure, enabling efficient monitoring and proactive management of servers and applications.
Synthetic and Real User Monitoring
Synthetic Monitoring involves simulating user interactions with a website or application to monitor and test system performance proactively.
By mimicking user behavior from different locations and devices, it provides insights into availability, response times, and transactional functionality. This helps organizations identify issues before they impact real users and optimize their systems for a seamless user experience.
Real User Monitoring captures data from actual user interactions with a website or application, providing valuable insights into the user experience.
Organizations can gain a deeper understanding of how users interact with their systems by analyzing metrics like page load times, click paths and device types.
This data-driven approach helps identify areas for improvement, prioritize enhancements, and optimize performance to enhance user satisfaction and drive a better overall user experience.
Combining synthetic and real user monitoring offers a comprehensive view of system performance and empowers organizations to deliver exceptional digital experiences.
Testing locations
Testing locations refer to the geographic locations from where a website or application monitoring is performed. When choosing a monitoring tool, it is important to consider the availability of testing locations that align with your target audience or user base.
By monitoring from diverse locations, you can ensure that your website or application performs well across different regions and provides a consistent user experience worldwide.
Having a wide range of testing locations enables you to identify potential performance or connectivity issues specific to certain geographic areas.
It helps you detect any regional variations in response times, latency, or availability, allowing you to optimize your systems and address any issues that may impact the user experience in specific locations.
Support for multiple browsers
It is essential to consider the compatibility of the tool to support multiple browsers when choosing a website monitoring tool. It ensures that your website or application is tested and monitored across various web browsers that your target audience may use.
You can accurately assess your website or application’s user experience and performance across different browser platforms by choosing a tool that supports multiple browsers.
Each web browser may have its own rendering engine, JavaScript interpretation, and compatibility quirks.
Therefore, testing your website or application on popular browsers such as Google Chrome, Mozilla Firefox, Microsoft Edge, Safari, and others is crucial.
This ensures that your website functions correctly, displays properly, and delivers optimal performance across different browser environments.
Alerting capabilities
The alerting capabilities of a website monitoring tool play a crucial role in promptly notifying you about any issues or incidents with your website or application. With robust alerting capabilities, you can proactively respond to potential problems and minimize downtime.
A reliable monitoring tool should offer various alerting methods such as email notifications, SMS alerts, push notifications, and integrations with popular communication platforms like Slack or Microsoft Teams.
These alerts ensure you receive real-time notifications whenever there is a performance degradation, availability issue, or any predefined threshold breach.
Price
Price is an important factor to consider when choosing a website monitoring tool. It is essential to find a tool that offers a balance between cost-effectiveness and the features you require for your monitoring needs.
When evaluating the price of a monitoring tool, consider factors such as the pricing structure (monthly subscription, annual plans, etc.), the number of monitors or websites included in the pricing tiers, and any additional costs for add-on features or integrations.
It’s important to assess your budget and determine the level of monitoring coverage you need for your websites or applications. Some tools offer free or low-cost plans with limited features, which can be suitable for smaller websites or personal projects.
Investing in a more comprehensive and scalable monitoring solution may be necessary for larger organizations or mission-critical applications.
In conclusion
The world of website monitoring tools is teeming with possibilities, offering a wide array of options to suit the needs of businesses and individuals alike.
From comprehensive analytics to real-time alerts, these 14 best website monitoring tools exemplify excellence in their ability to ensure optimal website performance and user experience.
With its impressive range of features and user-friendly interface, Middleware has rightfully earned its place among the best website monitoring tools available today.
Sign up for Middleware to see it in action.
FAQs
What is a website monitoring tool?
A website monitoring tool tracks a website’s uptime, performance, and user experience in real time. It measures metrics like page load speed, response time, Core Web Vitals, and error rates — alerting teams when issues arise so they can be resolved before users are impacted.
What is the best website monitoring tool in 2026?
Middleware is the top choice for teams needing full-stack website monitoring — combining Real User Monitoring, Synthetic Monitoring, Browser Testing, APM, and log management in a single platform. For simple uptime monitoring, Pingdom is a lightweight option. For session replay and error tracking, Zipy is purpose-built.
Is there a free website monitoring tool?
Yes. Middleware offers a 14-day free trial with unlimited data ingestion including RUM and Synthetic monitoring. Uptrace offers a free tier for basic monitoring. Many tools like Datadog and Pingdom offer 14-day trials with full feature access.


