Node.js makes coding and programming easy, enabling multiple actions through its non-blocking, event-driven, asynchronous model. However, although its asynchronous nested callbacks allow thousands of active connections, it also opens doors for complexities like managing multiple libraries and Node.js performance monitoring.

From its frameworks to its numerous tools and, significantly, its massive number of libraries that allow different JavaScript modules, Node.js is a complex framework.
Some key Node.JS libraries are the Node.js Package Manager (npm), React, Next.js, Angular, Express, and others. These libraries differ from one another in scope and concepts and host an enormous number of packages and modules. For example, The NPM registry alone hosts over one million packages of free, reusable Node.js codes.
Given the volume of repositories that make up Node.js, it is hard to monitor Node.JS applications. This article highlights the importance of Node.js performance monitoring, what metrics you should monitor in your node.js application, and the best practices you can follow.
What is Node.js performance monitoring?
Node.js performance monitoring is the collection of Node.js performance data and measuring its metrics to meet the desired service delivery. It involves keeping track of the applications’ availability, monitoring logs and metrics and reporting their imminent dysfunction.
In addition, it enables graphical or topographical visibility into the application stack, detecting issues and exposing their root causes. Therefore, it helps maintain your app’s health and maximize its functionalities.
Issues that affect any application’s performance include high latency, recurrent bugs, memory leaks, server downtime, and several others. As Node.js monitoring has moved from manual observation and mere performance analysis techniques, automated tools now aid the process and ensure real-time monitoring.
As a result, Node.js performance monitoring enables a detailed intelligence-based view of the behavior of every component of your Node.js architecture and its infrastructures. This application-centric view also provides insight into how to improve your Node.js application’s performance.
Why is Node.js monitoring important?
Despite its speed and efficiency, Node.js needs to be monitored for excellent performance. Monitoring Node.js helps you maintain and manage the application’s performance for an optimal experience for both the end-users and the developers.
In addition, it eases troubleshooting of the application at the backend and frontend levels and allows fixing issues before they worsen.
Monitoring your node.js application helps you know if your application is performing fast or at low speed, whether your users are experiencing a delay, the number of users visiting your application at a point in time, as well as information and suggestions on how to improve your application’s performance.
What should be monitored on Node.js?
Regarding Node.js performance monitoring, metrics critical to runtime efficiency are essential. The following are key metrics you should monitor in your Node.js application:
1. Throughput
Node.js is reputed for processing events asynchronously through the event loop, enabling it to handle many connections simultaneously. Therefore, the number of actions a Node.js application can process simultaneously is a critical metric to be measured and monitored. This metric is called the application or system’s throughput.
Monitoring the throughput aids in analyzing the specific amount of workload the application can complete at a given period vis-a-vis its response time. It also helps to discover the causes of any lag in the network and control the system’s behavior.
2. Latency
A program’s speedy response is a great feature and contributes to users’ inflow. Therefore, you must monitor the period between a user’s request and your application’s response. Understanding this metric will help you avoid and control latency and contribute to your application’s excellent performance.
Set a baseline for the program’s actions to track your applications’ latency. The program’s performance below, within, or beyond the baseline is then used in analysis to determine the latency of your NodeJS application. Monitoring this helps ensure that users experience no disruption or delay in your application’s service.
3. Errors
Recurrent errors push off users’ interest and reduce customers’ satisfaction. The rate at which errors come up while using an application or site determines traffic. Monitoring Node.js for error rates helps to detect and minimize, if not wholly eradicate automatically, the error rates on your application.
4. Services
This implies observing the bandwidths and capabilities of your application to render services due to rising traffic. This is detectable by observing the number of signups for your application at a point in time. Saturation can slow down the system’s service delivery. Monitoring the services will help determine if the system or CPU is saturated.
Node.js performance monitoring using Middleware
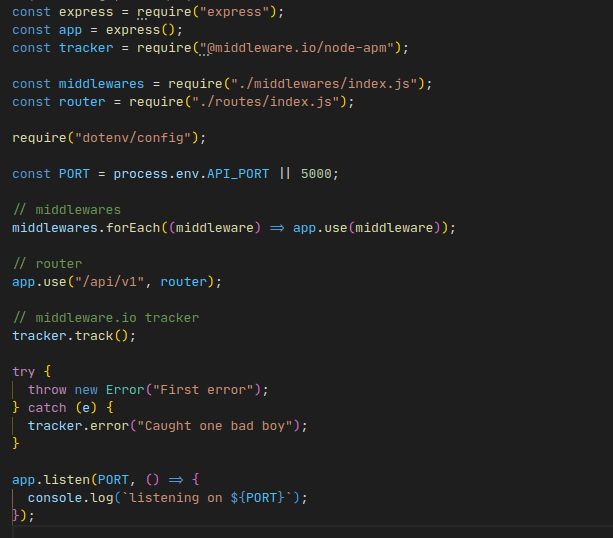
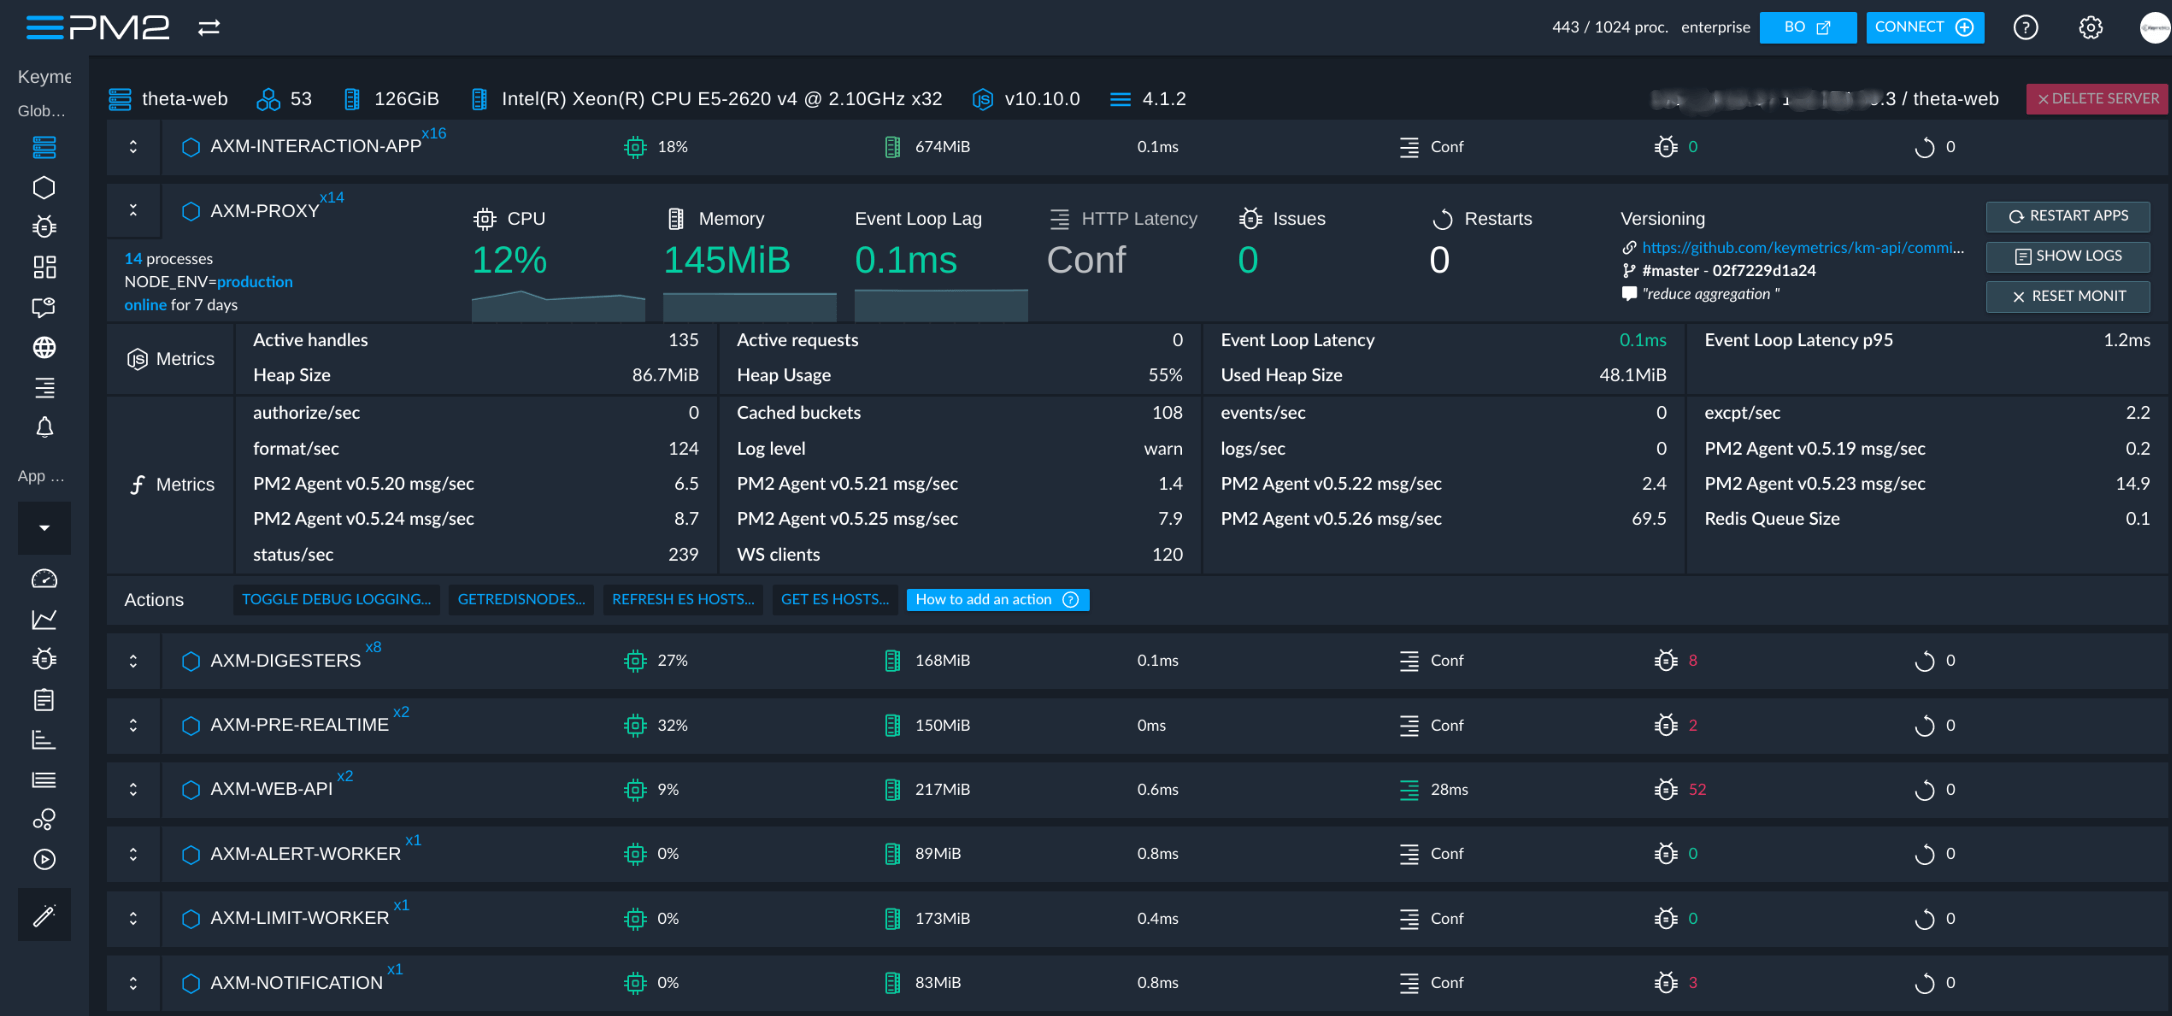
Middleware integrates with each part of your NodeJS infrastructure to provide you with a complete picture of health & performance. Once you install the Middleware agent, it collects metrics, events, and logs from your application.
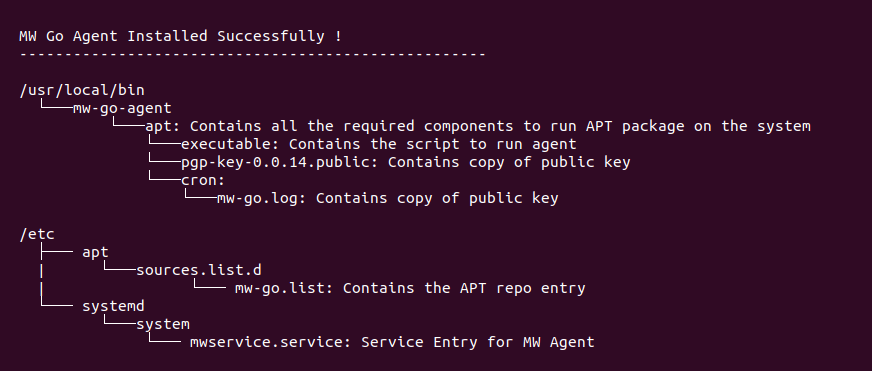
Consider an example NodeJS application; once the agent has been installed, the terminal gets automatically updated with this response:
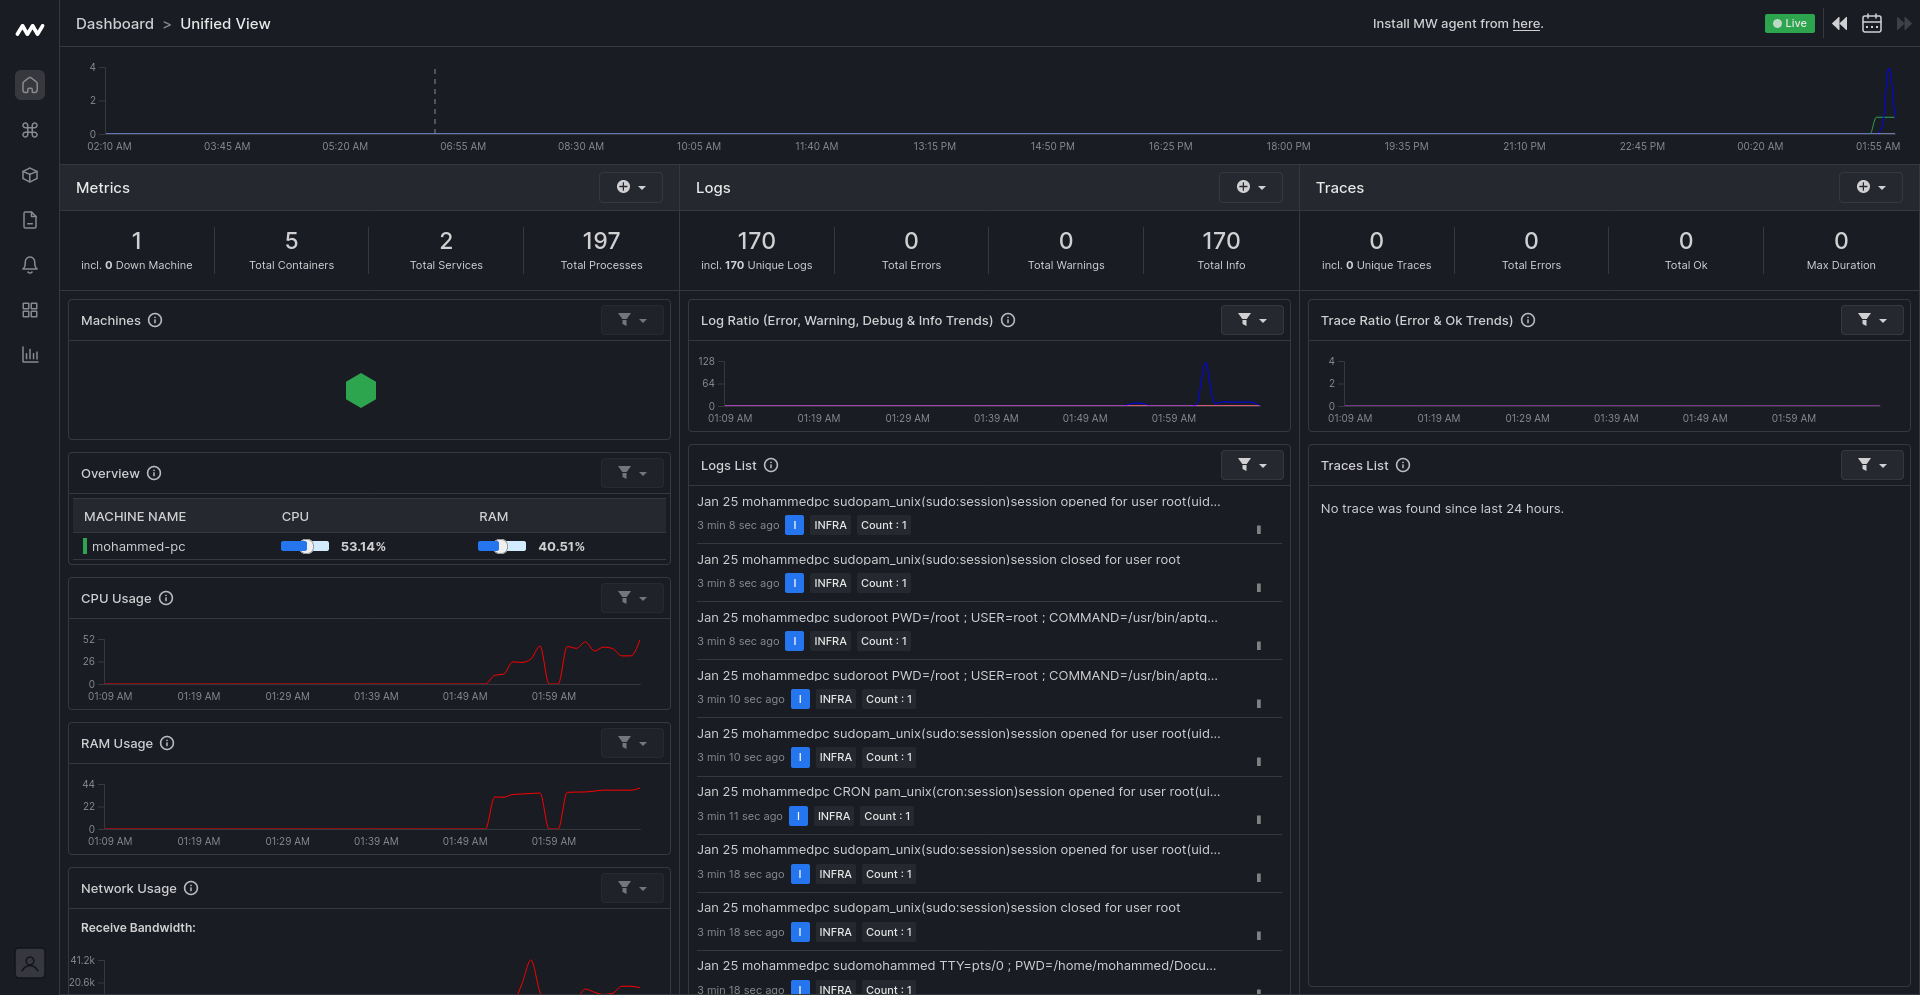
Once the agent is installed, you get a unified view of your entire NodeJS stack in a dashboard graphically illustrated below:
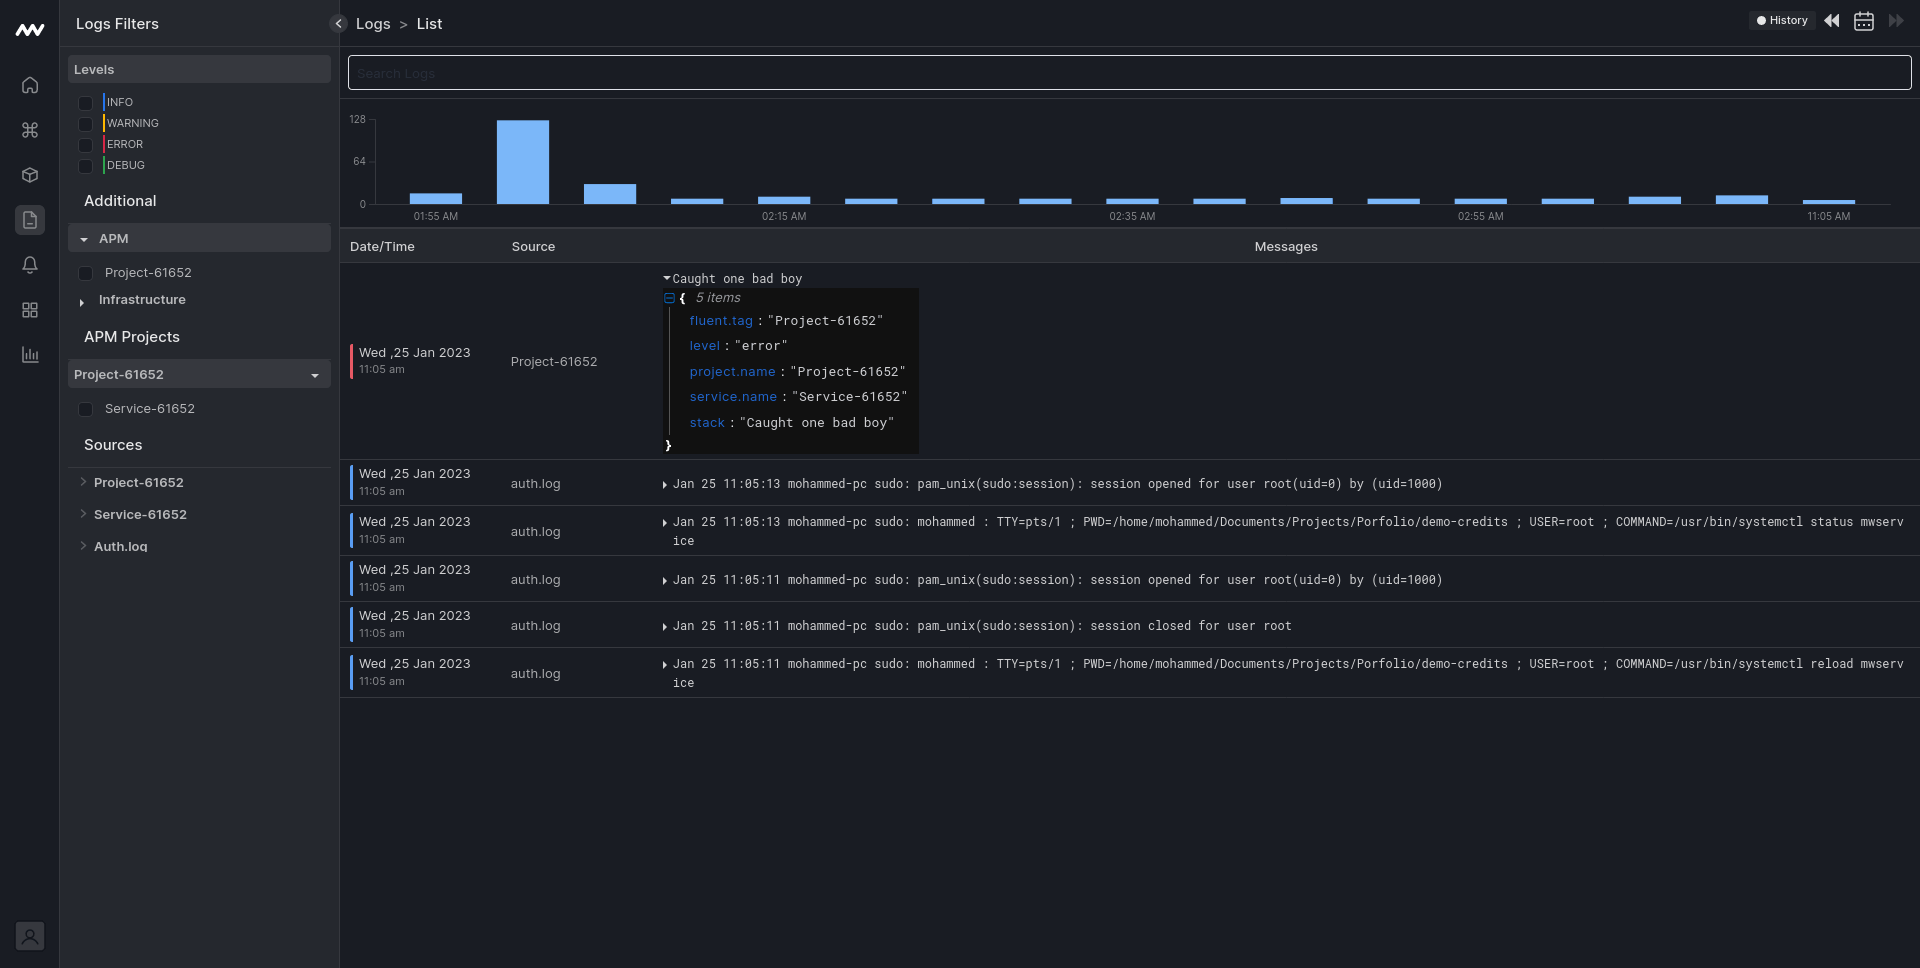
If an event returns an error message, you can view the error log on the logs list:
Additionally, your terminal also gets automatically refreshed with the error message:
In summary, choose middleware for granular visibility into errors in the services of your nodejs application.
Node.js performance monitoring: 3 best practices
To achieve efficient Node.js performance monitoring, you must follow certain best practices. The following effective methods have been implemented from time to time and recognized as Node.js performance monitoring best practices:
1. Know what needs to be monitored
Knowing what needs to be monitored in a Node.js application is crucial to your success. This allows you to trace and track the right metrics and collect necessary information on the performance of your NodeJS application.
Alongside monitoring the latency, error rates, throughput, and services, understanding the right logs to manage is equally essential. Identifying the critical events helps you achieve an effective monitoring exercise.
2. Configure alerts based on urgency
It is one thing to create alerts utilizing the monitoring tool’s notification system, and it is another to configure the alerts for urgent and critical metrics. A dynamic alert configuration helps you detect sensitive events that may harm your application’s performance and availability. This enables you to fix any issue before it goes out of control.
There are two categories of alerts: low-priority and high-priority alerts. While you can ignore low-priority alerts for later attention, you must attend to and address the events rated high-priority.
3. Ensure the correct person receives the alerts
While configuring your alerts for critical and urgent events, ensure that it is set to be received by the appropriate set of persons in your team. A specific alert should be directed to those whose department or specialty deals with the particular issue(s).
Challenges with Node.js application monitoring
Node.js is an extensive system consisting of various frameworks with fundamentally different and markedly dissimilar elements. Moreover, its several libraries have heavy dependencies that require down-to-earth observability. Capturing performance data from these disparate components is a big Node.js monitoring challenge.
It has become customary to incorporate several technologies into a single system. For instance, in your Node.js application, you can integrate two or more caching solutions, SQL and NoSQL databases.
Unfortunately, this combination of technologies makes monitoring more challenging, as you need to gather performance statistics from each component that interacts with your Node.js application.
For every programming language that makes your application each has unique challenges. For example, the memory leak issue often comes up in Node.js JavaScript language, while C++, often integrated into the Node.js system, does not have that problem. Addressing these unique pain points at a time is essential but could pose challenges.
You, therefore, need an all-in-one monitoring tool like Middleware that can capture all these events entirely. This will help you analyze the performance of your entire stack and gain visibility into user interaction.
It is not enough to capture the performance data of the application’s components, a tool that analyzes the data and automatically responds to performance problems is vital and urgent.
Top 5 Node.js monitoring tools
Integrating the proper monitoring tool into your Node.js application helps to ensure proper analysis and efficient performance monitoring. While there is an avalanche of Node.js monitoring tools you can use, three of the best ones are:
Middleware
Middleware is built upon the eBPF based observability approach to application performance management. This tool is highly sophisticated, with mechanisms that display end-to-end visibility of your Node.js application and its dependencies. Its features help you set alerts for the most critical metrics or events.

Apart from simply detecting errors, this observability solution provides analysis that helps you properly troubleshoot and fix issues in your application. Middleware collects all correlating metrics, logs, KPIs, traces, and data in real time in one unified dashboard.
PM2
PM2 is perfect for log monitoring and auto-clustering. As a daemon-oriented software and process manager, it helps prevent your applications from failing or experiencing event loop lag.
With it, you can quickly grasp your application’s latency, memory consumption, component errors, and other vital metrics.
Prometheus
An open-source monitoring tool for Node.js, Prometheus effectively juxtaposes data from previous events with the system’s current situation. This helps you to understand the progress or otherwise of your Node.js application’s performance.
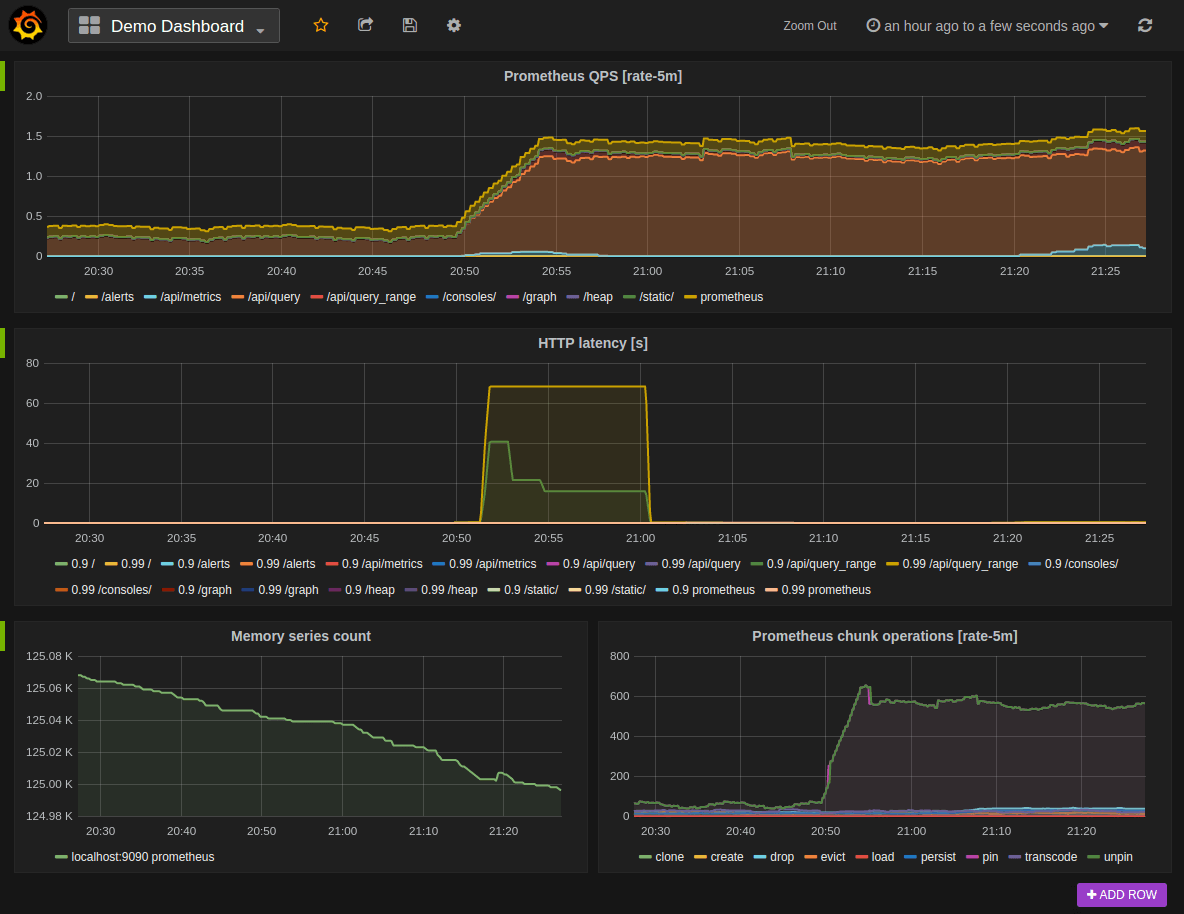
Although Prometheus is reputed for its multi-dimensional time-series data model, it also has a notification feature that sends alerts at important but critical events.
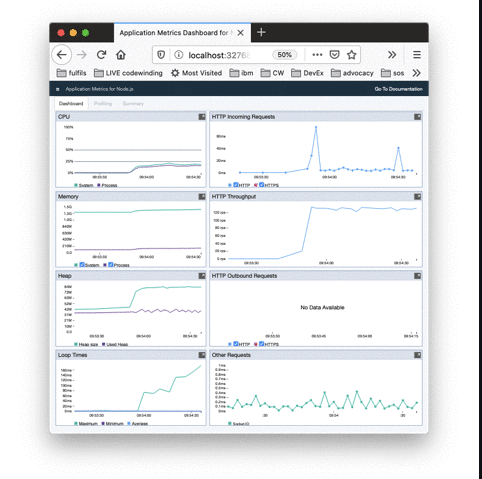
AppMetrics
AppMetrics is an open-source, lightweight Node.Js monitoring platform that’s ideal for resource-constrained applications. It helps developers gain insights into application performance via detailed metrics on CPU and memory usage, event loop behavior, HTTP requests, and garbage collection.
AppMetrics’ uniqueness lies in its ability to offer custom dashboards that allows developers to track metrics that matter the most. This way, they can identify patterns/trends, visualize KPIs, and identify issues before they harm the applications’ health.
Clinic.js
Clinic.js is a modular and adaptable Node.js monitoring tool that’s known for its ability to integrate with multiple monitoring tools and frameworks. This flexibility allows developers to make the most out of multiple monitoring tools at the same time.
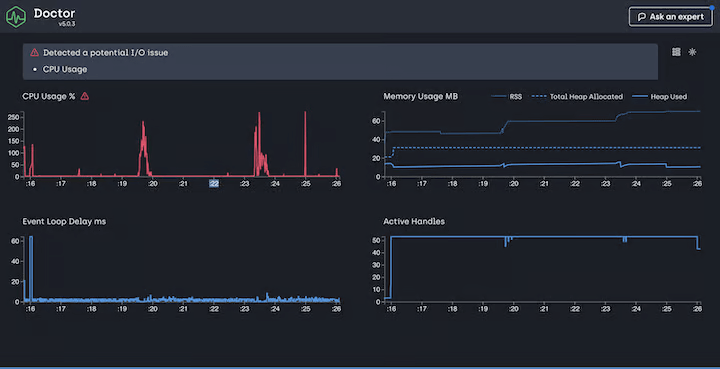
Clinic.js offers a range of profiling tools that go beyond just identifying performance bottlenecks. It can look into CPU and memory usage and code execution, allowing developers to pinpoint the root cause of a slowdown.
Conclusion
As developers use Node.js for microservice development, the framework’s vast environment is a challenge that necessitates consistent monitoring. Knowing what to monitor and implementing monitoring best practices is the most efficient way to detect and understand the bottlenecks affecting the performance of your Node.js application.
The new update in December 2023, Node v21.5.0, promises novel, broader and more complex features, providing more server-side and client-side solutions for DevOps. To gain granular insights into your Node.js applications, you need a Software-as-a-Service (SaaS) monitoring solution like Middleware.
Middleware offers end-to-end visibility into Node.js applications, offering real-time insights into app health, performance, and bottlenecks. Start monitoring with middleware for free today!