
Summary: This guide explains how to implement Windows infrastructure monitoring with Middleware to track server performance and detect issues early. It covers agent installation, key metrics to monitor, alert configuration, and practical troubleshooting techniques for production environments.
Windows servers often fail quietly. Memory leaks grow for days before performance drops, disk space fills slowly until SQL Server crashes, and CPU spikes happen in the middle of the night when nobody is watching. Without proper Windows infrastructure monitoring, teams usually discover these issues only after users start reporting them.
This guide explains how to set up Windows infrastructure monitoring with Middleware, an infrastructure monitoring platform, for Windows Server (2016+), whether you’re running on AWS, Azure, or on-premises. You’ll install the agent, understand what metrics like Processor Queue Length and page file usage actually mean, set up alerts that catch problems early, and troubleshoot faster.
We’re not just covering installation. We cover finding memory leaks, understanding CPU issues, and tracking down performance problems that show up without warning.
Key Takeaways
- Install the Middleware Windows agent to start monitoring Windows servers.
- Monitor key metrics like CPU, memory, disk, and network usage.
- Use Processor Queue Length and Available Memory to detect performance issues.
- Configure alerts to identify problems before they impact users.
- Use process data and logs to troubleshoot issues quickly.
If you also manage Linux environments alongside Windows, check our guide on Linux infrastructure monitoring with Middleware to set up monitoring for Linux servers.
What is Windows Infrastructure Monitoring?
Windows infrastructure monitoring is the process of tracking system metrics such as CPU usage, memory consumption, disk I/O, and network activity on Windows servers to detect performance issues and prevent outages.
What You Need Before You Start
This guide assumes you manage Windows servers in production and have administrator access to install software. You’ll need:
System Requirements:
- Windows Server 2016 or higher
- 64-bit processor (x86_64)
- Administrator privileges
Note: The agent also runs on Windows 10/11 for testing and development, but this guide focuses on production server monitoring.
Middleware Account:
- Active Middleware account
- API key from your dashboard (Installation → Agent → Windows)
- Target URL (the endpoint where your agent sends data)
The API key and target URL are unique to your account. Copy both from the dashboard before you start. You’ll need them during installation. If you’re setting up multiple servers, you can reuse the same API key.
How to Set Up Windows Infrastructure Monitoring with Middleware
Setting up monitoring on your Windows system takes about 10 minutes. The agent installs as a service, gets metrics from your system, and sends them to Middleware. Your applications continue to run at normal speed.
I’m doing this on Windows 11. Server 2016, 2019, and 2022 work the same.
How to Install the Middleware Agent on Windows
You can use the graphical installer or PowerShell. The GUI makes sense for single servers. PowerShell is faster when deploying to multiple machines or working on headless servers.
Method 1: GUI Installation
Download the installer from GitHub. The file is 34.4 MB. Run it, and a setup wizard opens. You’ll paste in your API key and target URL when prompted.
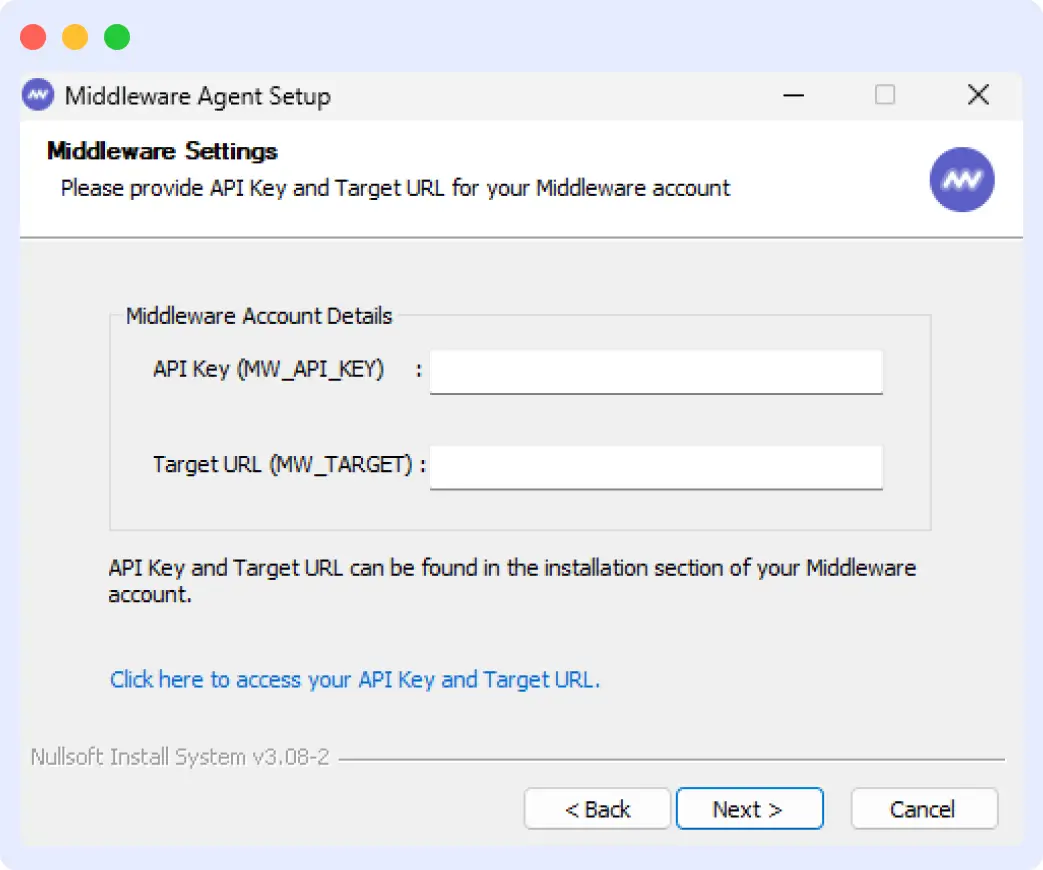
The wizard handles everything else, including creating the service, setting permissions, and starting the agent.
Method 2: PowerShell Installation
Open PowerShell as Administrator and run these commands:
Invoke-WebRequest `
-Uri "https://github.com/middleware-labs/mw-agent/releases/latest/download/mw-windows-agent-setup.exe" `
  -OutFile mw-windows-agent-setup.exe -UseBasicParsing
This downloads the installer to your current directory. Next, run the silent installation:
Start-Process `
  -FilePath ".\mw-windows-agent-setup.exe" `
  -ArgumentList "/S /MW_API_KEY='' /MW_TARGET='https://.middleware.io:443'" `
  -Wait
Replace `<MW_API_KEY>` with your actual API key and `<MW_UID>` with your unique identifier from the target URL. The `/S` flag runs the installer silently without any UI prompts. The `-Wait` parameter ensures PowerShell waits for the installation to complete before returning control.
Both Methods install the agent as a Windows service that starts automatically.
Once the agent is installed, you can instantly start collecting infrastructure metrics, logs, and traces from your Windows servers in the Middleware observability platform. ➡View Your Infrastructure in Middleware Dashboard
How to Verify if the Installation was Successful
After installation completes, verify the agent is running and sending data to the Middleware.
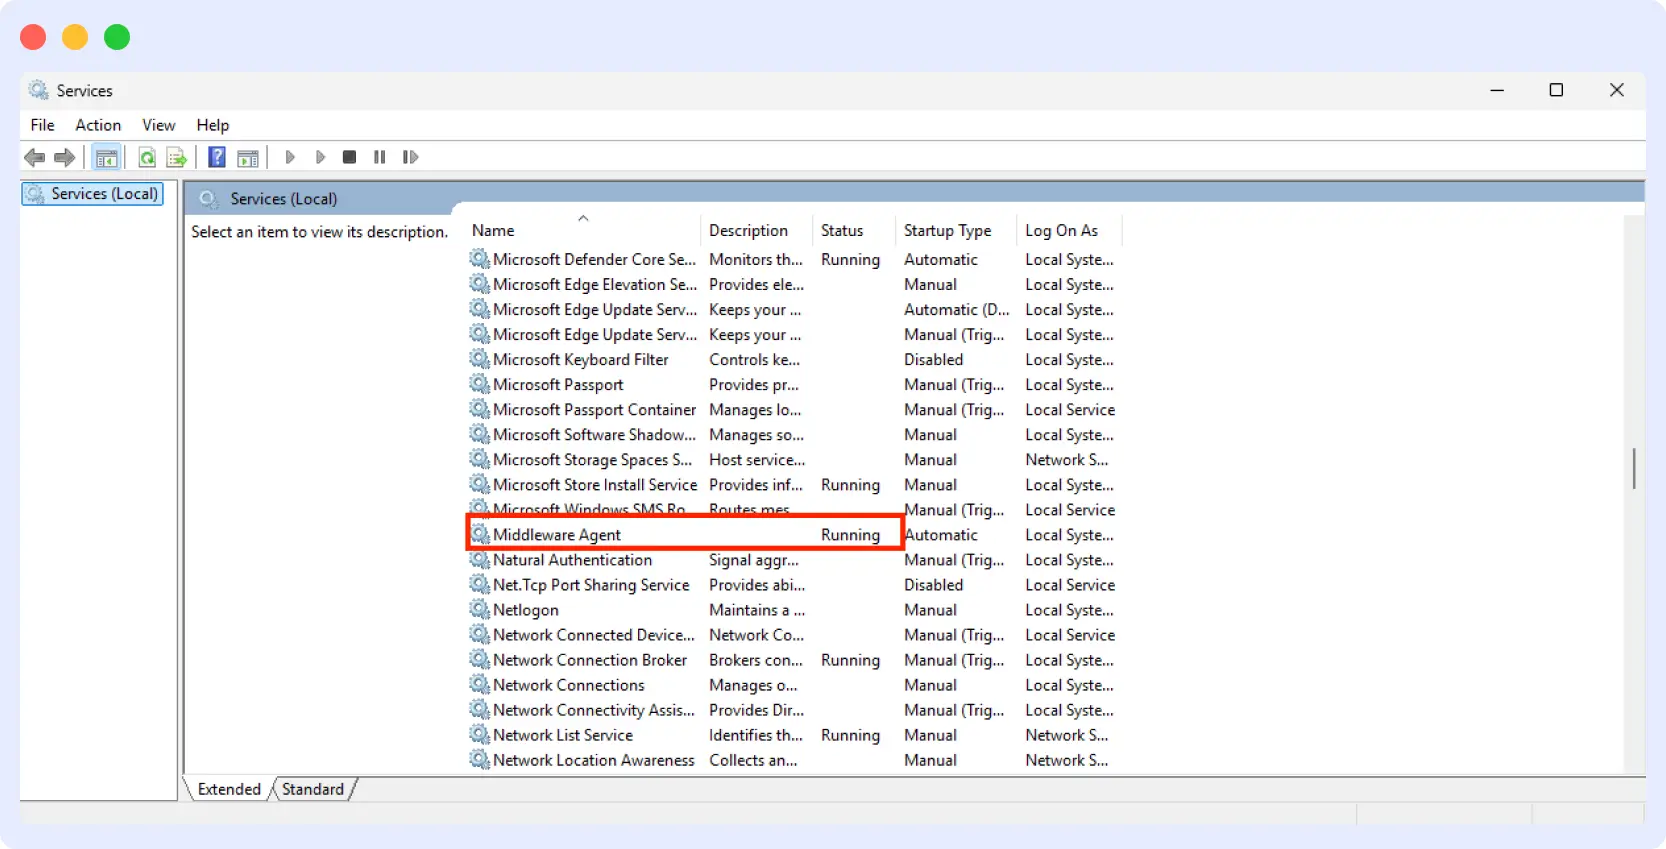
Check the Windows Service
Open the Services app. Look for “Middleware Agent” in the list. The status should show “Running”.
If you installed via PowerShell, you can check the service status directly from the terminal:
You should see output showing:
- Status: Running
- Name: mw-windows-agent
- DisplayName: Middleware Agent
Verify in the Middleware Dashboard
Log in to your Middleware dashboard and navigate to Infrastructure → Hosts. Your Windows system will appear here once the agent has successfully connected and sent metrics.
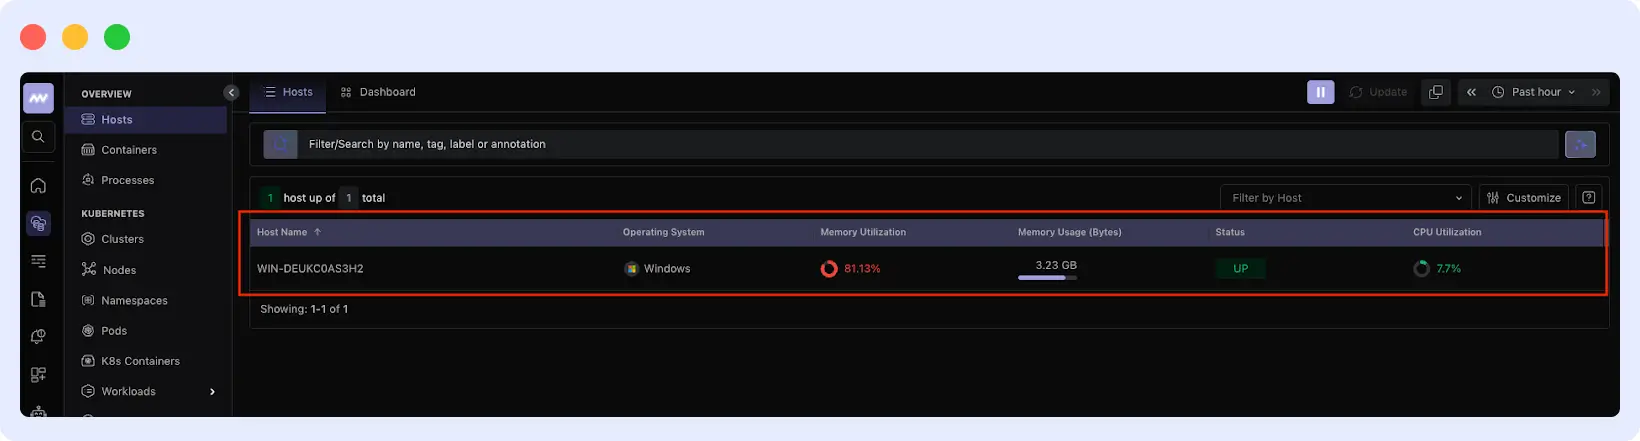
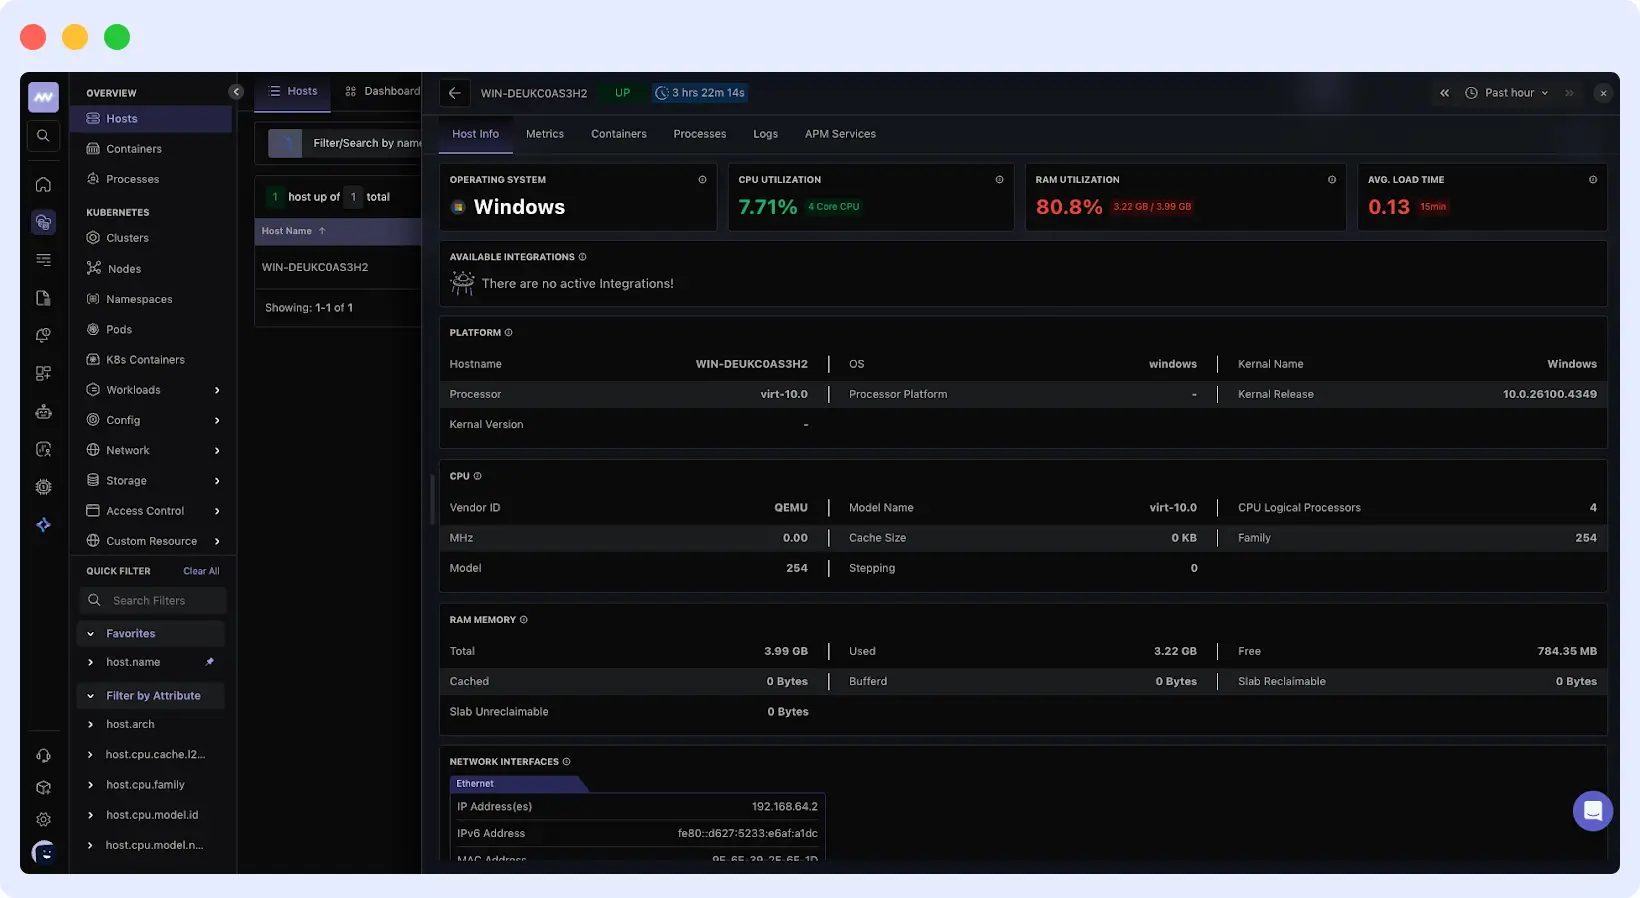
Click your system name to see host details, metrics, running processes, and logs.
If the service is running but your host doesn’t appear in the dashboard, double-check that you entered the correct API key and target URL during installation.
How Do You Use These Metrics to Diagnose Production Issues?
Collecting all these metrics doesn’t help if you can’t interpret them when something breaks. What you really need is to know what to look for during an actual incident, like when you get paged at 2 AM because the app is slow, or you come in Monday morning and performance has been garbage since Saturday night.
🔍Monitoring metrics is only the first step. The real value comes from detecting issues early before they impact users. Learn more about proactive infrastructure monitoring strategies to prevent outages before they happen.
What Does High CPU Usage Actually Tell You?
Raw CPU percentage doesn’t tell you much. A server at 75% CPU might be perfectly healthy if it’s processing a real workload. What matters is whether that CPU usage is causing performance problems and what’s behind it.
Windows doesn’t have a load average like Linux. Check Processor Queue Length instead. This shows how many threads are waiting for CPU time. If this number consistently exceeds 2 per CPU (like 8+ on a 4-core server), you have CPU contention and performance degradation.
Look at how CPU time splits between User mode and Privileged mode. High User Time (above 70%) means your applications are doing real work, which is normal. High Privileged Time (above 30%) indicates the CPU spends too much time in the kernel. Common causes are:
- Excessive context switching
- Disk I/O bottlenecks
- Applications make thousands of small system calls instead of batching operations.
What looks like a CPU problem is often something else. If you see moderate CPU usage (50-70%), high Privileged Time, and your disk queue length is above 2, the real problem is your disk subsystem. Applications are blocked waiting for I/O. The CPU has cycles available but can’t do useful work. Adding more CPU won’t help here. You need faster storage.
☸️If you’re running Kubernetes workloads alongside Windows infrastructure, you can also monitor Kubernetes operator activity using Middleware.
When Should You Worry About Memory Usage?
Windows manages memory aggressively, so high memory usage alone isn’t a problem. The OS caches everything it can to improve performance. What matters is Available Memory (free plus standby cache that Windows can reclaim instantly). When this drops below 10% of total RAM while page file usage climbs, you’re in trouble.
Steady growth in page file usage over time shows a memory leak. Sort processes by memory usage and look for anything that keeps growing without an increase in workload. A service jumping from 2 GB to 4 GB in an hour with no change in activity is leaking.
Page file thrashing is worse. Available Memory below 5%, constant disk I/O spikes, and growing page file usage mean Windows is swapping pages to disk continuously. Disk is 1,000x slower than RAM. Performance collapses. You need more RAM or leaner applications.
What Network Metrics Tell You About Application Health
Network throughput (bytes sent/received) shows you traffic volume, but network error rate and dropped packets reveal quality issues. Even a small percentage of dropped packets destroys TCP performance because TCP has to retransmit lost data.
If you see dropped packets on the receive side, your network interface or driver can’t keep up with incoming traffic. This happens when you have a 10 Gbps NIC, but the server CPU can’t process packets fast enough, or when you have an incorrect interrupt-handling configuration.
Errors on the transmit side often point to physical issues like bad cables, switch port problems, or NIC hardware failures. If error rates spike suddenly, check your network hardware before blaming the app.
For applications with many concurrent connections (such as web servers or databases), watch the network connections by state metric in your Processes view. A buildup of connections in the TIME_WAIT or CLOSE_WAIT states indicates connection pool exhaustion or improper connection closing by applications.
Why Process-Level Data Matters for Root Cause Analysis
System-wide metrics show symptoms. The processes tab shows the cause. When CPU spikes or memory runs low, you need to know which process caused it.
Sort by CPU utilization during an incident. If a high-CPU process has been running for 7 days, it’s probably a real workload. If it started 10 minutes ago and is consuming 40% CPU, that’s suspicious. The same logic applies to memory leaks. A process that consumes 15% of memory after 2 hours will use all your RAM by the end of the day.
Check which user account each process runs under. Services running as SYSTEM or LOCAL SERVICE should be predictable. Unexpected executables with elevated privileges might be malware or unauthorized software.
Setting Up Alerts for Windows Infrastructure Monitoring
Why You Need Alerts for These Metrics
Who’s watching dashboards at 3 AM? Nobody. That’s the whole point of alerts. They catch problems the moment metrics cross into dangerous territory, so you’re fixing issues before users start complaining or systems go down.
Here’s a real example of what happens without proper alerting: A .NET application started leaking memory. Memory leaked slowly at first, climbing from 40% to 50% over day one. Nobody noticed. By hour 36, it hit 70%. Still no alerts. At 48 hours, memory usage reached 85%, and the server started thrashing the page file. Performance tanked. Users noticed.
The on-call engineer finally got paged 20 minutes after things started falling apart. By then, he was diagnosing the issue with angry users on the phone and management asking for updates.
If they’d set an alert at 75% Available Memory, it would’ve triggered 8 hours earlier. Plenty of time to restart the service at 2 AM during their maintenance window. Zero user impact. Zero fire drill.
🛠️If you’re evaluating monitoring solutions, explore our guide to the best infrastructure monitoring tools to understand how different platforms compare.
Alert Rules Based on Critical Metrics
Don’t just pick round numbers like “alert at 80%” just because they sound reasonable. Set thresholds based on what actually indicates a problem in your environment. Here are starting points you’ll tune as you learn what’s normal for your servers:
Processor Queue Length
Alert when it exceeds 2 per CPU core for more than 5 minutes. A 4-core server with a queue length consistently above 8 indicates threads are waiting for CPU time, and performance suffers.
Available Memory
Alert when it drops below 15% of total RAM. Below 10% and you’re likely paging to disk. Set a warning at 15% so you have time to investigate before it becomes critical.
Page File Usage
Alert when page file usage grows by more than 30% in an hour, or exceeds 50% of the configured size. Sudden growth shows a memory leak. Steady high usage means you don’t have enough RAM for your workload.
Disk Queue Length
Alert when it stays above 2 per physical disk for more than 10 minutes. Your storage can’t keep up with I/O demand. Applications are waiting for disk operations to complete.
Network Dropped Packets
Alert on any non-zero dropped packet rate that persists for more than 2 minutes. Even a small percentage of dropped packets significantly degrades TCP performance.
Process-Specific
Alert when a critical service (IIS, SQL Server, your application) exceeds expected CPU or memory usage. If your web app normally uses 2 GB and suddenly jumps to 6 GB, you need to know immediately.
How to Configure Alerts in Middleware
Navigate to the Alerts section in your Middleware dashboard and click “Add New Rule” in the top right corner. You’ll see different alert types.
For Windows infrastructure monitoring, you’ll need two:
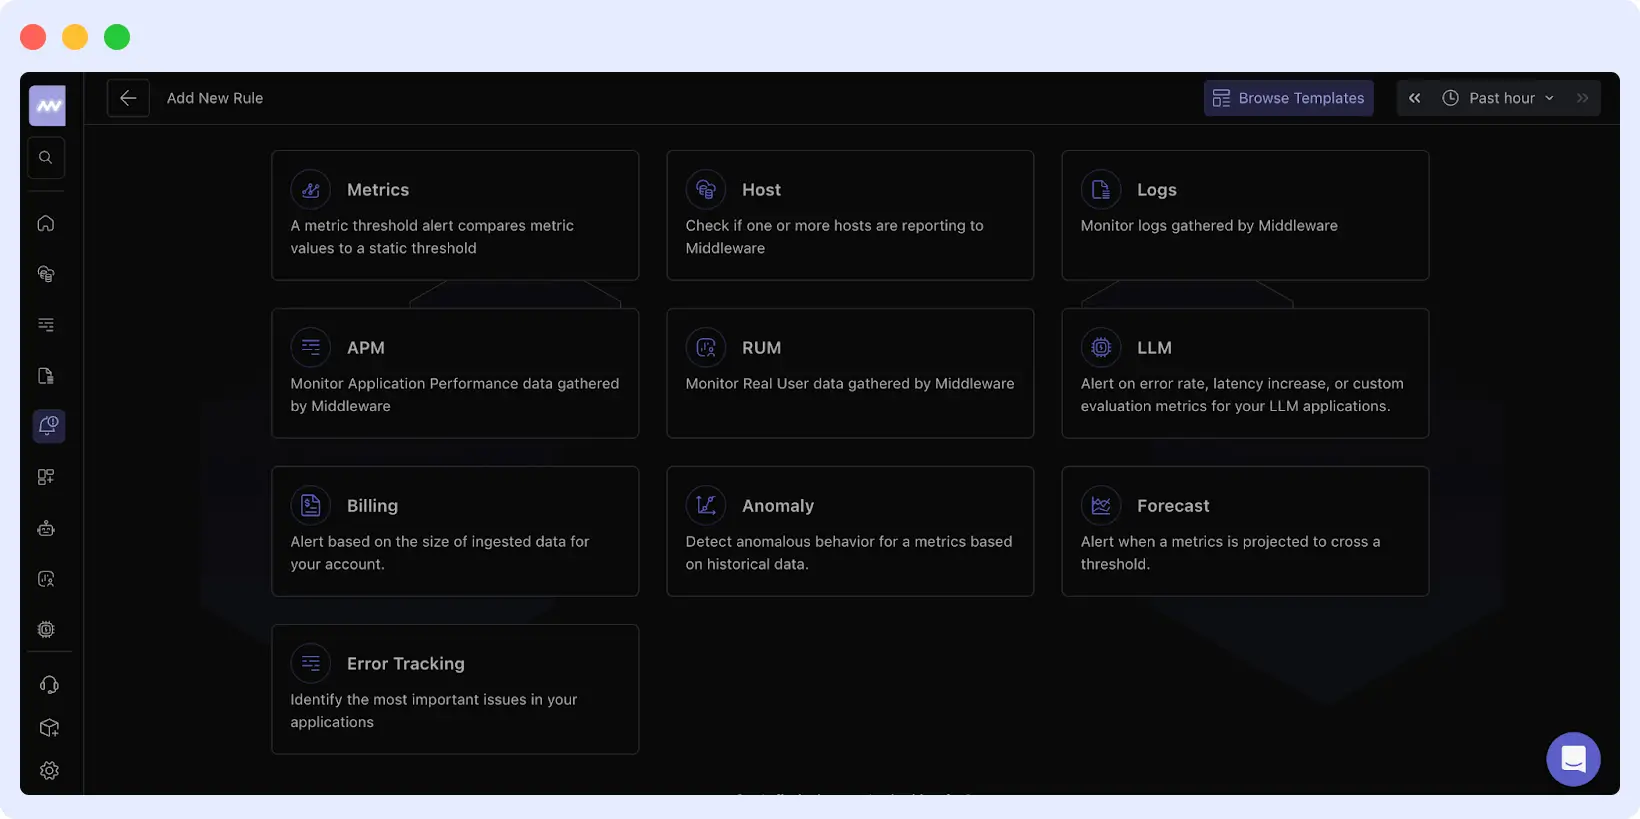
Host alerts: Notify you when a server stops reporting to Middleware. This catches agent failures, network issues, or server crashes.
Metrics alert: trigger based on threshold conditions for CPU, memory, disk, or network metrics. This is what you’ll use most often for performance monitoring.
Setting Up a Host Alert
Click the “Host” card. The configuration has five steps:
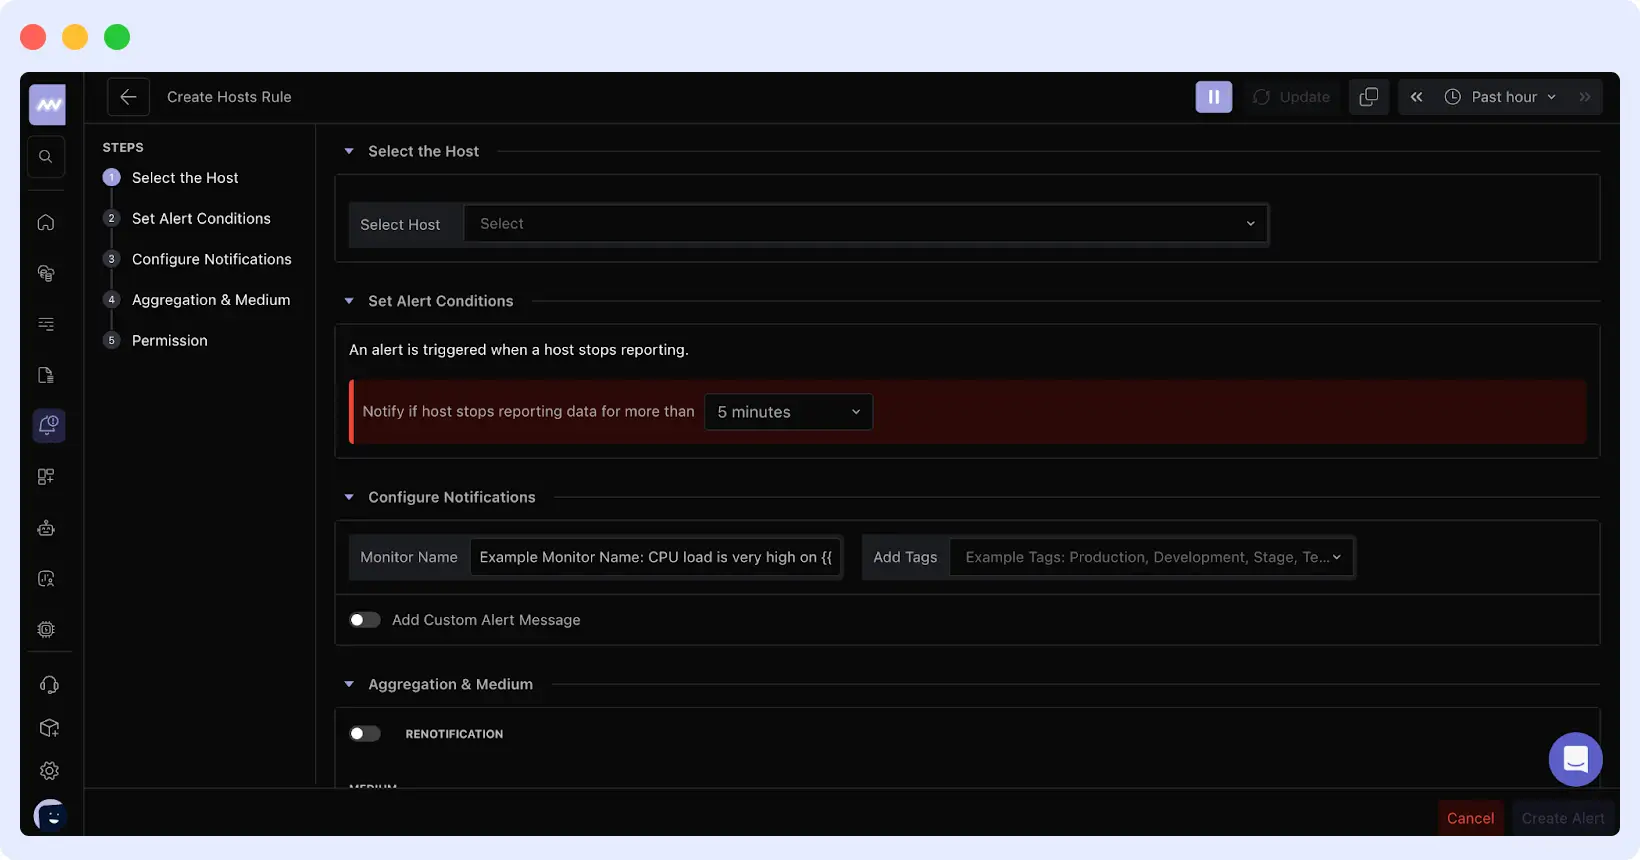
- Select the Host: Choose which Windows server to monitor. You can select a specific host or apply the rule to multiple hosts with tags.
- Set Alert Conditions: Define how long the host can stop reporting before an alert is triggered. The default is 5 minutes, which works for most cases. Increase this if you have scheduled maintenance windows or know of network instability.
- Configure Notifications: Name your alert something descriptive, like “Production Web Server Down” or “Database Host Offline”. Add tags to group alerts by environment (Production, Development, Staging).
- Aggregation & Medium: Choose how you want to be notified. Middleware supports Email, Slack, Microsoft Teams, PagerDuty, Opsgenie, and Webhooks. Enable renotification to receive repeated alerts until the issue is resolved.
- Permission: Set who can view and manage this alert rule.
Setting Up a Metrics Alert
Click the “Metrics” card for threshold-based alerting. The configuration allows you to define exactly which metric to monitor and which values trigger alerts.
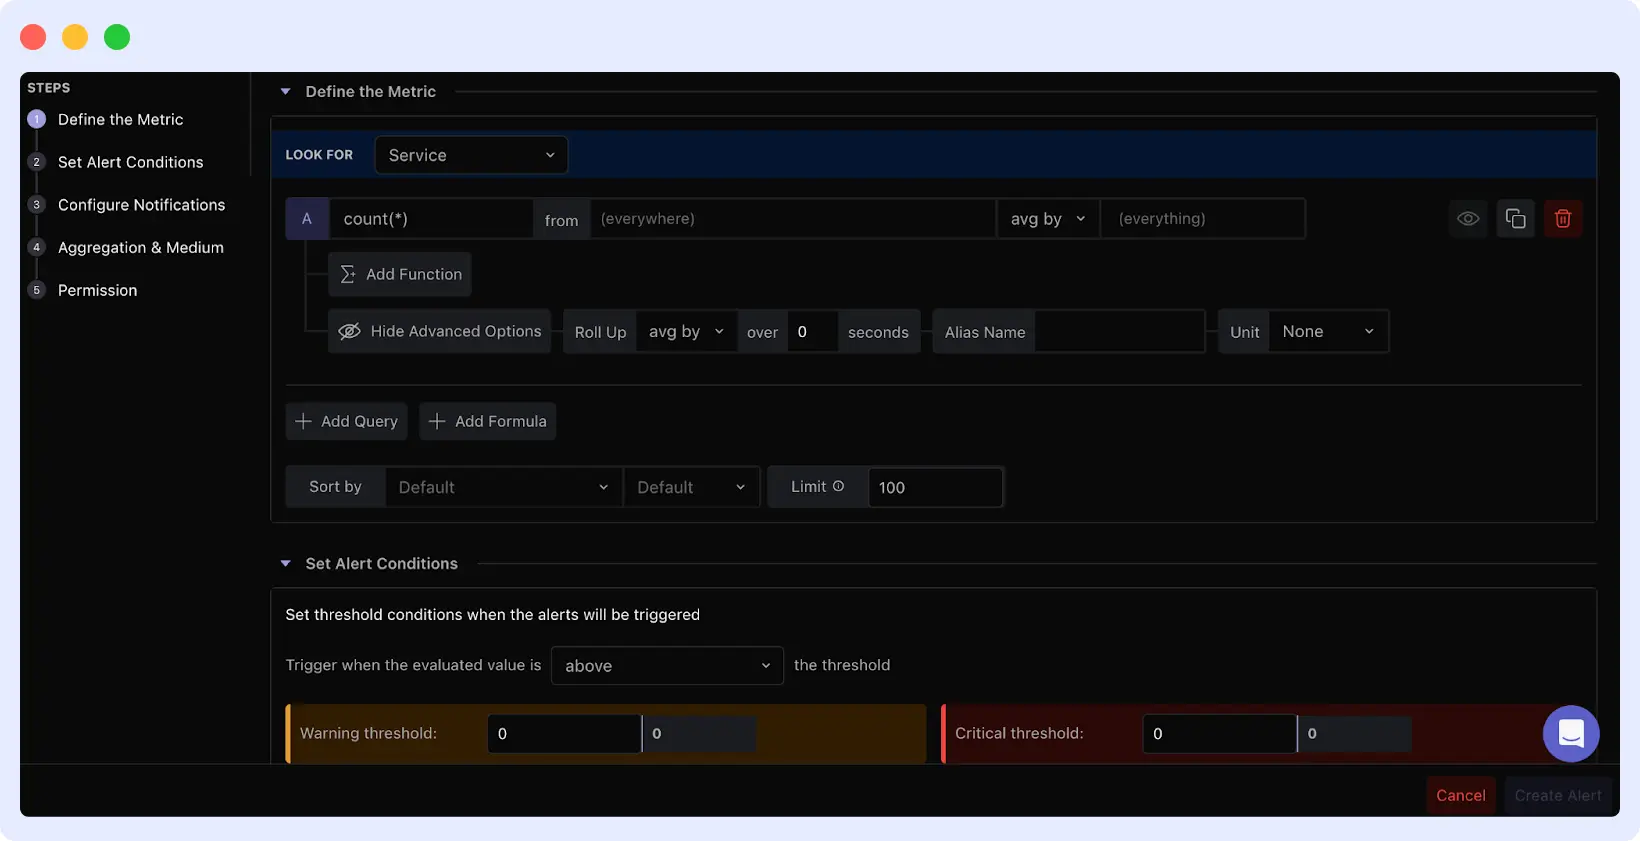
- Define the Metrics: Choose what you’re monitoring. The “Look For” dropdown lets you select Service, Host, or other data sources. Build your query to target the specific metric (like CPU usage, memory, or disk I/O).
- Set Alert Conditions: Define warning and critical thresholds. For example, warn at 75% CPU and trigger critical at 90%. Set the evaluation window (how long the condition must persist before an alert is triggered). Use “max” for spike detection or “avg” for sustained issues. A 5-minute window filters out brief spikes that resolve themselves.
- Configure Notifications: Same as the host alerts. Give a clear name, add environment tags, and customize the alert message (optional).
- Aggregation & Medium: Pick your notification channels and decide if you want continuous renotification.
Middleware evaluates alerts based on the time window you specify. If you set a 5-minute window with a “max” evaluation, the alert fires only if the threshold is exceeded at any point during that window. This prevents alert fatigue from momentary spikes.
Best Practices for Windows Monitoring
Establish Baselines Before Setting Alerts
Run monitoring for 1-2 weeks before enabling alerts. Your SQL Server might hit 90% CPU during night batch jobs. That’s normal, not an incident. Set thresholds above your actual peaks, not random numbers from the internet.
Correlate Metrics and Logs
When an alert fires, check the logs immediately. If there’s a CPU spike at 3:47 AM, look at Windows Event Logs from 3: 45-3:50 AM. The cause is usually there, maybe a service crash, a scheduled task, or a failed query.
Tune After Every Incident
False positives train teams to ignore alerts. After incidents, ask: “Could monitoring have caught this earlier?” After false positives, ask: “Why did this fire incorrectly?” Tune based on experience, not guesswork.
Monitor Windows-Specific Components
Monitor Windows Services status (IIS, SQL Server, your apps), Event Logs for errors, and certificate expiration. Generic metrics miss Windows-specific problems.
Want to dive deeper into Windows performance tracking and troubleshooting? Read our complete guide to Windows server monitoring for additional best practices.
Conclusion
Windows infrastructure monitoring catches problems before they become serious. With Middleware, you see CPU pressure, memory leaks, disk issues, and network problems in real time. Metrics show what’s happening, alerts notify you when thresholds break, and process data points to the exact cause.
Install the agent, set up critical alerts, and tune thresholds as you learn your baseline. Find issues during maintenance windows, not when production is down.
Ready to start? Sign up for Middleware and get your server reporting within 30 minutes.
FAQs
What is Windows infrastructure monitoring?
Windows infrastructure monitoring is the continuous tracking of Windows Server metrics like CPU, memory, disk, and network to detect performance issues and prevent outages before they impact users.
What metrics should I monitor on Windows Server?
Monitor Processor Queue Length, Available Memory, Page File Usage, Disk Queue Length, network errors, and Windows Service status to catch performance problems and resource exhaustion.
How often should I collect metrics from Windows servers?
Collect metrics every 15-60 seconds for production servers to catch issues quickly while minimizing agent overhead and data storage costs.
Can I monitor Windows servers in AWS or Azure?
Yes, monitoring agents like Middleware work identically on Windows Server VMs running in AWS, Azure, Google Cloud, or on-premises data centers.
How do I set up alerts for Windows Server?
Set alerts based on thresholds that indicate real problems, such as Processor Queue Length above 2 per core, Available Memory below 15%, or Disk Queue Length above 2, with time windows to avoid false positives.