Summary: Infrastructure monitoring tools give your team visibility into what’s actually happening across your servers, containers, cloud services, and networks before a support ticket tells you something broke. When a node runs out of memory, a network link starts degrading, or a pod enters a crash loop, the right tool surfaces the problem in seconds rather than minutes.
TL;DR
- Infrastructure monitoring tools track servers, containers, networks, and cloud resources in real time to catch issues before users are affected
- Middleware is the strongest all-in-one option for teams wanting metrics, logs, traces, and AI-powered remediation in one platform at predictable cost
- Datadog and Dynatrace are enterprise-grade but expensive at scale — costs compound quickly as infrastructure grows
- Prometheus and Zabbix are powerful open-source options if your team has the capacity to run and maintain them
- For cloud-native workloads, prioritize tools with native Kubernetes support and automatic service discovery
- Always model total cost at 2x your current infrastructure size before committing to per-host pricing
Why do you need infrastructure monitoring tools?
Infrastructure monitoring is the continuous collection and analysis of performance data from servers, containers, networks, databases, and cloud services. It gives engineering teams the visibility to detect resource problems, performance degradation, and outages before they affect users.
Without monitoring in place, your team learns about a problem only from a customer support ticket, after the damage is already done. With the right tooling, you catch a server running low on memory, a pod entering a crash loop, or a network link degrading in real time, and can act before users notice anything. For a deeper look at the fundamentals, see our guide on what is infrastructure monitoring.
Quick Comparison: Best Infrastructure Monitoring Tools
| Tool | Best For | Pricing |
| Middleware | Unified infra monitoring at a fraction of competitor costs | 14-day free trial with unlimited data ingest; $0.30/GB after |
| Datadog | Cloud-native infra monitoring across large, distributed stacks | From $15/host/mo (Infrastructure Pro) |
| Prometheus | Open-source metrics collection for Kubernetes environments | Free (self-hosted) |
| Dynatrace | Auto-discovery and monitoring across hybrid enterprise infra | From $0.04/host/hr (~$29/mo) |
| Zabbix | Full open-source monitoring for on-prem and hybrid environments | Free (self-hosted); Cloud from $50/mo |
| Nagios | Legacy IT and network infrastructure monitoring | Free (Core); from $2,495 (XI) |
| Uptrace | OpenTelemetry-native tracing and metrics for distributed systems | Free (self-hosted); from $30/mo |
| AppDynamics | Enterprise infra and application performance correlation | From $6/vCPU/mo |
| PRTG | Sensor-based monitoring for on-prem networks and servers | Free up to 100 sensors; from $2,149/yr |
| Site24x7 | All-in-one infra monitoring for mid-market IT teams | From $9/mo (Starter) |
10 Best Infrastructure Monitoring Tools
We’ve compiled a list of top infrastructure monitoring tools to help you pick the right solution for your team.
1. Middleware
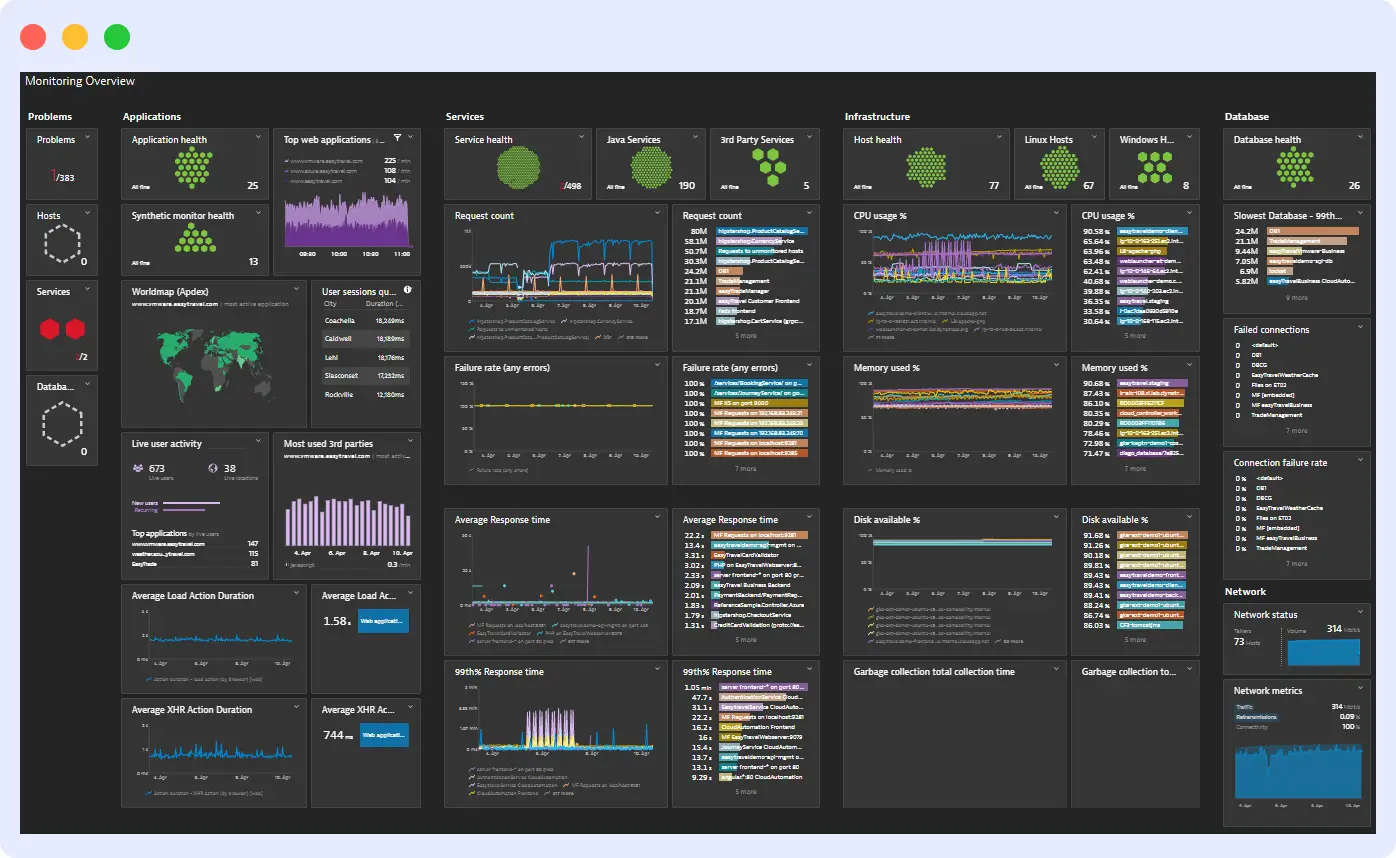
Middleware is a full-stack infrastructure monitoring platform that gives you real-time visibility into your entire infrastructure, including servers, VMs, containers, cloud services, and Kubernetes clusters, through a single dashboard. You can see CPU usage, memory, disk, and network metrics across all your hosts at once, and drill into any resource to understand what is happening at a given point in time.
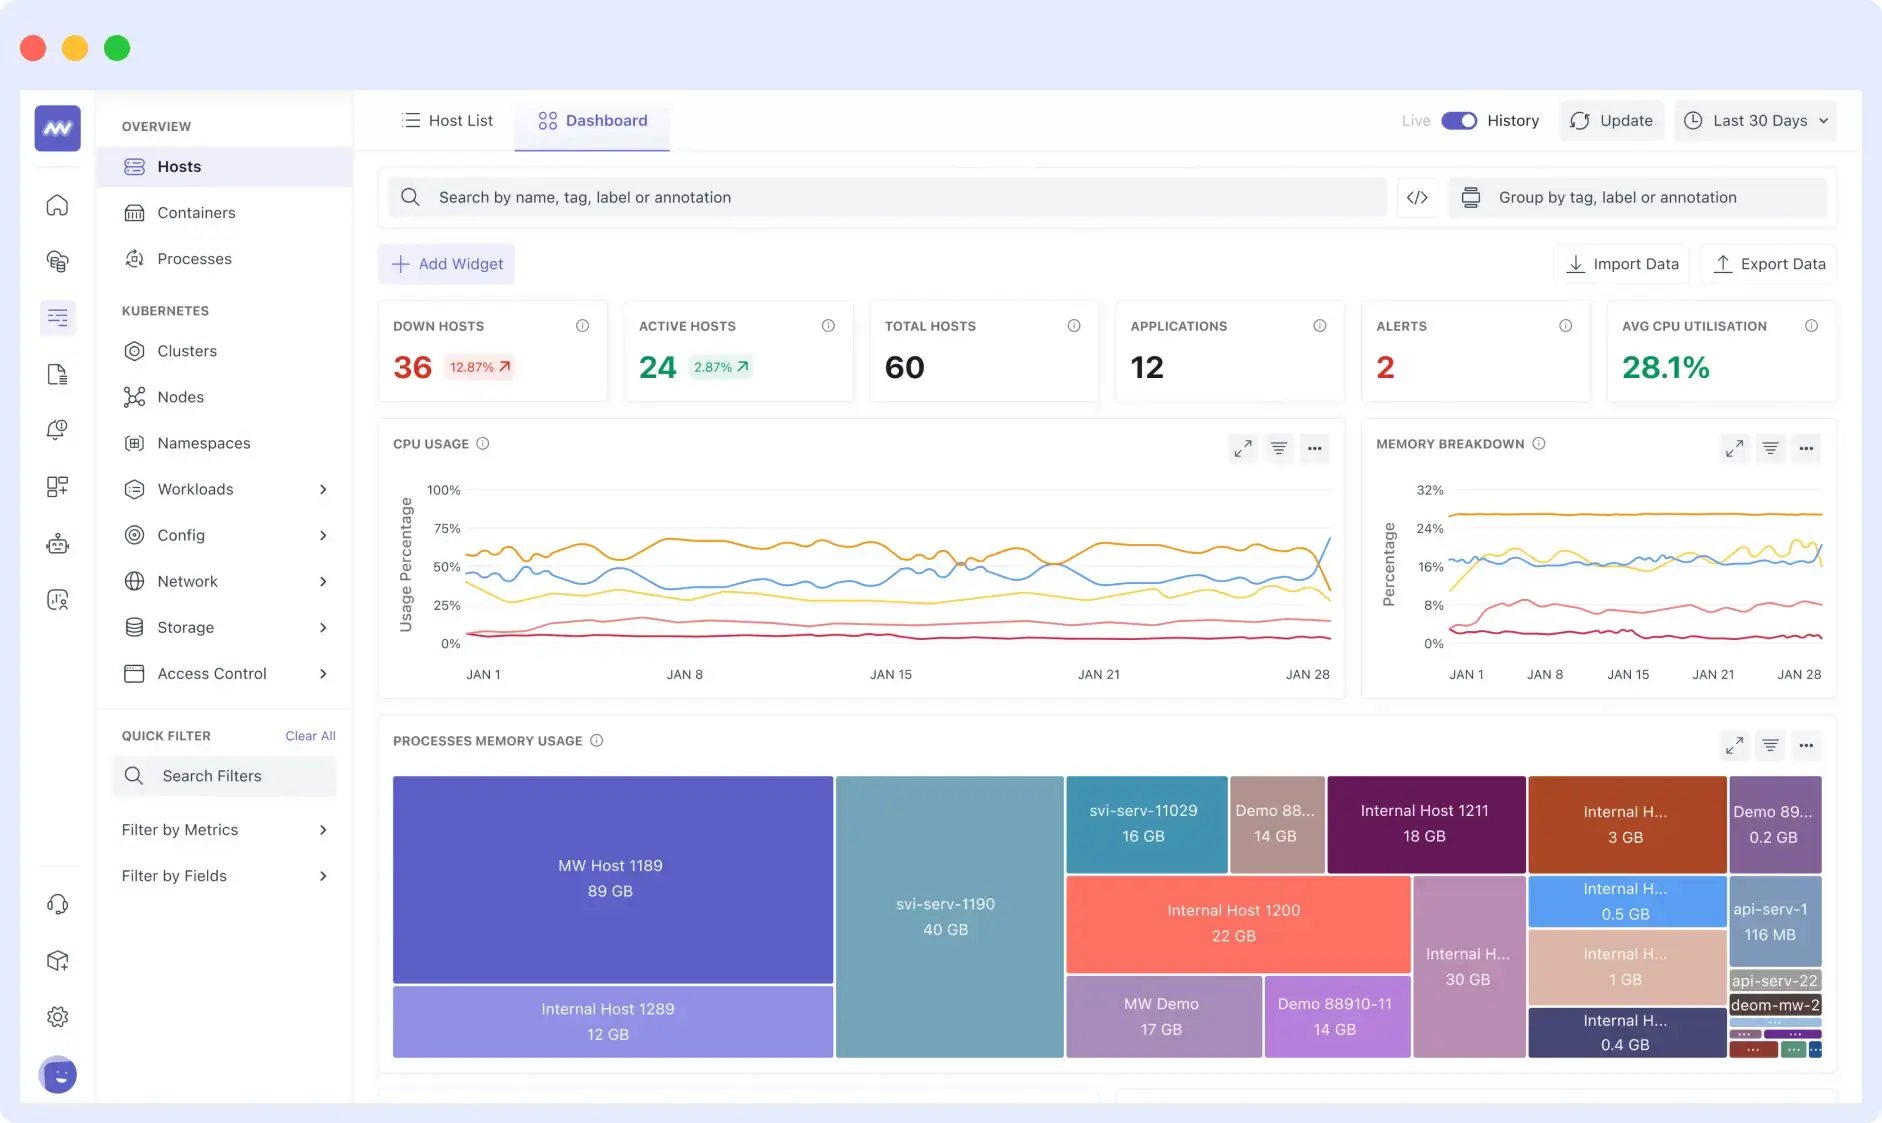
It comes with ready-made dashboards for common infrastructure setups, and alerting is threshold-based, so you can set it up without writing complex queries. For teams watching spend, Middleware lets you turn off individual metrics using tags, so you collect and pay only for what you actually use.
Middleware is a strong fit for DevOps and SRE teams working with cloud-native infrastructure, especially Kubernetes, containers, and microservices based applications. It works well for teams looking to replace multiple monitoring tools with a single platform for logs, metrics, and traces, while keeping observability costs predictable.
Teams that need faster troubleshooting will also benefit from OpsAI, Middleware’s built-in AI SRE agent. OpsAI analyzes telemetry data to identify root causes, suggests fixes, and can automatically open pull requests to resolve issues without an engineer having to manually correlate signals across tools. Internally, OpsAI resolves 50%+ of incidents automatically, rising to 70%+ across beta customers, with an 80%+ improvement in on-call productivity.
Pros
- Real-time visibility into servers, VMs, containers, and Kubernetes clusters
- Works across on-prem, cloud, hybrid, and Kubernetes setups
- Unified platform for infrastructure, APM, logs, traces, RUM, and synthetic monitoring
- OpsAI automatically detects root causes and can apply fixes — reducing on-call load significantly
- Lightweight agent that installs quickly with tag-based metric control to manage costs
- OpenTelemetry-native, so no vendor lock-in on the collection layer
Cons
- A newer platform, though it is rapidly expanding capabilities and seeing strong enterprise adoption
- Smaller community compared to established open-source tools
Pricing
Free trial: 14-day free trial with unlimited data ingestion, 10 browser tests, and 2M OpsAI tokens
Pay as you go: $0.30 per GB for metrics, logs, and traces; $1 per 1,000 RUM sessions; $1 per 5,000 synthetic checks
Enterprise: Custom pricing with volume discounts, extended data retention, on-premises and BYOC deployment, and dedicated support. See Middleware pricing for details.
2. DataDog
Datadog is one of the most widely used observability and system monitoring tools for cloud-native and distributed environments. It monitors hosts, containers, serverless functions, cloud services, and Kubernetes clusters, giving you a clear view of CPU, memory, disk, and network health across all of them. Its 1000+ integrations mean it works with almost any existing stack without much setup. Dashboards are well designed, alerting is flexible, and it holds up well at a large scale.
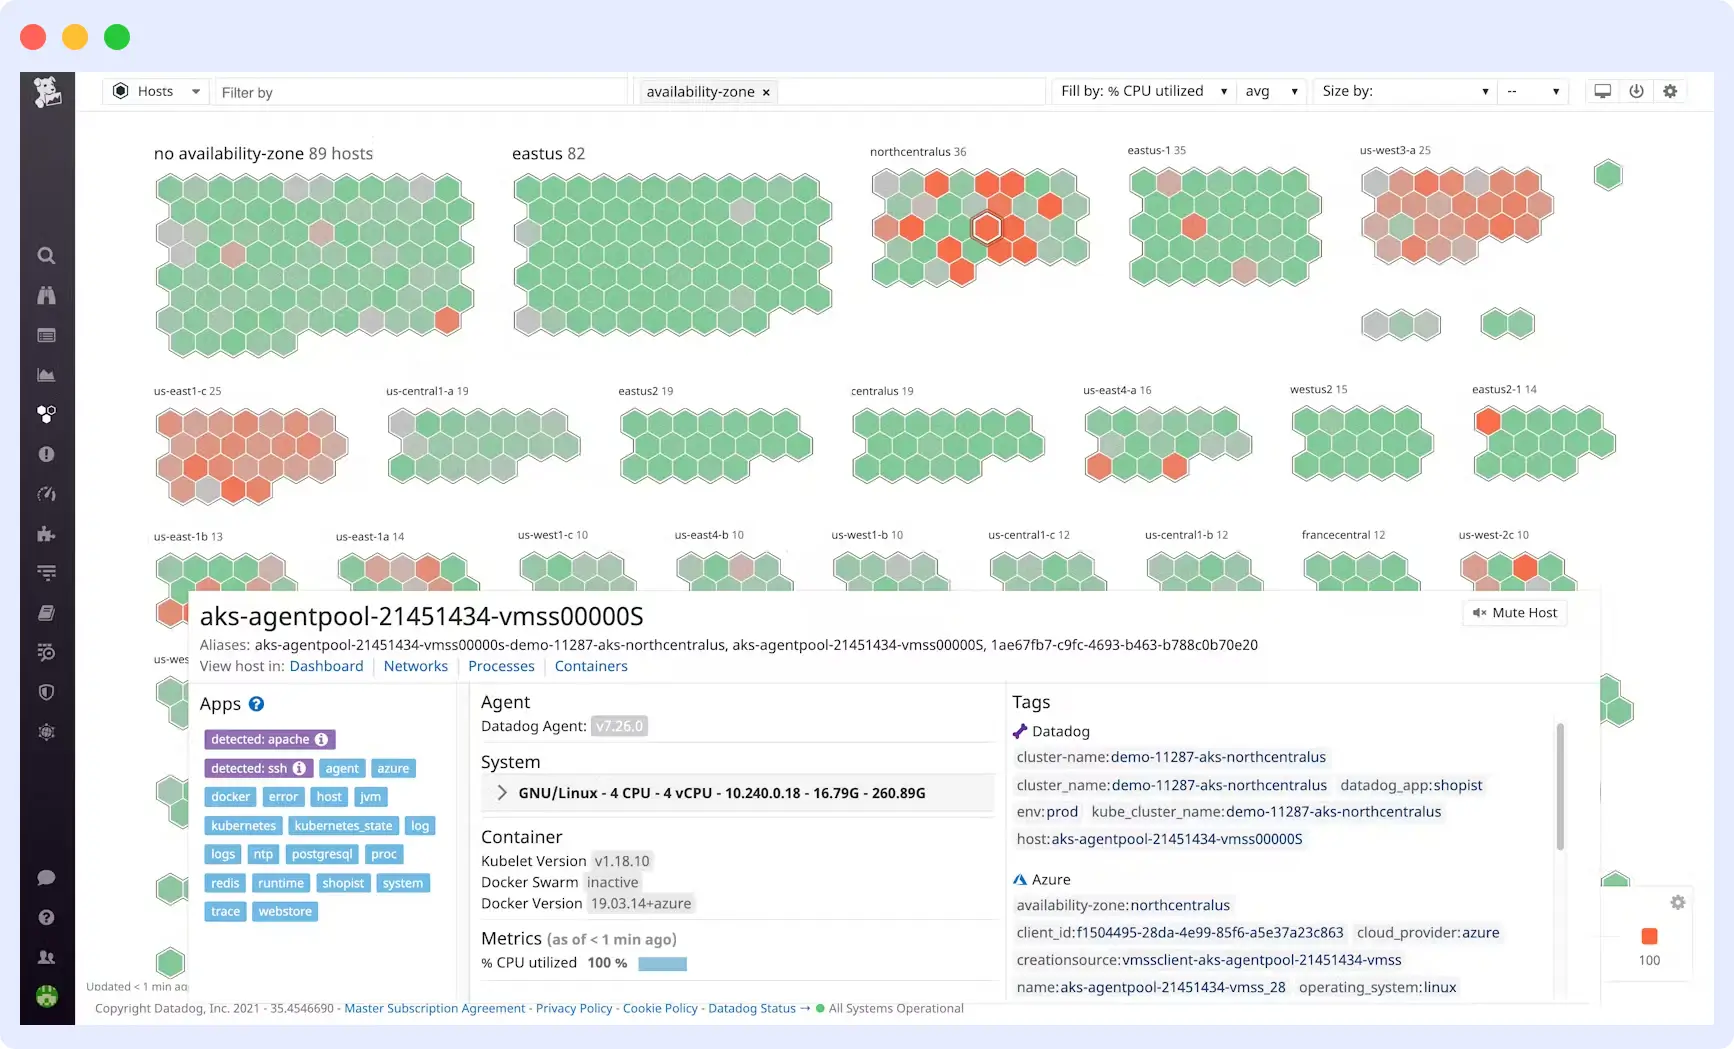
The downside is datadog cost. Datadog charges per host, and as your infrastructure grows, especially when you are running a lot of containers or Kubernetes nodes, the bill goes up fast. Features like log management and APM are billed separately on top of infrastructure monitoring, making it hard to predict monthly costs as usage changes.
👉 Before you commit to Datadog, compare it side-by-side with Middleware.
Read: Middleware vs Datadog – Features, Performance & Pricing.
Pros:
- 1000+ built-in integrations with cloud and infrastructure tooling
- Real-time host, container, and Kubernetes monitoring
- Strong support for AWS, Azure, and GCP native services
- Dashboards and alerts are highly customizable
- Automatic anomaly detection on infrastructure metrics
Cons:
- Per-host pricing gets expensive quickly as your infrastructure grows
- Hard to predict costs as infrastructure, logs, and APM are billed separately
- Takes time to learn, especially for new users
Pricing:
- Free tier: Up to 5 hosts, 1-day metric retention
- Infrastructure Pro: $15/host/mo (billed annually)
- Infrastructure Enterprise: $23/host/mo (billed annually)
💰 “Concerned about Datadog’s costs?”
See our breakdown: Datadog Pricing – Is It Worth It in 2026?
3. Prometheus
Prometheus is the standard open-source system monitoring tool for collecting and storing infrastructure metrics. It pulls metrics from your hosts, servers, and containers at set intervals, stores them as time-series data, and lets you query and set alerts using PromQL. Most tools in the Kubernetes world already export Prometheus-compatible metrics, so it slots in without much extra work. For a deeper look at what Prometheus does and how it compares, see our guide on what is Prometheus.
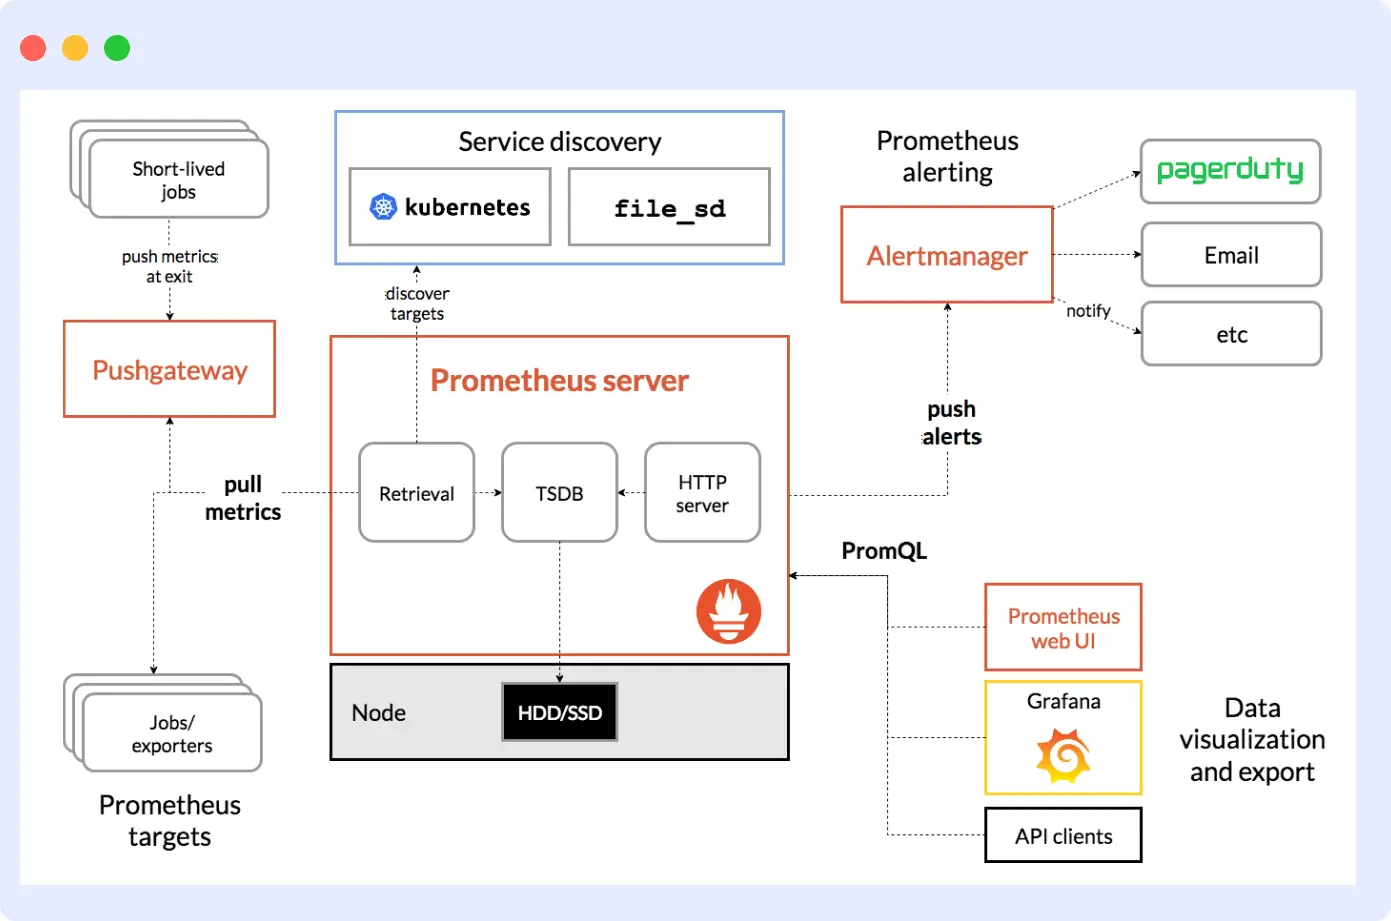
Running it in production does require real investment, though. There is no built-in long-term storage, so most teams add Thanos or VictoriaMetrics to handle retention. Grafana is usually added separately for dashboards and charts. You run all of it yourself, which means keeping it up, scaling it, and maintaining it all falls on your team.
Pros:
- Natively tracks host, container, and Kubernetes resource metrics
- PromQL gives you flexibility for queries and alerts on infrastructure data
- No outside dependencies needed to get started
- Large, active community with plenty of integrations
Cons:
- No built-in long-term storage
- You are responsible for running, scaling, and maintaining it yourself
- PromQL takes time to learn
- Needs Grafana separately for dashboards
Pricing:
- Self-hosted: Free
- AWS Managed Prometheus: ~$0.90/10M samples ingested
- Grafana Cloud: Free for the first 10,000 series; $8/1,000 series after
4. Dynatrace
Dynatrace is built for large organizations running complex infrastructure across multiple clouds, where setting things up host by host just does not work at that scale. Its OneAgent automatically finds every host, container, process, and cloud service in your environment and starts collecting CPU, memory, network, and disk metrics without you having to configure each one manually. It also maps how your infrastructure components connect to each other, so when something goes wrong, you can see at a glance what is affected.
That level of automation is genuinely useful when you are managing hundreds of hosts across different environments. For smaller teams or more straightforward setups, the complexity and cost are hard to justify. Looking for an alternative? See how Middleware compares to Dynatrace.
Pros:
- OneAgent automatically discovers and monitors every host and container without manual setup
- Maps dependencies across your full infrastructure automatically
- Strong support for Kubernetes, AWS, Azure, GCP, and OpenShift
- Handles hybrid and multi-cloud environments well
- Alerts on infrastructure problems with context, not just raw numbers
Cons:
- Gets expensive quickly as you add more hosts
- Uses its own query language, which ties you to the platform
- Takes time to get comfortable with, especially when starting out
Pricing:
- Infrastructure Monitoring: $0.04/host/hr (~$29/mo per host)
- Full-Stack Monitoring: $0.08/hr for an 8 GiB host (~$58/mo)
- Kubernetes monitoring: $0.002/hr per pod
5. Zabbix
Zabbix is a well-established open-source monitoring tool built for tracking the health of networks, servers, VMs, containers, and databases. It supports both agent-based and agentless monitoring via protocols such as SNMP, IPMI, and SSH, making it flexible enough to handle mixed environments that some commercial tools handle poorly.
It is free to use, and a basic setup can be running in under ten minutes. The challenge comes when configuring it for larger or more complex environments, which takes time and patience. The documentation is thorough, but there is still a real learning curve.
Pros:
- Tracks servers, VMs, containers, networks, and databases
- Supports agent-based and agentless monitoring across different infrastructure types
- Large library of ready-made templates for common platforms
- Automatically finds devices and hosts on your network
- Runs on-prem, in the cloud, or a mix of both
Cons:
- Initial setup can be complex for people new to it
- Scaling to very large environments needs extra tuning
- Paid support is required for enterprise-level help
Pricing:
- Self-hosted: Free forever
- Zabbix Cloud: From $50/mo (managed version)
- Paid support and consulting are available separately
6. Nagios
Nagios has been around since 1999 and is still widely used in traditional IT environments, particularly for server and network monitoring. It runs on a plugin-based setup where you define exactly what gets monitored and how alerts fire. That flexibility is its biggest strength, with plugins available for almost any piece of infrastructure you need to track.
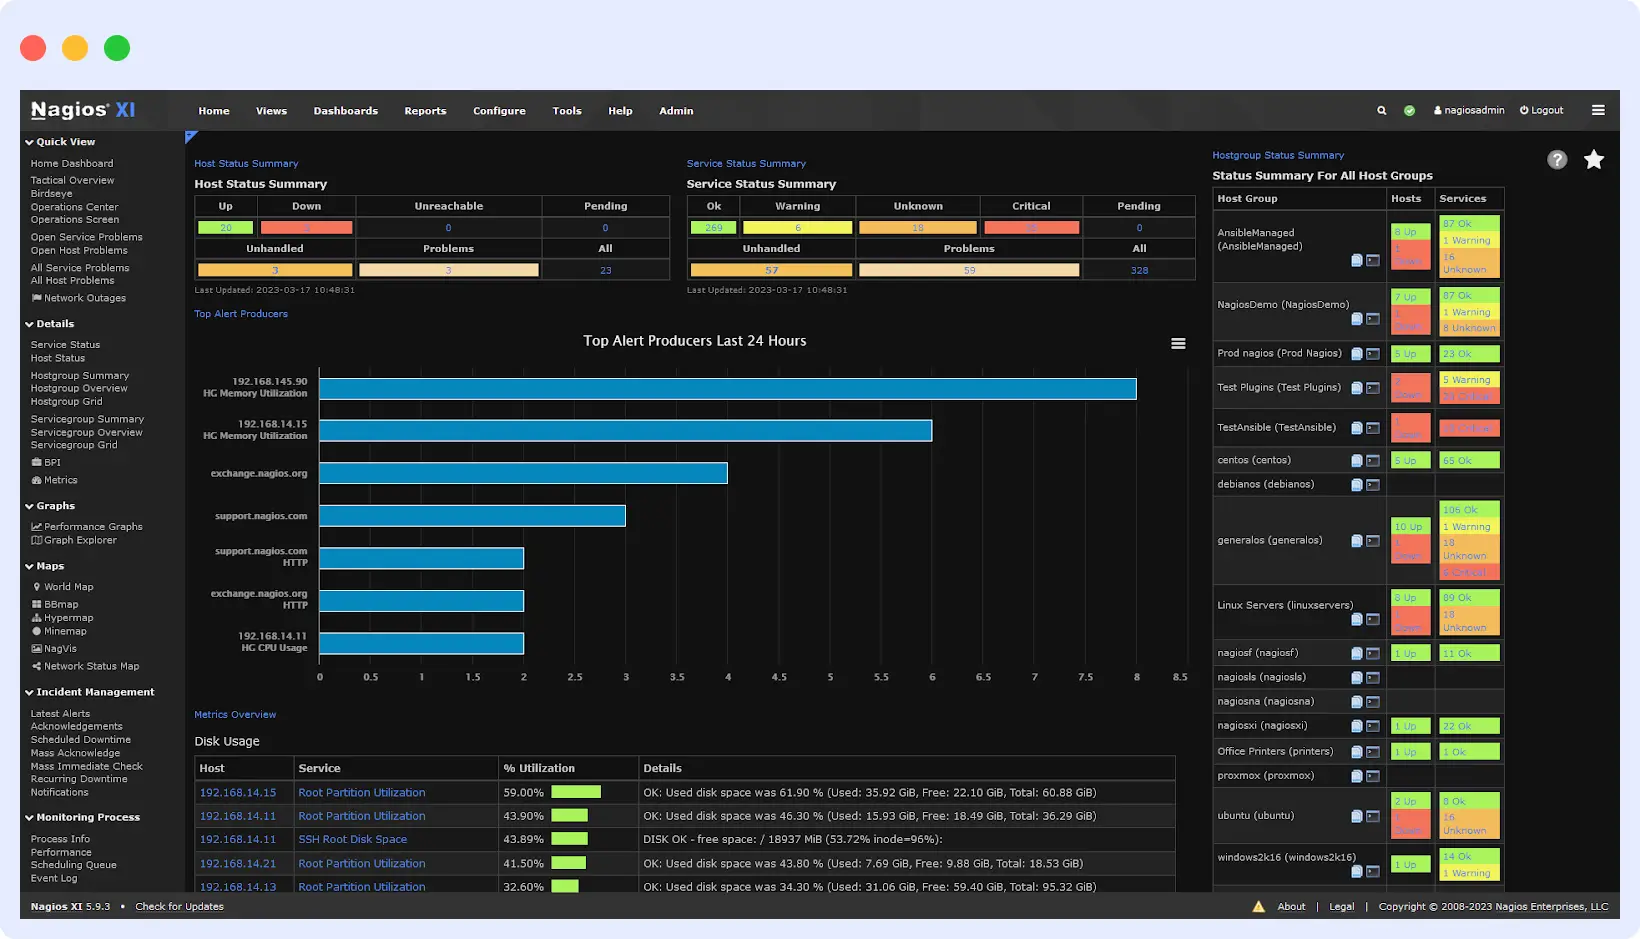
It comes in two versions: Nagios Core (free, open-source) and Nagios XI (paid, with a more modern interface and extra features). Core is still heavily used in older environments, but everything is configured through files, which feels dated next to newer tools. XI makes that easier, but at a cost.
Pros:
- Very flexible through plugins, as it covers servers, network devices, and virtually any infrastructure component
- Strong alerting with custom notifications and escalation rules
- Proven reliability over many years of real-world use
Cons:
- Core’s file-based setup is time-consuming and not beginner-friendly
- The interface, especially in Core, looks and feels old
- Some features require the paid XI version or significant extra work to set up
Pricing:
- Nagios Core: Free and open-source
- Nagios XI Standard: From $2,495 (one-time license)
- Nagios XI Enterprise: From $4,490 (one-time license)
7. Uptrace
Uptrace is an open-source IT infrastructure monitoring tool built on OpenTelemetry. It collects infrastructure metrics, traces, and logs from your servers, containers, and cloud services and consolidates them into a single place. Because it is built on OpenTelemetry, it integrates with whatever you are already running, without replacing your existing setup.
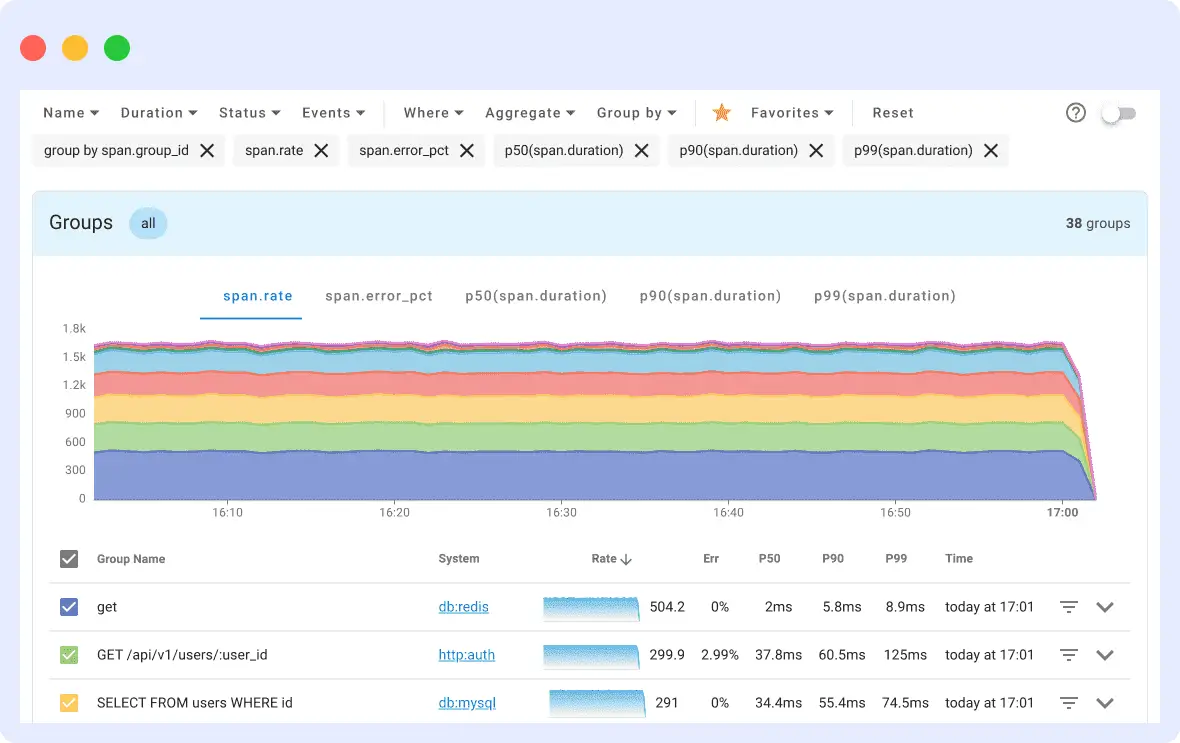
It is a good fit for teams that want to monitor their infrastructure without being tied to a single vendor. That said, you will need a solid understanding of OpenTelemetry to configure it and get the most out of it, and the ecosystem is smaller than that of commercial tools.
Pros:
- Collects infrastructure metrics, traces, and logs in one place
- Built on OpenTelemetry and also works with your existing instrumentation
- Connects with Prometheus, FluentBit, Vector, CloudWatch, and more
- Pricing is based on data volume, so it stays predictable
Cons:
- Requires a solid understanding of OpenTelemetry to set up properly
- Fewer integrations than more established tools
- Smaller community compared to commercial platforms
Pricing:
- Community Edition: Free (self-hosted)
- Cloud plans: From $30/mo, based on how much data you send in
8. App Dynamic
AppDynamics (now part of Cisco) monitors your servers, containers, cloud environments, and databases and shows you how the health of each affects the rest of your infrastructure. It tracks CPU, memory, and overall resource usage across hosts, and provides a dependency map showing how a struggling server can affect other servers connected to it. Additionally, the platform supports both cloud-hosted and self-hosted deployments, giving larger organizations more flexibility in how they run it.
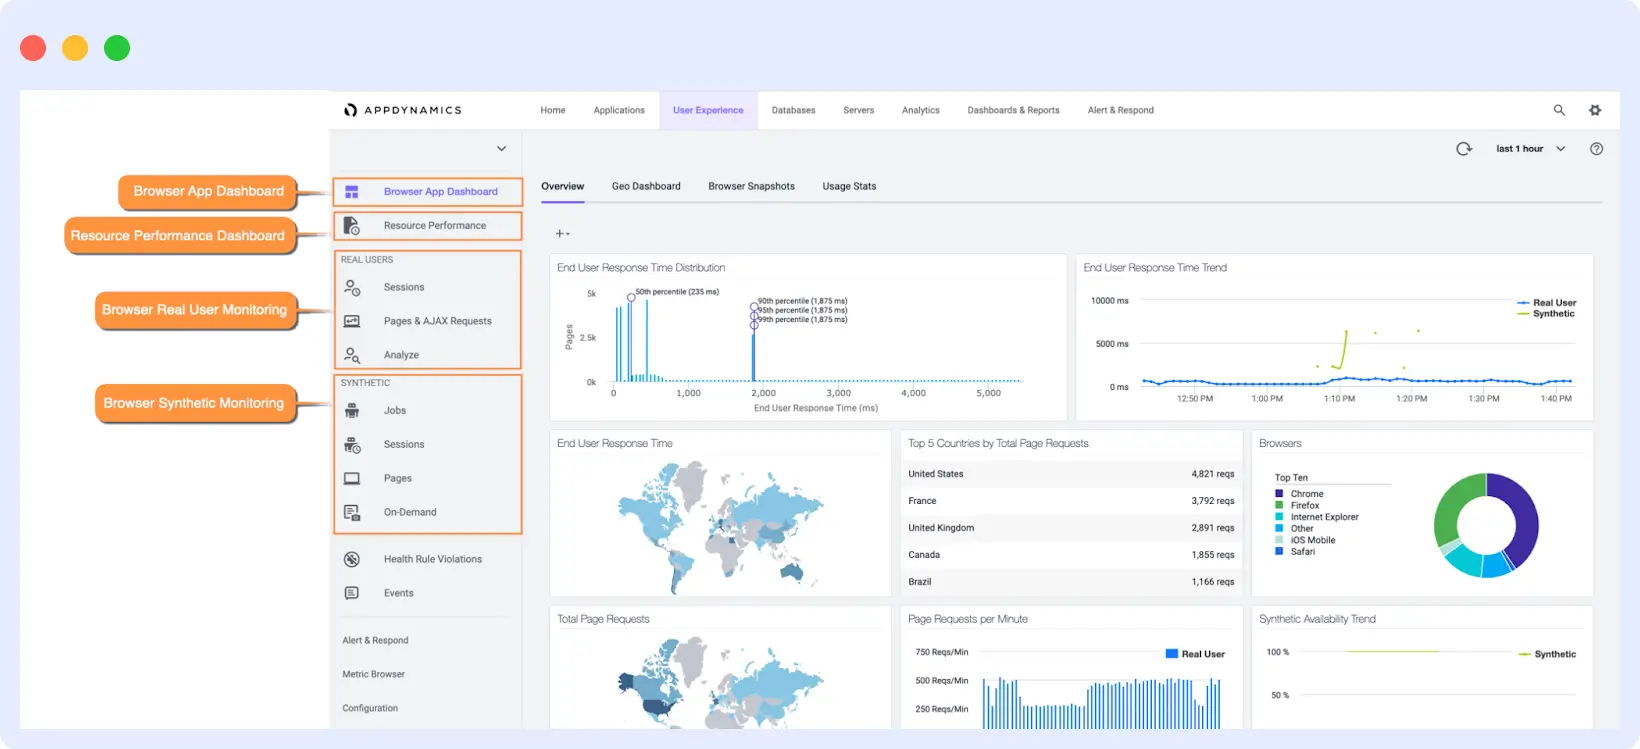
It is built for large enterprises with complex, multi-layer infrastructure. For smaller teams or simpler environments, the cost and setup time are hard to justify.
Pros:
- Tracks server, container, and cloud resource health in one place
- Dependency mapping shows how infrastructure issues spread across your environment
- Works with both cloud-hosted and self-hosted deployments
- Handles multi-cloud and hybrid infrastructure setups
- Detailed host-level diagnostics for finding resource bottlenecks
Cons:
- Expensive, especially in large environments
- Takes time to learn and get fully set up
- Some monitoring capabilities are priced as separate add-ons
Pricing:
- Infrastructure Monitoring: From $6/vCPU/month
- Advanced plans: From $33/vCPU/mo and $50/vCPU/month
9. Paessler PRTG
PRTG monitors your infrastructure through sensors, and each sensor watches a specific aspect, such as a network interface, a server’s CPU load, a disk’s free space, or bandwidth usage on a switch. This gives you precise control over exactly what gets tracked across your infrastructure and avoids collecting data you do not need.
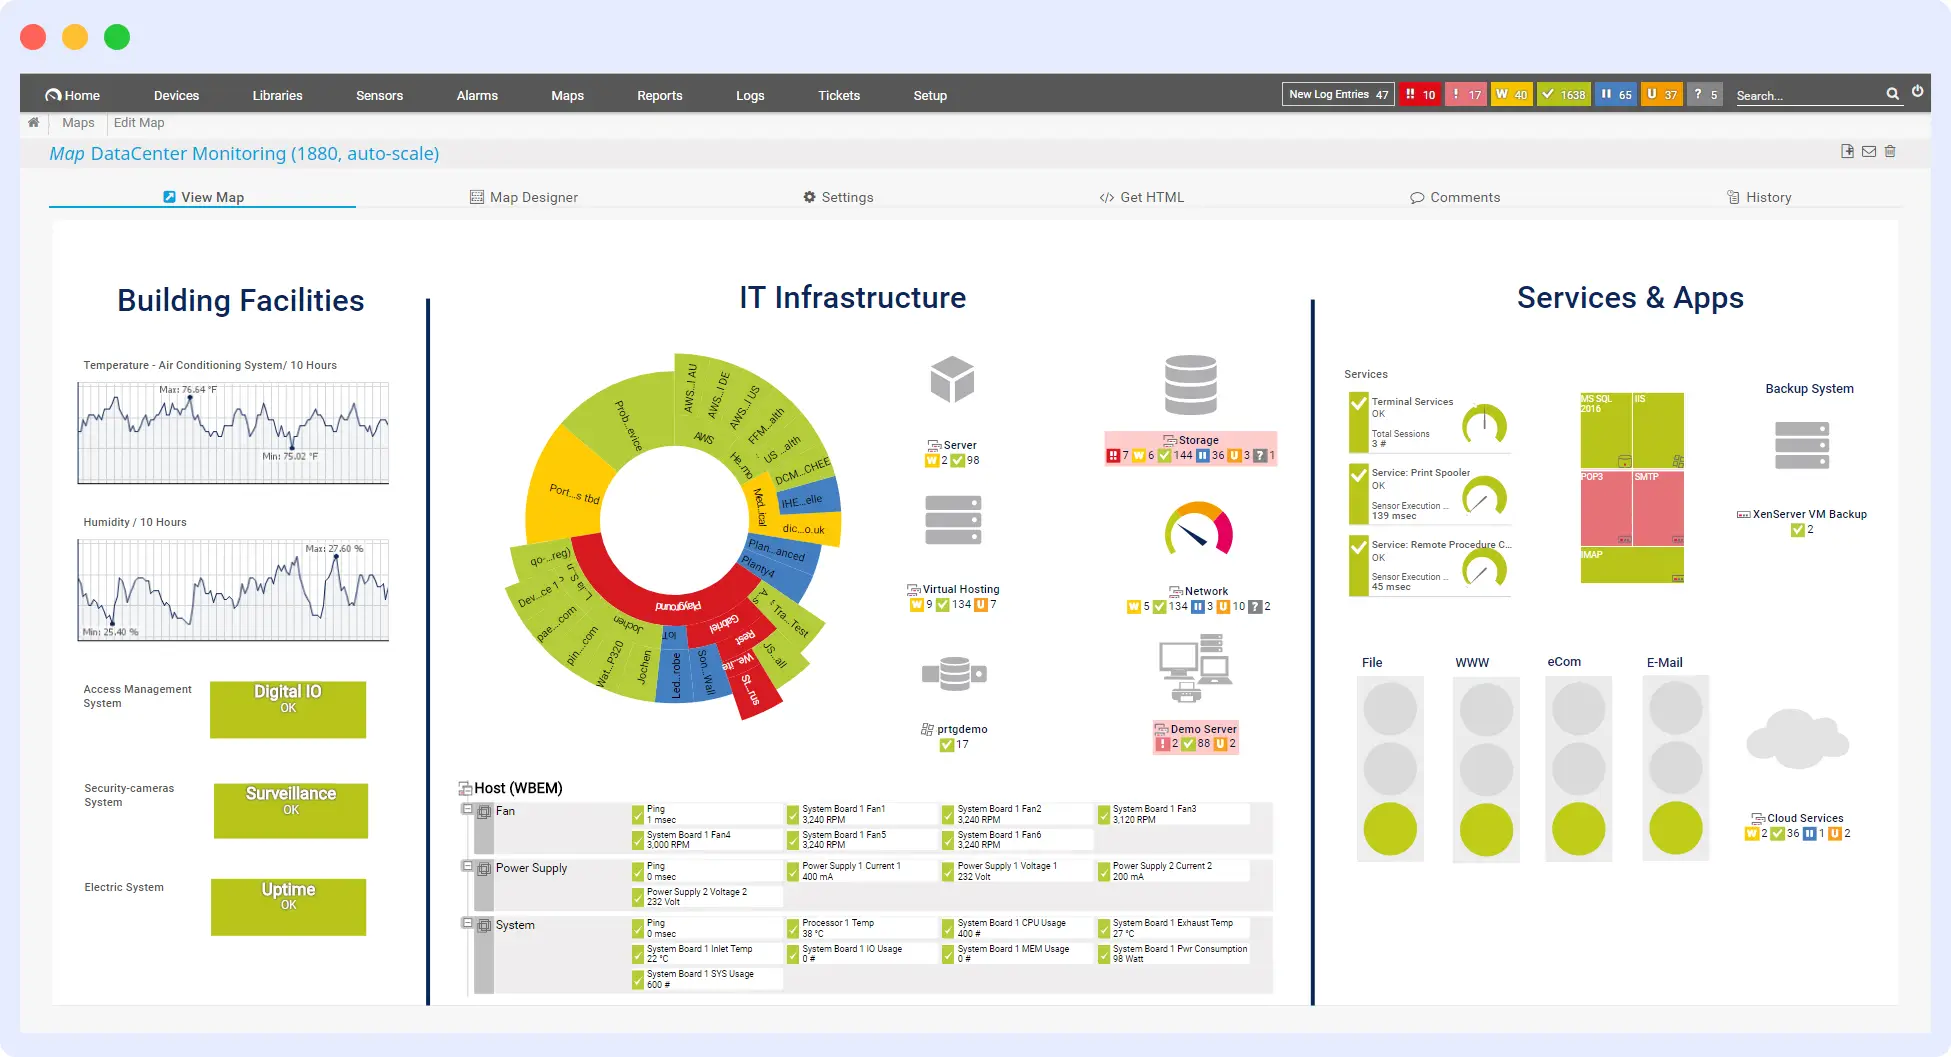
It works particularly well for on-prem environments with networks, servers, and hardware devices. Setup is not complicated, and the built-in map editor lets you build a visual layout of your infrastructure. It gets costly when your infrastructure scales because each monitored component needs its own sensor.
Pros:
- Track exactly what you need. Each sensor monitors one specific infrastructure component
- Good fit for on-prem servers, network devices, and hardware
- Visual map editor for custom infrastructure layouts
- Works with SNMP, WMI, SSH, and other standard protocols
- Real-time alerts via email, SMS, and push notifications
Cons:
- Not well-suited for cloud-native or container-heavy environments
- Costs grow as you add more things to monitor
Pricing:
- Free: Up to 100 sensors
- PRTG 500: From $2,149/yr (500 sensors)
- PRTG 1000: From $3,399/yr (1,000 sensors)
- PRTG Hosted Monitor: From $149/mo
10. Solarwinds AppOptics
SolarWinds AppOptics is a SaaS-based infrastructure monitoring tool that gives you a single dashboard view across all your hosts, containers, and servers. It tracks CPU, memory, disk, and network performance at the host level and uses color-coded heat maps to make it easy to spot which servers are under strain at a glance. Dashboards update in real time as servers and containers are added or removed, so you are always looking at your actual infrastructure rather than a stale snapshot.
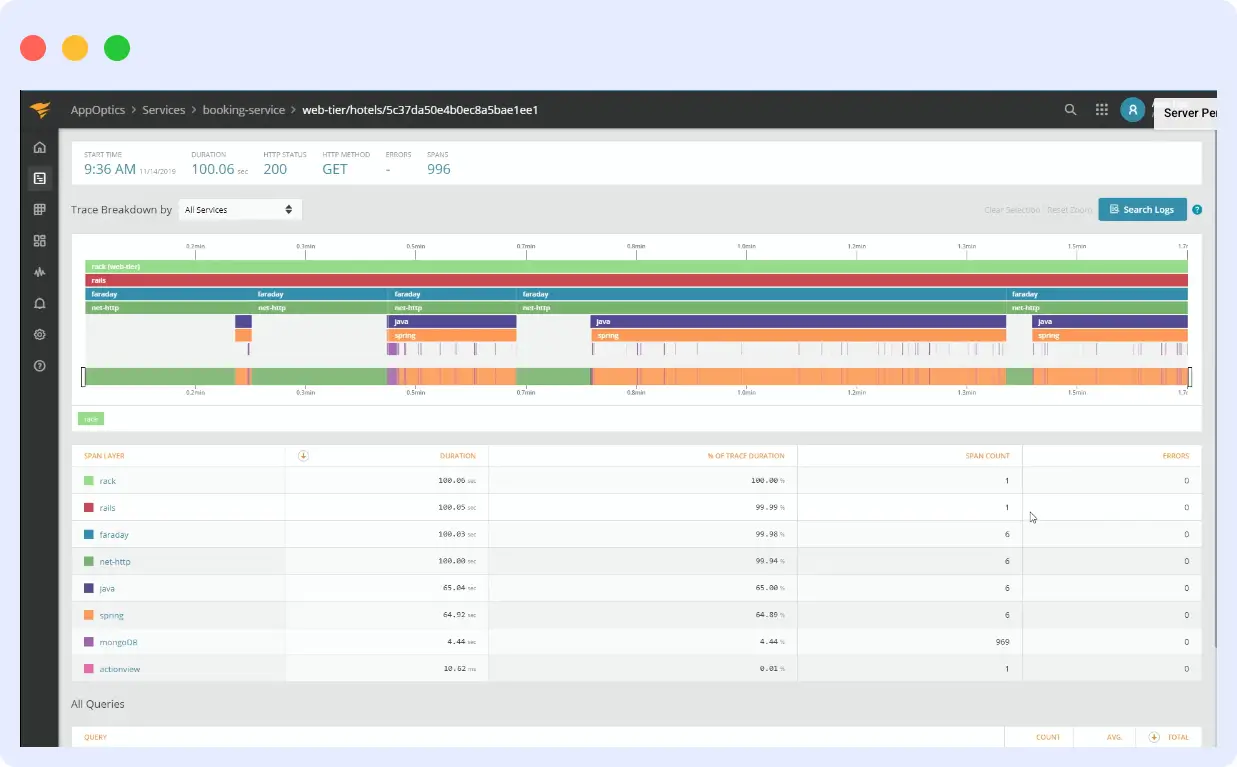
It covers on-prem, cloud-hosted, and hybrid environments and comes with 150+ integrations out of the box. Setup is straightforward, and the alerting system lets you set custom thresholds and get notified before a resource issue escalates.
Pros:
- Real-time host and container monitoring with heat maps for quick visibility
- Dashboards update automatically as your infrastructure changes
- 150+ integrations, including AWS and Azure services
- Works across on-prem, cloud, and hybrid environments
- Simple per-host pricing with no surprise charges
Cons:
- Sold in packs of 10 hosts, so pricing is not as granular for very small setups
- Less suited for very large, complex Kubernetes environments
- Fewer infrastructure-specific features compared to more established enterprise infrastructure monitoring tools
Pricing:
- 30-day free trial available
- Infrastructure Monitoring: $9.99/host/mo (billed annually, sold in packs of 10 hosts)
How to Choose an Infrastructure Monitoring Tool
Before shortlisting any tool, run through these four checks:
- What does your setup look like? Are you running traditional servers on-prem or in the cloud, or containerized workloads? If your workloads are short-lived and containerized, you need a tool built from the ground up for that, not one that adds container support as an afterthought.
- How much data do you actually need? If your setup is straightforward, tracking core metrics such as CPU, memory, disk, and network usage might be enough. But if you are running many servers or Kubernetes clusters and need to understand exactly where a resource problem originates, you will want a tool that provides deeper visibility across your hosts. Trying to piece that together from separate tools later is more work than it is worth.
- How much do you want to manage yourself? Self-hosted tools give you full control, but keeping them running, scaling them, and staying on top of updates are up to you. If your team would rather not deal with that, a managed platform saves time even if the monthly cost looks higher.
- What will it cost as you grow? Pricing that looks reasonable now can get expensive fast once you have more servers, more data, or more team members using the tool. Before you commit, think about where your infrastructure will be in a year and check whether the pricing still makes sense at that size.
Conclusion
Every tool on this list works well for the right team and setup. Open-source options make sense if your team has the time and skills to run them. The larger commercial platforms are a good fit for big organizations that need a wide range of integrations and are willing to pay for them. For most teams, the real question is how much visibility you need versus how much you want to spend and manage.
If you want metrics, logs, and traces in one place without the complexity or the price tag of the bigger platforms, Middleware is worth trying.The 14-day free trial lets you test with your real infrastructure before spending anything. Start for free with Middleware

FAQs
What metrics should infrastructure monitoring tools track?
The core metrics are CPU utilization, memory usage, disk I/O and capacity, and network throughput and latency. For containerized environments, you also want pod restart counts, container resource limits, node pressure, and Kubernetes event streams. For cloud workloads, add service-level metrics like Lambda invocation errors, RDS connection counts, or load balancer response times depending on your stack.
How is Middleware different from Datadog for infrastructure monitoring?
The main differences are pricing model and platform scope. Datadog charges per host and bills infrastructure, logs, and APM separately, which makes costs hard to predict at scale. Middleware uses a unified per-GB pricing model across all signals, and includes logs, traces, APM, RUM, synthetic monitoring, and OpsAI in one platform. Middleware is also OpenTelemetry-native, which avoids vendor lock-in on the collection layer. See the full Middleware vs Datadog comparison.
What is OpsAI and how does it help with infrastructure monitoring?
OpsAI is Middleware’s built-in AI SRE agent, GA’d in May 2026. When an infrastructure alert fires, OpsAI automatically analyzes correlated telemetry across metrics, logs, and traces to identify the root cause — without an engineer having to manually correlate signals. It can suggest fixes, open pull requests to apply them, and handle Kubernetes debugging autonomously. Internally, OpsAI auto-resolves 50%+ of incidents; across beta customers, that rises to 70%+. See the OpsAI product page for details.
What should I look for in a Kubernetes infrastructure monitoring tool?
Kubernetes-specific requirements include: automatic pod and service discovery (so you do not need to reconfigure monitoring every time a deployment changes), namespace and label enrichment on metrics and logs, node pressure and resource limit tracking, and visibility into pod restart counts and OOMKill events. The tool should also handle the ephemeral nature of containers — metrics from a pod that no longer exists should still be queryable for post-incident analysis. See our guide on Kubernetes monitoring for a full breakdown.