You are using an app, and everything works well and smoothly until the app suddenly crashes. A page is not loading, a feature crashes, or the app just freezes. Now imagine you’re the developer responsible for fixing it. Where do you even start?
This is where application logs come in. They act like a behind-the-scenes diary, logging everything your app does: errors, user actions, and system events. So you can track down issues faster.
In this blog, we’ll dive into the essentials of application logging and monitoring, covering log types, best practices, and tools that make troubleshooting easier.
New to Logs? Discover what logs are and why they’re essential for system visibility.
Read What Are Logs?
Understanding Application Logs
Application logs are formalized records that record/log events within a software system. They contain in-depth information about an application’s behavior, user activity, system processes, errors, and performance measurements. By formally recording these events, application logs are an important tool for debugging, system stability, and performance optimization.
These logs are priceless for debugging, performance monitoring, and security analysis.
What application logs usually capture are:
- System events such as process starts/stops or server restarts.
- User activities like login attempts, form submissions, etc.
- Errors and exceptions, including stack traces and debug information.
- Performance measurements, such as response times or memory usage.
- They serve as a forensic instrument in post-mortems, a compliance checkpoint for security, and a daily tool to optimize app performance.
Types of Application Logs
Application logs can be categorized based on the type of information they record. Each log type serves a distinct purpose in monitoring and managing application performance.
1. Access Logs
Access logs keep track of user interactions, including details like IP addresses, the types of requests made, and the statuses of responses. They’re essential for monitoring website traffic, spotting unauthorized access, and understanding user behavior.
To access logs in Middleware, the user will have to install our agent with this command.
MW_API_KEY=xxxxxxxxxxxxxxxxxxxxx MW_TARGET=https://xxxxx.middleware.io:443 bash -c "$(curl -L https://install.middleware.io/scripts/deb-install.sh)"
And all the logs coming under /var/log directory will be collected ( also /var/log/apache2/access.log )
Scenario: A financial app notices several login attempts from various locations. Access logs revealed a credential stuffing attack, triggering a security alert.
INFO 2025-04-25 10:10:05.123 User 'user_sam' login attempt from IP: 192.168.1.1
INFO 2025-04-25 10:10:10.234 User 'user_sam' login attempt from IP: 172.16.4.2
INFO 2025-04-25 10:10:15.456 User 'user_sam' login attempt from IP: 10.0.0.3
WARN 2025-04-25 10:10:20.678 Multiple login attempts detected for user 'user_sam' from different locations within 5 minutes
ERROR 2025-04-25 10:10:30.789 Credential Stuffing Attack detected for user 'user_sam' - Triggered security alert
“Since implementing Middleware, we have witnessed a substantial enhancement in system performance, marked by a reduction of downtime incidents by half and a nearly 50% decrease in Mean Time To Resolve (MTTR). This significant improvement has enabled us to deliver a more stable and reliable experience for our users, minimizing disruptions and ensuring seamless operations.”
Krishna Charan BS, Information Security Head, MindOrigin
2. Authentication Logs
These logs monitor login attempts, recording both successful and failed sign-ins along with timestamps and IP addresses. They’re crucial for identifying login anomalies and preventing unauthorized access.
Scenario: A cloud service sees repeated failed logins from an unfamiliar location. Security teams enforce multi-factor authentication to block unauthorized access.
3. Authorization Logs
Authorization logs track permission changes, capturing when users gain or lose access to resources. They help prevent privilege misuse and ensure security compliance.
Scenario: A user unexpectedly gains admin rights. Logs reveal an accidental permission change, prompting a quick rollback by IT.
ERROR 2025-04-25 16:05:12.654 Unexpected permission change detected - User 'sam_suthar' granted admin rights
INFO 2025-04-25 16:05:15.123 Permission change: User 'sam_suthar' role changed from 'User' to 'Admin'
ERROR 2025-04-25 16:05:18.789 Stack Trace: at UserService.updatePermissions(...)
INFO 2025-04-25 16:06:00.987 Rollback initiated - User 'sam_suthar' role reverted to 'User'
INFO 2025-04-25 16:06:15.432 Permission rollback completed successfully
4. Error Logs
Error logs store details of application failures, including error codes and stack traces. They help developers diagnose and fix software issues.
Scenario: The payment gateway fails for some users. Logs indicate an API format change, allowing developers to revert and fix the issue.
ERROR 2025-04-25 15:22:05.987 PaymentGateway API Error - Invalid Response Format
ERROR 2025-04-25 15:22:06.123 Stack Trace: at PaymentGatewayService.processPayment(...)
ERROR 2025-04-25 15:22:06.456 Request ID: 75b4d6a3-e0c7-4c2b-a263-438d5b36ff9f
5. Change Logs
Change logs document updates, deployments, and system modifications. They help track software changes and diagnose post-update issues.
Scenario: A new app release slows down loading times. Logs reveal a missing optimization, guiding developers to restore performance.
6. Availability Logs
Availability logs monitor system uptime, response times, and outages. They help detect downtime causes and optimize performance.
Scenario: A streaming service buffers frequently during peak hours. Logs showed high server load, prompting engineers to scale the infrastructure.
To help illustrate the format of availability logs, here is an example of what a typical server uptime log might look like:
INFO 2025-04-25 14:45:11.123 Service 'PaymentGateway' is UP
INFO 2025-04-25 14:45:11.456 Service 'PaymentGateway' is DOWN
WARN 2025-04-25 14:45:11.789 Service 'PaymentGateway' is UP after 5 minutes of downtime
Common Challenges in Application Logs Management
Application logs are important for system monitoring, debugging, and security, but managing them also has its challenges. With increasing scale in applications and the distribution of architectures, logging is a more complex problem. Without a proper plan, teams will experience incident delays, storage expenses, and severe security issues.
1. Logs Scattered Across Multiple Systems
In today’s distributed systems, logs are commonly created by services scattered across cloud infrastructures, containers, and APIs. Without a centralized view, correlating events between systems is labor-intensive.
Fragmentation slows down the resolution of issues and raises the chances of missing key context. Displaying logs in a centralized view is a major challenge often faced by teams.
2. Lack of Structured Formatting.
Plain text or irregularly formatted logs are hard to parse and automate. Without a standard log format, tools cannot easily extract important fields such as timestamps, error codes, or user IDs.
This results in increased time spent manually interpreting logs during an incident. It also restricts the possibility of executing efficient queries or visualizing patterns. If the logs are not in the correct format, automation will not work effectively.
3. No Clear Log Levels or Filtering
If they’re all marked the same, for example INFO or DEBUG, it’s difficult to distinguish normal behavior from real issues. Without distinct error and warning log levels, serious issues get lost among normal output. Filtering becomes useless and adds noise to dashboards and alerts. During outages, it delays root cause identification.
Confused about log levels? Learn how each level impacts observability and debugging.
4. Security Risks
Logs tend to record sensitive information such as authentication tokens, IP addresses, or individual user information. Logs can be a significant security threat if they are not masked, encrypted, or access-controlled.
Exposed log information in the wrong hands can result in breaches or compliance violations such as GDPR and HIPAA. This issue increases as logging volume grows across systems.
5. High Log Volume and Storage Overhead
As more traffic is generated by applications, log data can rapidly grow to terabytes. The storage of logs forever increases storage expenses and decreases logging tools’ performance. It may be difficult for teams to identify helpful logs amid massive data sets as well. Without defined retention policies, storage gets filled and out of control.
6. Limited Real-Time Visibility
Most teams continue to use batch log analysis, where insights are minutes or hours after the events have happened. This latency allows critical failures to go undetected until users complain. This lowers responsiveness and raises mean time to resolution (MTTR). Real-time awareness is crucial for today’s DevOps and incident response teams.
How to Overcome Application Logging Challenges: Best Practices
Log management isn’t really about gathering data—it’s about making data valuable. Whether debugging a live problem or searching for performance bottlenecks, adhering to a few major practices can dramatically improve how effective and secure your logging infrastructure is.
1. Centralize and Aggregate Application Logs
Logs can come from various sources, servers, databases, and third-party integrations. By storing them in a centralized logging system, you make monitoring and debugging a whole lot easier.
If you’re monitoring each individually, you’re wasting your time. Centralizing logs into one location provides you with a single, unified perspective of what’s occurring throughout your entire stack.
When to use it: If you’re operating in a multi-cloud or microservices environment, centralization is not an option. It’s the only way to get visibility into how everything ties together.
2. Structured, Human-Readable Formats
Ever attempted to read raw logs full of cryptic strings and half-broken lines? Not enjoyable. That’s why structured formats such as JSON or key-value pairs are the safer choice. They are easier to scan and easier for tools to process and analyze.
Easy formatting allows you to identify patterns, debug quickly, and integrate your logs into dashboards or alerts with ease.
3. Establish Clear Retention and Storage Policies
Not all logs will survive forever. Keeping everything just fills up storage and makes things drag. Instead, establish how long various logs must be retained: short-term for debugging information, long-term for audit trails or compliance logs.
Store debug logs for a few days while keeping security-related logs for months, depending on your policies.
4. Establish Log Levels That Actually Matter
Use your log levels as categories; not all logs need to be labeled as “INFO” or “DEBUG.” Reserve levels such as ERROR, `WARNING`, or `CRITICAL` for important things, and DEBUG or INFO for more mundane entries. This makes filtering out the noise and seeing what needs to get done a whole lot simpler.
5. Be Smart About Sensitive Data
Logs tend to pick up more than you know. If they contain passwords, tokens, or private user information, that’s a significant risk. Always encrypt or mask anything sensitive and ensure that only authorized individuals access logs.
A single leaked log can lead to a data breach—or worse, an easily preventable compliance violation.
Use Cases for Application Logs
Application logs are instrumental in various real-world scenarios:
- Debugging an Unsuccessful API Request: Logs enable developers to track what went down on an unsuccessful request, from input through response, so it’s simpler to identify where things went wrong, whether on a microservice or an API off-site.
- Identifying Security Incidents: Authentication logs enable detection of abnormal login attempts, failed authentications, or suspicious patterns in advance, enabling security teams to respond before harm is caused.
- Tracking Performance Bottlenecks: When your app is slowing down, logs can point out slow database queries or latency spikes, enabling teams to identify exactly where performance is impaired.
- Ensuring Compliance and Auditing: Audit trails record who viewed what and when, something that’s essential for organizations required to comply with standards such as GDPR, HIPAA, or SOC 2.
- Proactive Incident Management: Logs can raise early warning signals, such as rising memory consumption or repeated small errors, allowing teams the opportunity to correct issues before they turn serious.
Read more about application performance monitoring.
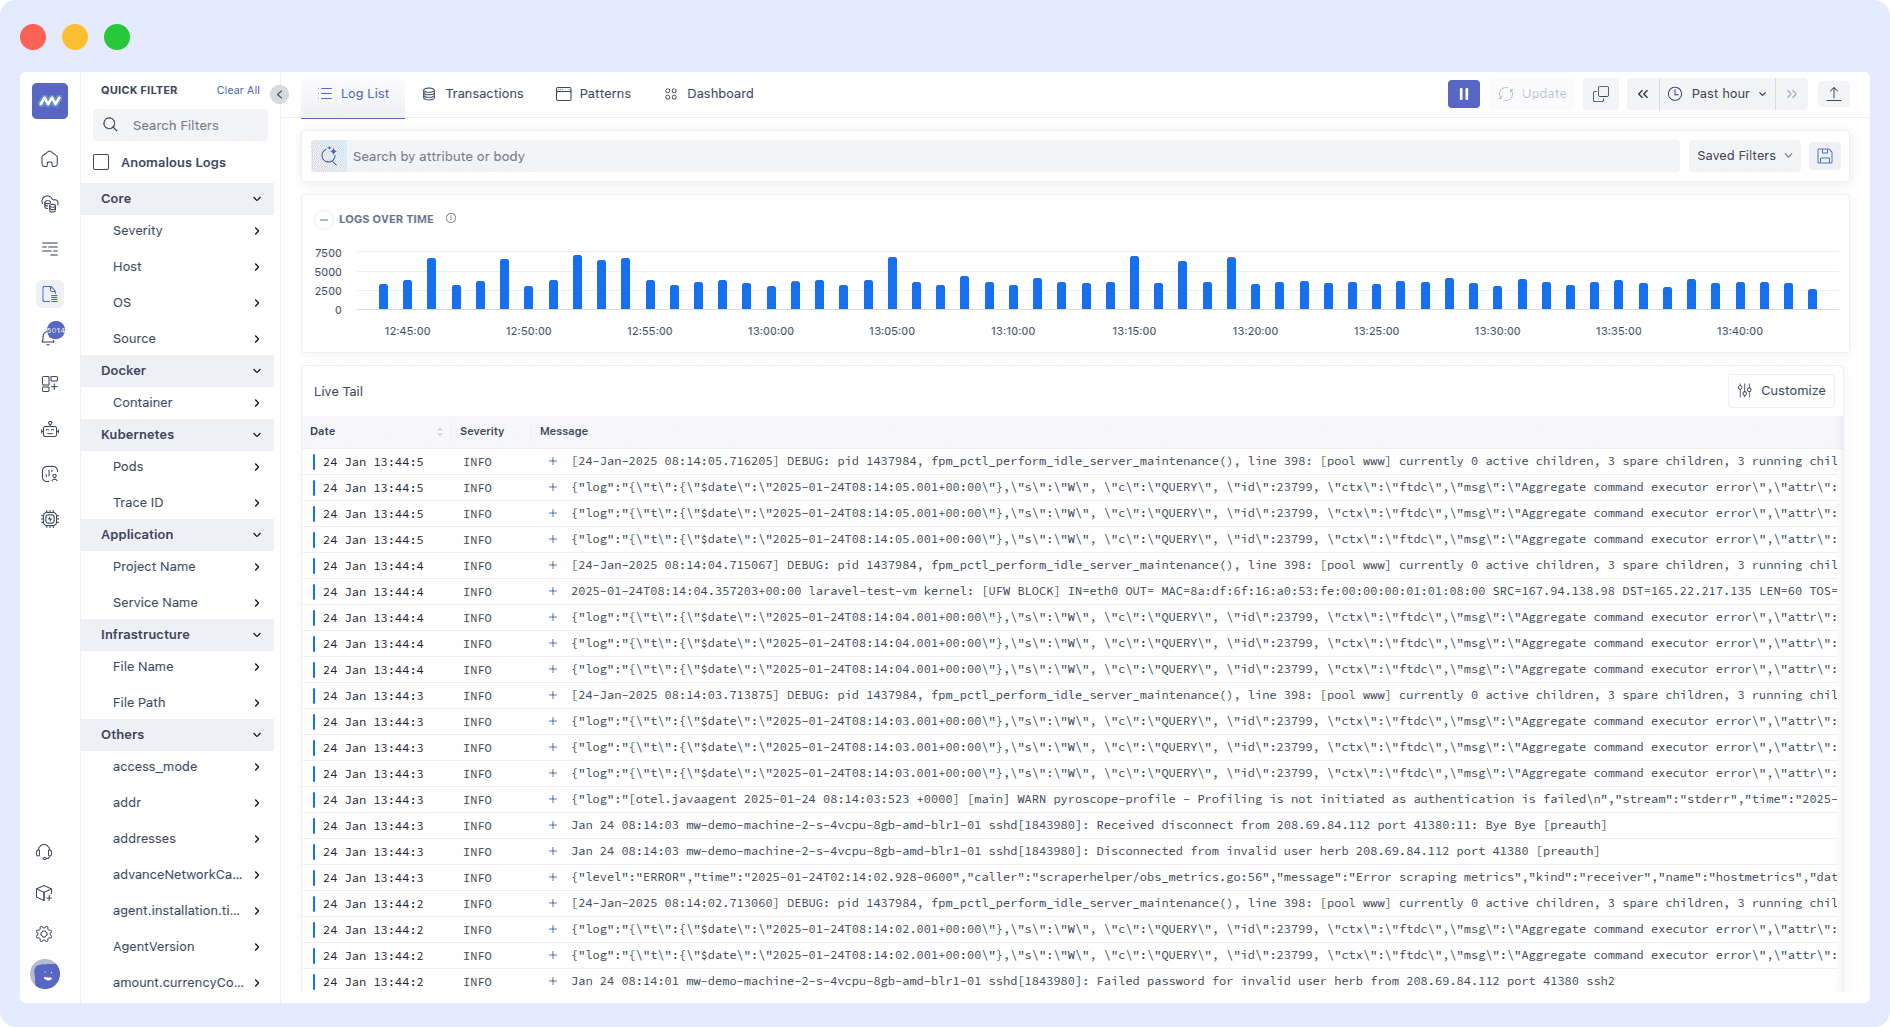
Monitoring Application Logs with Middleware
Middleware’s Application Logging Tool is a unified platform designed to streamline log management, monitoring, and analysis across modern, distributed tech environments. It offers real-time visibility into application, infrastructure, and cloud service logs; all within a centralized dashboard, facilitating prompt anomaly detection, troubleshooting, and resolution of issues before they impact users.
Key Features:
- Centralized Log Management: Aggregate logs from servers, containers, cloud services, and applications into a unified interface, eliminating data silos and simplifying access.
- Real-Time Monitoring and Visualization: Monitor incoming logs live with customizable dashboards and visualizations that highlight key metrics and trends.
- Advanced Search and Filtering: Utilize keyword, regex, and operator-based queries with autocomplete suggestions to quickly pinpoint relevant logs.
- AI-Powered Insights and Anomaly Detection: Use AI to automatically detect anomalies, outliers, and recurring log patterns, providing actionable recommendations and root cause analysis.
- Custom Alerts and Proactive Monitoring: Set up custom alerts and notifications based on specific log data or thresholds to ensure immediate flagging of critical issues.
- Historical Analysis and “Time Travel”: Review and analyze up to six months of historical log data to identify long-term trends and investigate past incidents.
- Log Correlation and Contextual Analysis: Correlate logs with metrics and traces to gain a holistic view of system and application health, accelerating troubleshooting.
Conclusion
Now that you have a solid understanding of application logging, it’s time to put these insights into action. Start by evaluating your current log management setup and identifying gaps in collection, structuring, and security. Implement best practices such as centralized logging, structured formats, and log level categorization to enhance efficiency.
Investing in the right tools and strategies will ensure that your applications remain reliable, secure, and optimized for long-term success. Whether you’re a DevOps engineer or an SRE, improving your logging approach will lead to better troubleshooting, stronger security, and smoother operations.
What are application logs?
Application logs record events and activities inside an app, helping to track errors, user actions, and system behavior.
Why are application logs important for developers?
Application logs help developers diagnose issues, monitor performance, and understand user interactions.
What are the main types of application logs?
Error logs, info logs, debug logs, and access logs.
What key information should be included in an application log entry?
Timestamp, log level, event description, and relevant context.
How do application logs help with debugging and performance optimization?
Application logs show the sequence of events leading to issues and highlight bottlenecks.
What tools are commonly used for managing and analyzing application logs?
Middleware, Datadog, Dynatrace, ELK Stack, Fluentd, and Grafana.


