Consider an e-commerce platform hosted on Microsoft Azure, preparing for a massive holiday sale. As customers flood in to grab their deals, the system must scale efficiently to handle the surge in traffic.
A single moment of downtime, however, can lead to substantial revenue loss and a severe dip in customer satisfaction. Managing such high-traffic events demands a sophisticated approach to scaling, resource allocation, and ensuring smooth dependencies across Microsoft Azure services. Without the right tools, even the most powerful cloud infrastructure can falter under pressure.
This article examines how Microsoft Azure’s built-in monitoring tools, coupled with Middleware’s observability platform, can provide proactive performance management, detect anomalies early, and significantly reduce downtime during peak traffic scenarios.
Diving into Azure monitoring
Azure Monitoring is a suite of integrated tools and services provided by Microsoft Azure to collect, analyze, and act on telemetry data from cloud resources and applications. Azure Monitor metrics play an important role in monitoring and analyzing resource performance and events. It enables IT teams and cloud administrators to gain deep insights into the performance, health, and usage of Azure resources.
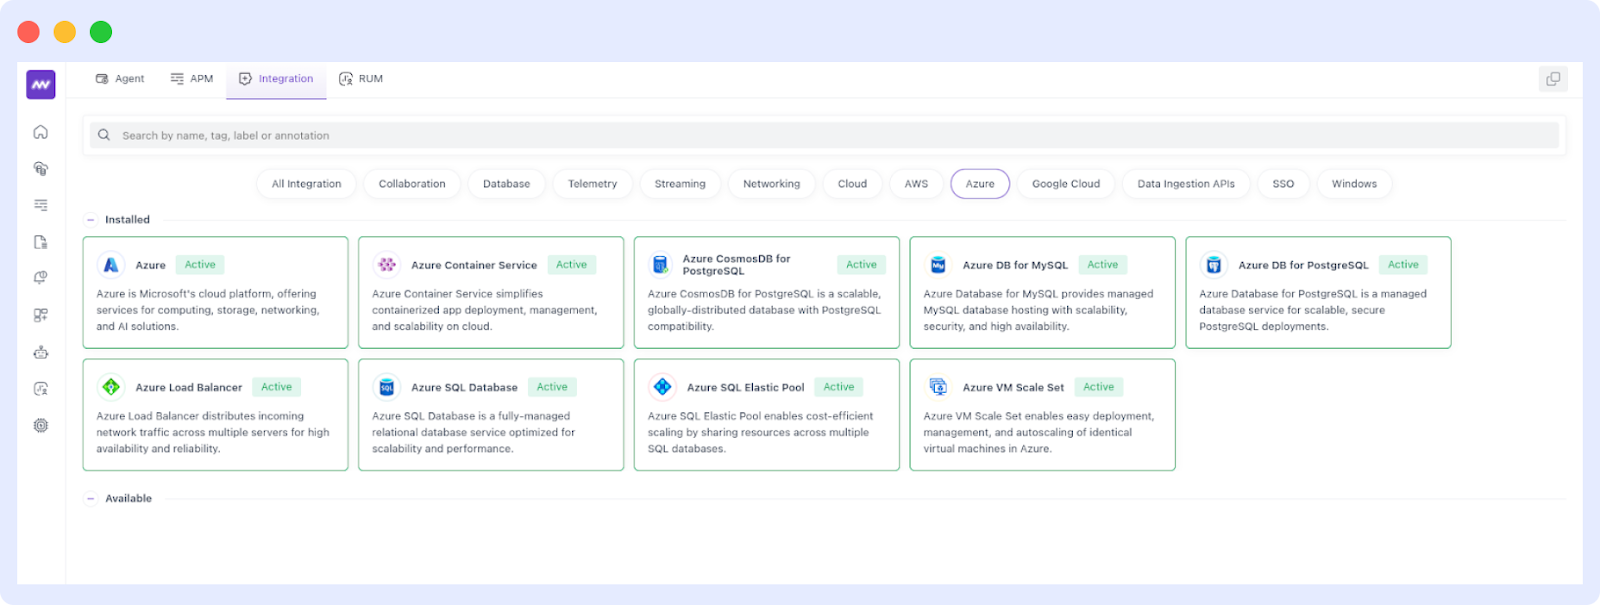
In technical terms, Azure Monitoring provides capabilities to:
- Collect telemetry data such as metrics, logs, and traces from resources like virtual machines (VMs), managed databases, and serverless functions.
- Track system performance and resource utilization (e.g., CPU, memory, disk I/O, network latency).
- Monitor application behavior to identify bottlenecks, slow response times, or dependency failures.
- Detect anomalies such as unexpected resource spikes, security threats, or policy violations.
- Trigger alerts for pre-configured thresholds and perform automated actions (e.g., scaling resources).
- Facilitate troubleshooting through root-cause analysis of performance and operational issues.
Why is Azure monitoring needed?
Azure Monitoring is necessary for maintaining the reliability, performance, and security of cloud environments. Key reasons include:
- Proactive issue detection: Early detection of performance degradation or operational issues to prevent downtime.
- Scalability management: Efficient resource scaling based on real-time metrics, avoiding over- or under-provisioning.
- Compliance and security: Identifying and mitigating policy violations or security threats to ensure regulatory adherence.
- Improved decision-making: Insights from telemetry data help teams optimize application design and infrastructure.
Without effective monitoring, systems risk unplanned outages, resource mismanagement, and operational inefficiencies, all of which can lead to degraded user experiences and increased costs.
Now that we understand the importance of Azure Monitoring, let’s explore the key tools it provides to collect, analyze, and act on telemetry data.
Microsoft Azure monitoring tools: From Metrics to Azure Monitor Logs, what’s inside
Azure offers a comprehensive suite of integrated monitoring tools to support efficient resource management, performance optimization, and troubleshooting across cloud environments. Below are the key tools within the Azure Monitoring ecosystem:
- Azure Monitor: The core service in Azure Monitoring, Azure Monitor collects and analyzes data from various Azure resources. It tracks system performance, usage patterns, and logs, providing a consolidated view of your entire Azure infrastructure. It includes features like alerting, metrics collection, and integrated dashboards to visualize the health of applications and resources.
- Application Insights: A tool within Azure Monitor specifically focused on application performance management (APM). Application Insights provides deep visibility into application behavior, tracking things like response times, error rates, and dependencies. It helps developers identify performance bottlenecks, detect failures, and improve the user experience by perfecting code and system design.
- Log Analytics: A powerful log query tool that helps users dig deeper into logs generated by their applications and resources. Log Analytics aggregates and indexes log data, allowing users to run complex queries to troubleshoot problems, analyze trends, and perform root cause analysis on system failures or performance issues.
Although Azure’s tools offer strong monitoring capabilities, complicated use cases and multi-cloud scenarios frequently call for additional help. This is where the monitoring experience is improved by Middleware.
How Middleware elevates Azure monitoring
Middleware is a comprehensive observability platform designed to enable organizations to have a holistic view of their technology stack. By creating diagnostic settings, enterprises can uplift the monitoring capabilities of Azure Monitor, gathering more detailed operational information about Azure resources.
Beyond traditional full-stack monitoring, Middleware provides deep insights into infrastructure, cloud services, and machine learning models. This ensures that enterprises can monitor, analyze, and optimize their systems across diverse environments and applications.
What makes Middleware unique?
Middleware stands out for its ability to:
- Comprehensive observability: Offers unified monitoring across infrastructure, cloud-native applications, and ML models, providing a single source of truth for system health.
- Easy multi-cloud integration: Bridges gaps in native tools by delivering granular insights and correlating data across multiple cloud environments.
- Proactive intelligence: Utilizes AI-driven analytics for anomaly detection, root-cause analysis, and predictive insights, enabling teams to address potential issues before they escalate.
- Customizable dashboards: Consolidates data from various sources into tailored, user-friendly interfaces, making complex telemetry data actionable.
- Machine learning model monitoring: Tracks performance, accuracy, and operational metrics for deployed ML models, ensuring they perform optimally in production.
Building on Middleware’s fundamental advantages, let’s examine how its products work with Azure to deliver a strong and smooth observability solution.
See how Middleware is Drawing Customers Away from Datadog & New Relic!
Middleware’s offerings with Azure
Middleware adds to Azure’s native monitoring capabilities by integrating easily and providing advanced features to improve observability and performance management. Key offerings include:
- Infrastructure and cloud observability: Middleware monitors Azure infrastructure (e.g., virtual machines, networks, managed databases) alongside other cloud resources. It unifies this data to simplify performance tracking and dependency management.
- Machine learning modelmMonitoring: Middleware offers observability tools specifically designed for ML models deployed on Azure. It tracks metrics like accuracy, latency, and resource usage, ensuring that models meet performance expectations and avoid drift.
- Proactive alerting and insights: Middleware’s AI-driven alerting system detects anomalies and predicts resource bottlenecks using real-time data from Azure Monitor and other sources, ensuring timely resolutions.
- Cross-platform visibility: Middleware bridges Azure with other cloud platforms, enabling teams to monitor multi-cloud environments without complexities. This integration provides a unified view of logs, metrics, and traces across all services.
- Custom dashboards for Azure resources: Middleware’s customizable dashboards integrate telemetry data from Azure Monitor, Application Insights, and Log Analytics into a single interface, offering an intuitive way to manage complex systems.
By integrating with Azure’s monitoring ecosystem and using collected data, Middleware provides a vigorous observability platform that spans infrastructure, applications, and machine learning models, enabling teams to optimize resources, improve reliability, and drive innovation.
Middleware tackles some of the most important monitoring issues in Azure systems, including scaling, resource optimization, and troubleshooting, by utilizing its special services.
Addressing monitoring challenges in Azure with Middleware
Dynamic scaling and resource optimization
High-traffic scenarios, such as holiday sales, present significant challenges in ensuring dynamic scaling and optimal resource utilization. Microsoft Azure Monitor collects and analyzes monitoring data to track resource usage across services, enabling systems to scale in real time based on load.
However, Middleware enhances this capability by analyzing usage patterns, providing proactive scaling recommendations, and automatically adjusting resource allocations to meet demand effectively.
Middleware ensures optimal resource allocation across a wide range of Azure resources, including:
- Compute resources: Azure VMs and container instances.
- Storage systems: Blob storage and managed disks.
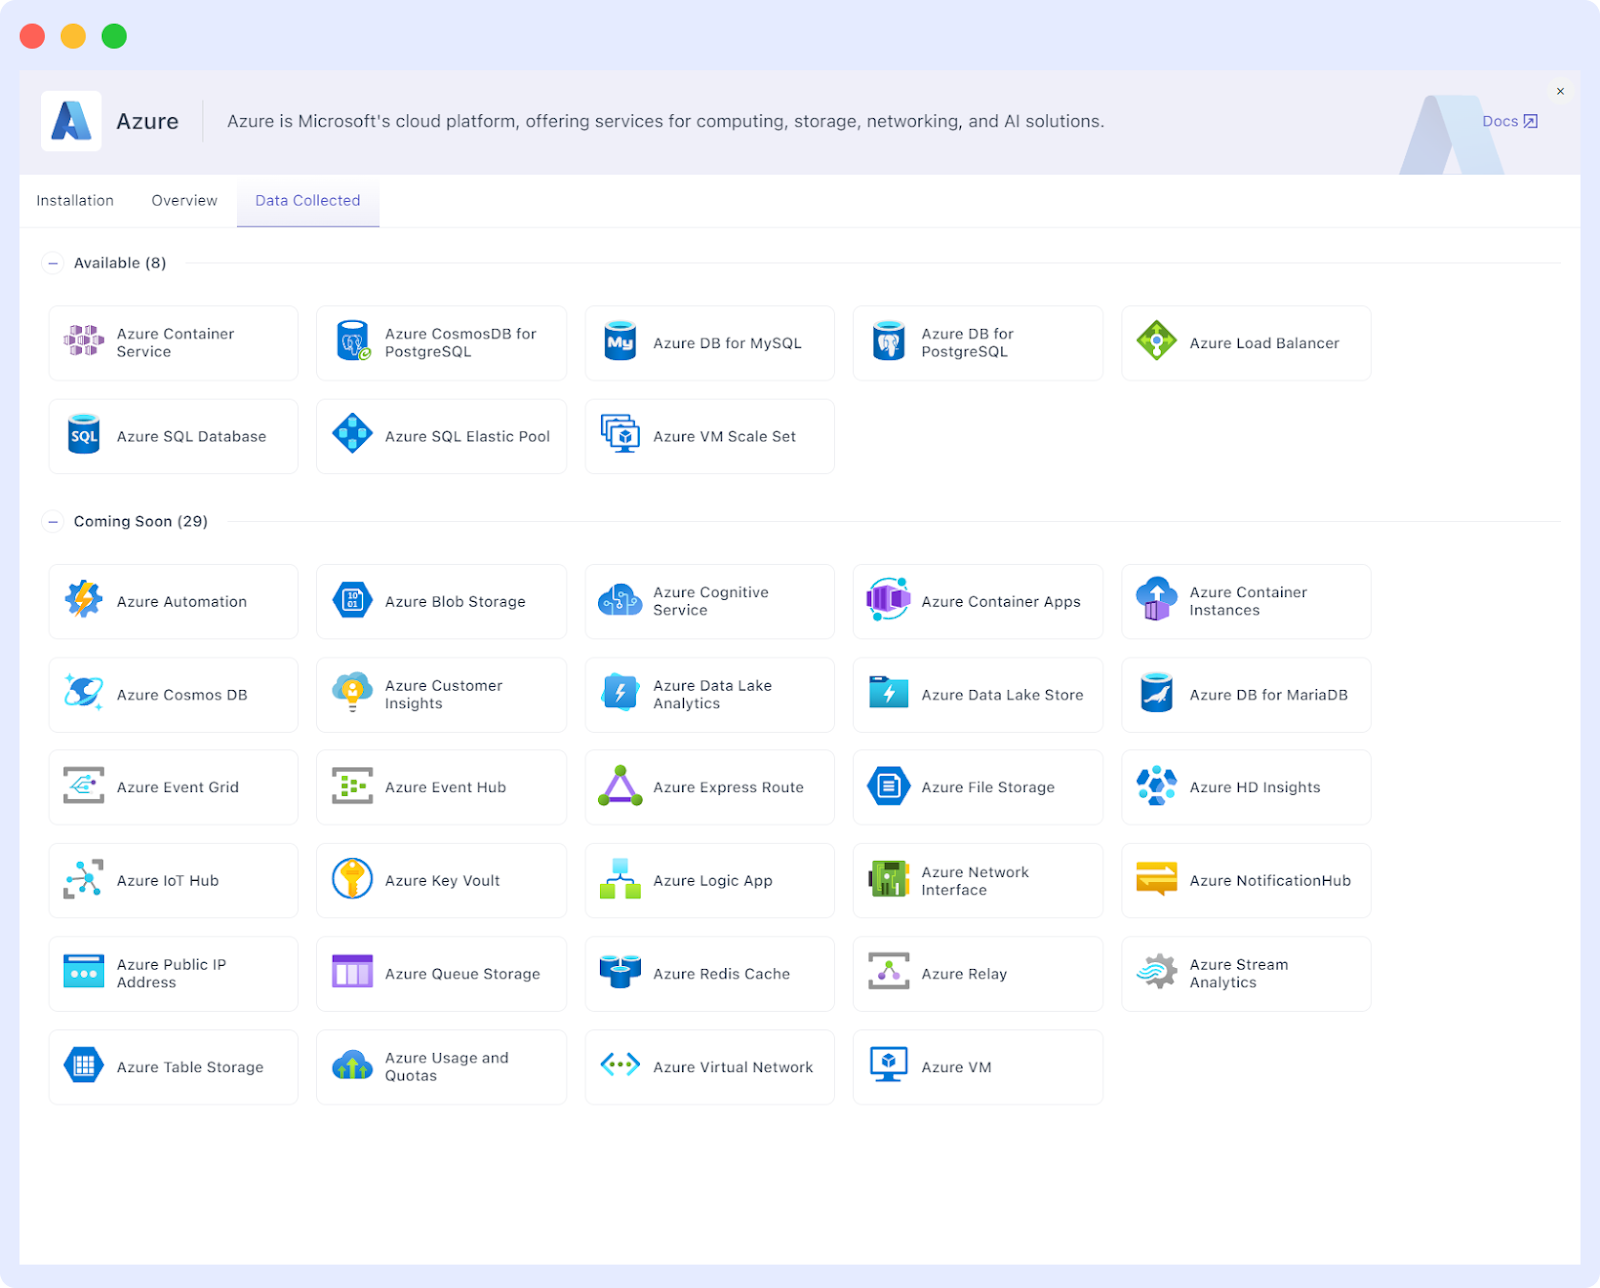
- Managed Databases: Azure SQL Server, Elastic Pools, CosmosDB, and more.
Through Middleware’s Azure Integration, teams can:
- Easily scale resources such as Azure VMs, SQL Databases, and Load Balancers during traffic spikes or high system demand.
- Monitor and adjust scaling for Azure Managed Databases, ensuring consistent performance even under increased workloads.
Real-world example:
During a flash sale, Middleware’s observability platform analyzes real-time metrics from Azure Monitor and adjusts scaling settings for critical resources such as SQL Server and Elastic Pools.
This ensures consistent query performance and resource availability without requiring manual intervention. By aligning database performance with application demand, Middleware minimizes the risk of over- or under-provisioning, ensuring optimal system reliability and user experience.
While dynamic scaling ensures efficient resource use during peak demand, Middleware also simplifies the management of Azure’s inherently complex architectures, making it easier to oversee dependencies and interactions.
Simpler management for Azure’s complex architectures
The complexity of Microsoft Azure’s environment, spanning VMs, Kubernetes (AKS), microservices, and serverless functions, presents significant challenges in monitoring the entire Azure environment. Dependencies between services can be intricate and hard to trace.
Middleware helps simplify this by providing cross-service visibility, enabling teams to monitor interactions and interdependencies across multiple Azure services. This makes it easier to manage complex, multi-layered architectures and identify performance bottlenecks more quickly.
Detecting issues early with Middleware’s advanced alerts
Microsoft Azure Monitor’s alerting features provide real-time notifications based on predefined thresholds for any Azure service. However, with Middleware integrated into your monitoring ecosystem, you get a more nuanced approach.
Middleware’s platform uses advanced analytics to detect performance anomalies or patterns indicative of underlying issues before they impact users. This proactive alerting system can help mitigate downtime, reduce troubleshooting time, and improve overall system reliability.
Real-world use cases: Middleware and Azure monitoring
Proactive alerts and scaling
Azure Monitor offers real-time alerts and metrics to keep track of system health. Middleware, however, takes it a step further with predictive analytics and anomaly detection.
By utilizing historical data and machine learning models, Middleware can anticipate traffic spikes or resource bottlenecks and trigger auto-scaling adjustments automatically. This ensures that resources are scaled before issues arise, minimizing manual intervention and avoiding performance degradation.
Post-incident analysis
After an incident occurs, the integration between Middleware and Azure Log Analytics provides a vigorous framework for post-mortem analysis. Middleware’s customizable dashboards allow you to track key performance indicators (KPIs) and trace service dependencies, providing a clear picture of what happened.
This level of insight is invaluable for identifying root causes, refining the system’s architecture, and improving response strategies for future events.
Unified insights across Azure and beyond with Middleware
Middleware’s observability platform unifies data from various Microsoft Azure services, such as AKS, serverless functions, virtual machines (VMs), and Azure Managed Databases, into a single interface. This unified view is necessary in complex environments where issues often span multiple services and resources.
By correlating logs, metrics, and traces across these components, teams gain the holistic insight needed to identify and resolve issues that might otherwise go unnoticed.
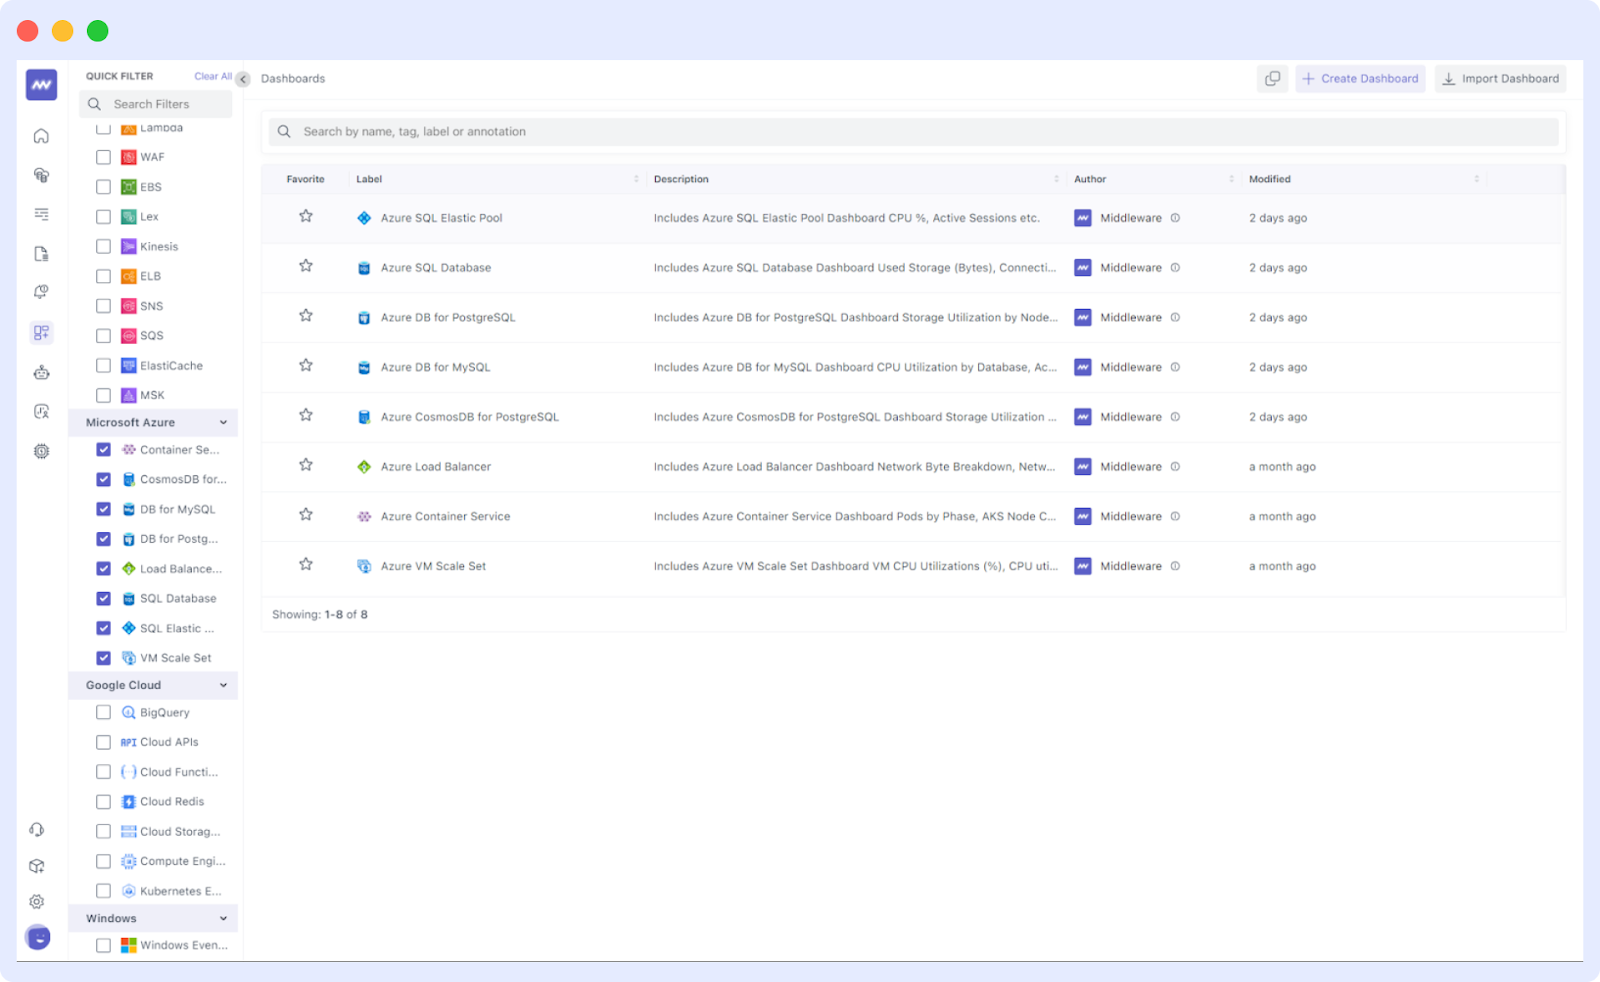
Middleware also enables teams to monitor the health and performance of Azure Managed Databases such as CosmosDB, PostgreSQL, MySQL, SQL Server, and Elastic Pools, providing visibility into critical metrics like:
- Query performance
- Resource utilization
- Connection health
- Latency trends
With Middleware dashboards, teams achieve a unified view of both the application and data layers, easing the management of service dependencies and improving operational efficiency.
In addition to providing unified insights across Azure services, Middleware excels in supporting managed databases by delivering deep performance analytics and operational control.
Middleware’s support for Azure managed databases
Microsoft Azure provides a suite of managed database services, including CosmosDB, PostgreSQL, MySQL, SQL Server, and SQL Elastic Pool, designed to handle diverse workloads with high availability and scalability. While Azure’s native tools offer foundational monitoring, Middleware extends these capabilities by delivering deep insights into database performance, enabling teams to optimize their database usage effectively.
With Middleware’s Azure integration, teams can:
- Track critical database metrics such as query performance, resource utilization, connection health, and latency trends.
- Set custom alerts for threshold breaches, enabling proactive issue detection and response.
- Visualize database performance alongside other Azure resources, providing a unified view of system health and easing the management of service dependencies.
Real-world use case:
Middleware’s dashboards allow teams to:
- Monitor query latency trends for PostgreSQL and quickly identify slow queries.
- Review scaling patterns for CosmosDB collections during traffic spikes, ensuring optimal performance.
- Optimize database performance by correlating metrics with application behavior.
By integrating with Middleware, teams gain better observability and operational control over Azure Managed Databases, ensuring reliability and efficiency for their critical data systems.
While performance and resource optimization are critical, maintaining security and compliance in cloud environments is equally important. Middleware extends Azure’s capabilities to address these concerns.
Boosting Azure security and compliance through Middleware
Advanced security monitoring
Middleware strengthens Azure Sentinel’s capabilities by offering real-time security insights. By monitoring cloud-native applications, Middleware flags potential vulnerabilities, unusual access patterns, and unauthorized attempts to access sensitive data. This added layer of visibility helps teams quickly respond to security threats, preventing data breaches or downtime caused by security incidents.
Regulatory compliance
Azure’s monitoring tools track user activities and data flows, supporting compliance with regulations such as GDPR and HIPAA. Middleware extends these capabilities by providing deep visibility into how sensitive data is handled across your cloud resources. This level of granularity is necessary for organizations that need to maintain a clear record of data interactions and ensure compliance with industry standards.
Middleware’s enhancements to Azure’s native tools not only address common challenges but also set this pairing apart from traditional monitoring solutions.
Why Azure monitoring paired with Middleware outperforms traditional tools
Key differences
Traditional monitoring is often reactive and focused on alerting after an issue occurs based on predefined thresholds. It may not provide the full picture of what’s happening across the environment. In contrast, Azure Monitoring combines monitoring and observability, providing a more proactive approach to system health by leveraging metrics, logs, and traces. Middleware adds even more depth to this by offering custom analytics, advanced visualizations, and cross-service insights that help anticipate problems before they disrupt services.
Why Middleware is necessary
Middleware is necessary because it improves Azure’s native monitoring tools by providing a deeper, more comprehensive view of application performance, service dependencies, and user experience. Unlike traditional monitoring tools, which focus primarily on alerting, Middleware’s observability platform enables you to analyze data in real time and track complex patterns across cloud-native services.
Addressing customer challenges: “Azure Monitoring – A Mess”
Azure Monitoring – A mess ?
byu/The-Bluedot inAZURE
In a recent Reddit post, a user shared frustrations regarding the complexity and usability issues surrounding Azure’s monitoring ecosystem. The post highlighted several challenges faced by Microsoft Azure users, including:
- Fragmentation of tools: Azure’s monitoring tools, such as Azure Monitor, Log Analytics, and Application Insights, often feel disjointed, requiring users to jump between them for a complete view of their system health.
- Complex configuration: The setup process for Azure’s monitoring tools is seen as intricate and time-consuming, leading to potential configuration errors or missed performance metrics.
- Limited insights: Despite collecting large volumes of telemetry data, the native tools sometimes fail to provide actionable insights or help teams pinpoint the root causes of issues quickly.
Middleware directly addresses these challenges by offering a unified view of Azure’s tools and providing deeper, actionable insights, helping teams more effectively manage system performance and troubleshoot issues.
After discussing the reasons why Middleware is revolutionary for Azure monitoring, let’s examine how you may use Middleware to improve your Azure setup.
Implementing Middleware with Azure monitoring
Core components of integration
Middleware doubles down on Azure’s native monitoring tools, Azure Monitor, Application Insights, etc, by providing deeper analytics, custom dashboards, and improved visibility. This integration ensures more effective monitoring and faster issue resolution.
- Azure monitor: Middleware magnifies Azure Monitor’s basic metrics and alerts with advanced analytics and predictive insights, helping identify potential issues before they affect performance.
- Application insights: Middleware integrates with Application Insights to provide detailed visibility into application performance and dependencies, improving issue detection and resolution.
- Custom dashboards: Middleware allows you to create tailored dashboards that bring together data from multiple Azure tools, providing a comprehensive view of system health and performance.
With this improved observability, you’re equipped to monitor and optimize your cloud environment. Let’s now walk through the steps to integrate Middleware with Azure and explore what it has to offer.
Steps for integration
Integrating Middleware with Azure’s monitoring tools improves your system’s observability, helping you manage performance, resource allocation, and scaling efficiently. Here’s a short guide to getting started:
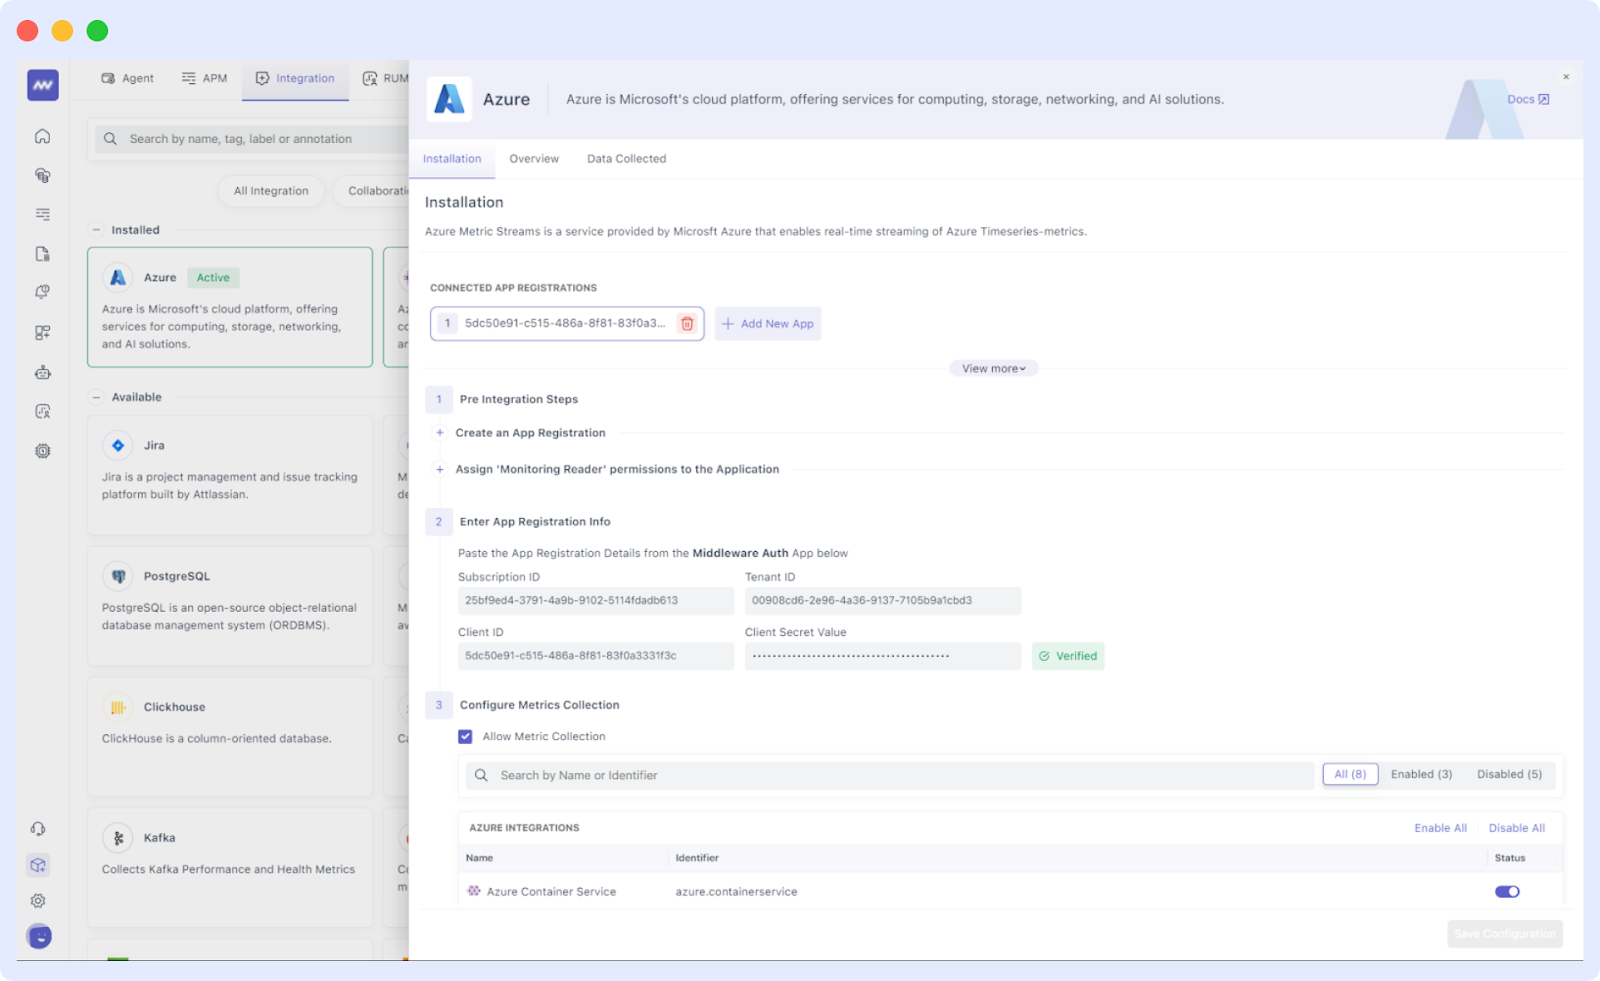
- Connect Middleware to Azure services: Begin by connecting Middleware to Microsoft Azure resources such as Azure Monitor, Application Insights, and Log Analytics. This is done by creating an Azure App Registration in the Microsoft Azure portal and using the provided App Registration details to link Middleware with your Azure environment.
- Create custom dashboards: Once connected, use Middleware’s dashboard features to create visualizations for real-time metrics and logs pulled from Azure. Custom dashboards allow you to track performance metrics across services (e.g., VMs, AKS, and databases), providing an overview of system health.
- Set up alerts & auto-scaling: Configure automated alerts based on key performance indicators (KPIs) such as CPU usage, memory, or transaction speeds. By integrating Middleware alerts with Azure’s auto-scaling features, you ensure that your infrastructure adapts dynamically during high-traffic events.
- Implementing Middleware’s analytics: Middleware’s advanced analytics offer deeper insights into application performance and resource utilization. Use these analytics to optimize your system design, improve resource allocation, and troubleshoot issues before they impact users.
For more detailed integration instructions, refer to the official Middleware Azure Integration documentation.
Best practices for monitoring Azure systems with Middleware
Centralized monitoring with Middleware dashboards
Using Middleware’s unified dashboards to centralize the monitoring of all Microsoft Azure resources. This provides a comprehensive view of system health, enabling teams to identify trends, anomalies, and potential issues before they impact performance.
Real-time alerts for proactive issue resolution
Configure automated alerts using both Azure Monitor and Middleware’s platform. By integrating auto-scaling triggers with performance thresholds based on critical metrics, teams can resolve issues faster and maintain optimal resource allocation, preventing performance degradation during peak times.
Root cause analysis using Middleware’s analytics
Middleware’s deep analytics platform helps teams quickly identify bottlenecks, service dependencies, and other performance issues. This accelerates root cause analysis and reduces resolution times, ensuring faster recovery and improved system reliability.
Custom metrics tailored to enterprise objectives
Use Middleware to define and monitor custom metrics aligning with your enterprise goals, whether improving transaction speeds, user experience, or service uptime. This enables more targeted monitoring, helping teams proactively detect issues that could impact key enterprise outcomes.
Continuous optimization with Middleware’s performance reports
Using insights from Middleware’s performance reports for ongoing optimization. These reports help ensure that your application, infrastructure, and resource utilization remain efficient and responsive to evolving traffic demands, allowing for continuous improvement in both performance and scalability.
Common pitfalls and how Middleware helps
Data overload
Excessive alerts and raw data can overwhelm teams, leading to alert fatigue. Middleware’s smart alerting and data aggregation features help avoid this by filtering out unnecessary information, ensuring that teams receive only actionable insights when they are most needed.
Poorly defined metrics
Middleware helps create meaningful, enterprise-focused metrics that prioritize application performance and user experience over technical details. This makes the data being tracked more relevant, ensuring teams focus on what truly matters for enterprise outcomes.
Lack of integration across tools
Middleware bridges gaps by integrating effortlessly with Microsoft Azure’s native monitoring tools and third-party applications, providing a unified observability experience. This integration simplifies troubleshooting, smoothes system management, and improves visibility across the entire stack.
Lack of contextualized insights
Middleware adds context to the data by linking system metrics, such as CPU usage or memory consumption, to real-world application performance and user impact. This enables teams to better understand the consequences of metrics, offering a clearer picture of what’s happening and why it matters. Real-time visualizations also make it easier to grasp the situation at a glance.
Slow incident response times
With Middleware’s real-time monitoring and automated alerts, teams can detect issues as they occur and take immediate action. Middleware can automatically trigger responses to incidents, helping teams resolve problems faster. Its integration with incident management tools also improves collaboration and speeds up overall response times.
Difficulty in scaling monitoring
As your system grows, scaling your monitoring infrastructure can become a challenge. Middleware simplifies this by supporting multi-region and multi-cloud environments.
Whether you’re managing resources across different Microsoft Azure regions or a combination of clouds, Middleware ensures that all systems are visible and easy to manage, no matter how complex the infrastructure becomes.
Looking ahead: The future of scalable, resilient Azure environment
Integrating Azure’s monitoring capabilities with Middleware’s observability platform is key to staying ahead of potential issues, enabling faster resolution and boosting system reliability. By leveraging the strengths of both, teams can effectively manage high-traffic events and ensure a smooth user experience, even during peak demand.
As cloud technologies continue to advance, AI-driven analytics, predictive monitoring, and intelligent automation are set to transform how we approach performance management. These innovations will allow teams to not only anticipate issues before they occur but also continuously fine-tune and optimize system performance, ensuring a more resilient and efficient infrastructure for the future.
What is Azure Monitoring used for?
Azure Monitoring is designed to provide end-to-end observability for applications and infrastructure hosted on Azure. It collects and analyzes telemetry data such as metrics, logs, and traces to help identify performance bottlenecks, monitor resource utilization, and ensure system reliability. It also facilitates real-time alerts and post-incident analysis for continuous improvement.
What is the difference between Azure Monitor and Log Analytics?
Azure Monitor is a comprehensive monitoring platform that aggregates telemetry data across Azure resources, providing a unified view of system performance. Log Analytics, a component of Azure Monitor, specializes in querying and analyzing log data stored in the Azure Monitor Logs store. While Azure Monitor provides high-level insights and alerts, Log Analytics enables deep, customized log-based investigations for troubleshooting and diagnostics.
What is the name of the Azure Monitoring service?
The name of Azure’s core monitoring service is Azure Monitor, which integrates tools like Application Insights, Log Analytics, and Network Watcher to deliver a full-stack monitoring and observability solution.
Is Azure Monitor IaaS or PaaS?
Azure Monitor is a Platform as a Service (PaaS) offering that provides monitoring and observability capabilities for both Infrastructure as a Service (IaaS) and PaaS resources. It enables comprehensive telemetry collection, analysis, and alerting for applications and infrastructure hosted on Azure.
How secure is Middleware’s access to my Azure resources?
Middleware uses Azure’s App Registration and the least privileged access model to ensure secure integration with your resources. By requiring only the ‘Monitoring Reader’ role, Middleware ensures that access is read-only, minimizing any security risks while allowing the necessary visibility to monitor and analyze your Azure environment. This approach complies with Azure’s best practices for securing third-party integrations, ensuring that your data and resources remain protected.
