You’ve built a web application managed on a MySQL database. That’s awesome, but as your application begins to scale and user traffic surges, you start encountering performance hiccups that degrade performance.
Queries start to linger longer than expected, and database connections become strained at the most inopportune moments. That’s when you realize the need to have a MySQL Performance monitoring tool in your stack.
So, you make a move to identify what’s wrong with your database but lack the understanding of what to check for and how.
In this article, we explain the nitty-gritty of MySQL performance monitoring and highlight top monitoring tools for the job.
What is MySQL?
MySQL is an open-source relational database management system (RDBMS) that allows users to store, manage, and retrieve data. It provides a platform for creating databases, defining tables, querying data, and performing various database operations using SQL commands.
MySQL is known for its speed, ease of use, and flexibility, which makes it a popular choice for a wide range of applications, from small websites to large enterprises. MySQL stores data in tables consisting of rows and columns—each row representing a record and each column representing a field.
Why is monitoring MySQL’s performance important?
Despite MySQL’s capacity to process petabytes of data here are some reasons why you should monitor its performance.
- Monitoring MySQL performance helps you identify potential bottlenecks that may impact the overall performance of the database.
- By monitoring query execution times and identifying slow-performing queries, you can optimize these baselines to improve performance.
- When you monitor MySQL performance, you’ll gain insights into how your database is handling increasing loads, which helps you plan for future scalability.
- You will understand how resources are being utilized within the database server, and know how to fine-tune your database configurations.
- When you monitor MySQL throughput against Service Level Agreements (SLAs), you can ensure that the database meets performance expectations and service requirements for end-users and applications.
Key MySQL database performance metrics
Monitoring MySQL databases is as vital as monitoring the right metrics. Below are key MySQL performance metrics to keep a tab on:
1. Throughput
Throughput measures the rate at which MySQL processes and completes transactions or queries. It is measured in transactions per second (TPS) or queries per second (QPS). These units indicate the amount of work the database can handle in a given amount of time.
Throughput can be measured for various types of database transactions—reads, writes, updates, and deletes. Monitoring throughput provides valuable insights into the database’s capacity to handle workloads.
You can also track peak throughput levels during high load periods, as well as decrement times. This helps you in capacity planning and ensures that the database can handle spikes in workload without performance degradation.
For instance, if throughput decreases significantly while the workload remains constant, it could indicate issues such as inefficient query execution, hardware limitations, or configuration errors.
Understanding throughput patterns guides decisions regarding resource allocation—e.g., scaling up hardware resources (CPU, memory, storage) or optimizing database settings and configurations.
2. Latency
Latency measures the time it takes for a request to be processed by the MySQL database. There are “Read Latency” and “Write Latency.” Read latency is the time taken to retrieve data from the database, and write latency is the time taken to store new data or update existing data in the database.
Latency is measured in milliseconds (ms) or microseconds (µs). Lower latency values indicate faster query processing and better system responsiveness. High latency however indicates inefficient query execution.
While monitoring MySQL latency, also look out for the following:
- Client Latency: Time taken for the client to send a request to the server.
- Server Processing Latency: Time taken for the server to process the request and retrieve the data.
- Network Latency: Time taken for data to travel between the client and the server.
Monitoring latency metrics helps you identify slow-performing queries, inefficient indexes, or resource bottlenecks that contribute to high query response times.
Get proven, developer-tested strategies for reducing latency, read our Latency Reduction Guide for practical tips you can implement right away.
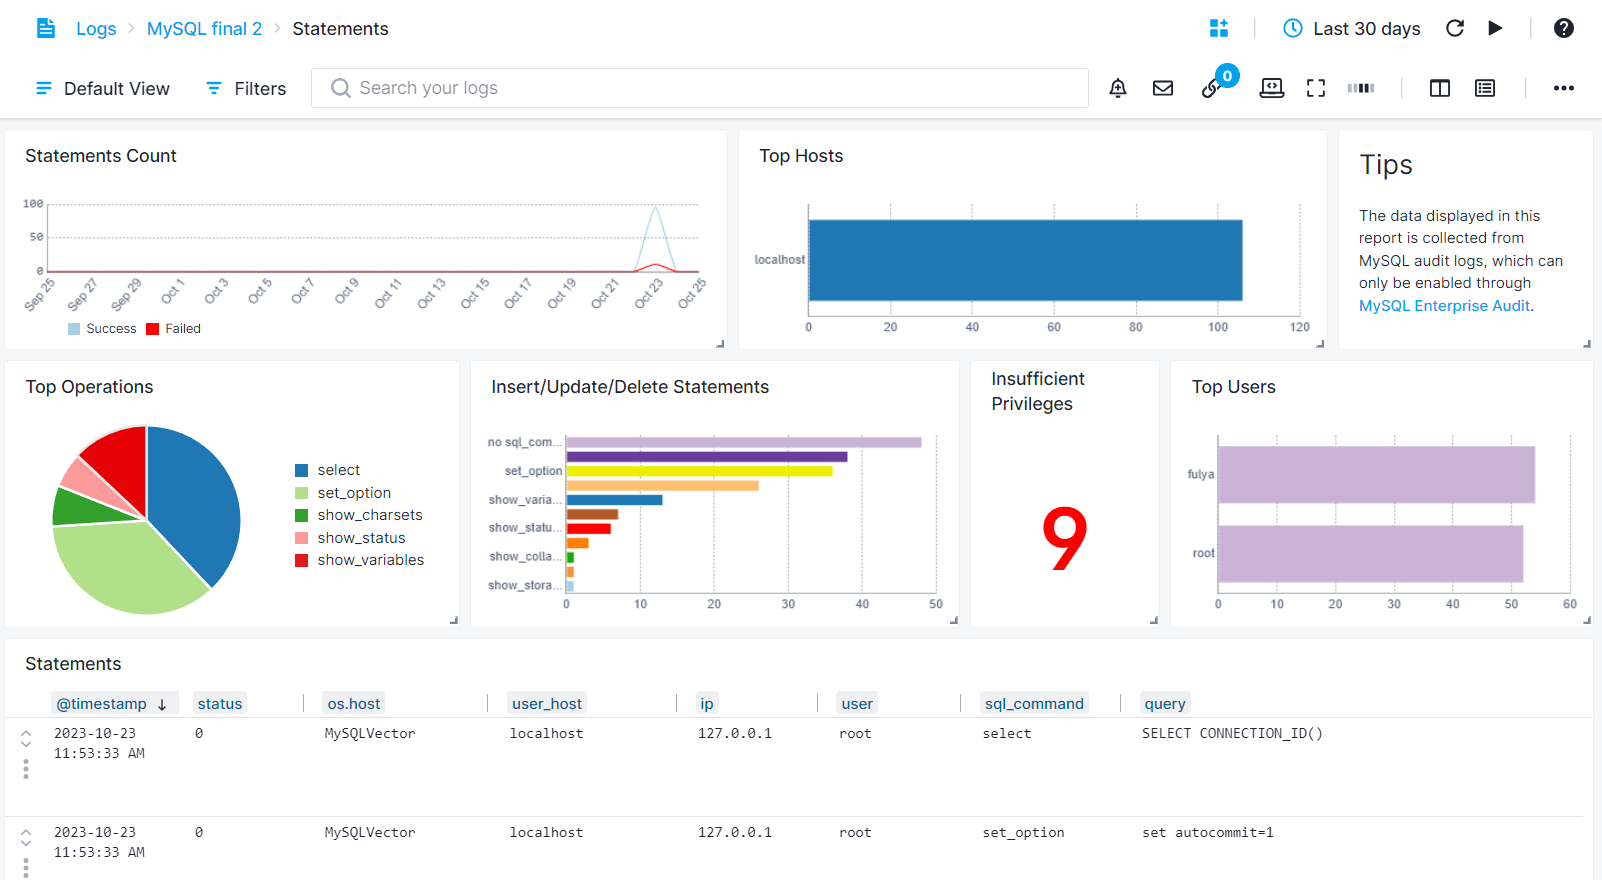
3. SQL Operations
Tracking SQL operations such as INSERT, UPDATE, DELETE, and SELECT provides insights into the workload patterns on the MySQL database.
The functions of the SQL Operations include the following:
- INSERT: Adds new records to a table
- SELECT: Retrieves data from one or more tables
- UPDATE: Modifies existing records in a table
- DELETE: Removes records from a table
Monitoring the frequency of each SQL operation type helps you understand the distribution of query patterns. Sudden spikes or deviations in SQL operation counts may indicate potential security threats or performance issues that require immediate attention and investigation.
You can also track the operations within transactions to gain insights into transactional behavior, such as commit rates, rollback frequencies, and overall transaction performance. It also helps you assess the balance of read and write operations, identify inefficient queries, frequent table scans, or high locking contention.
With these insights, you can optimize resource utilization, such as CPU, memory, and disk I/O, based on the types and frequencies of the operations; and as well predict future capacity requirements.
4. Buffer
MySQL buffers store various types of data to reduce the need for disk reads and writes. Monitoring buffer-related metrics like buffer pool hit ratio and buffer pool size helps you optimize memory usage and improve query performance.
The following are some buffer-related metrics to monitor within the MySQL database:
- InnoDB Buffer Pool: Stores data and index pages for frequently accessed tables in the InnoDB storage engine.
- Key Buffer: Caches index blocks for MyISAM tables to speed up index lookups.
- Query Cache: Stores result sets of previously executed queries for quick retrieval.
- Buffer Hit Ratio: The ratio of data retrieved from buffers compared to data read from disk. A high buffer-hit ratio indicates efficient buffer usage and reduced disk I/O.
- Buffer Size: The total memory allocated to each buffer type can be configured based on your workload requirements.
Monitoring buffer sizes and hit ratios allows for effective memory management, as efficient use of buffers reduces the reliance on disk storage, thereby minimizing latency.
In addition, analyzing buffer metrics helps you identify “hot spots” within the database where data access is frequent but not efficiently cached, enabling you to take corrective actions.
5. Total Schemas
A schema in MySQL represents a namespace that contains database objects. It is a logical container for database objects such as tables, views, stored procedures, and functions.
Each schema can be associated with a specific user or application to segregate and organize database elements. Also, each schema may have distinct permission settings that control access rights for users or applications to the objects within that schema.
Monitoring the total number of schemas in a MySQL database is crucial for managing database complexity, and supporting data organization. It helps in tracking database growth and ensuring proper schema management practices.
Understanding the number of schemas also helps in implementing granular security controls and access permissions at the schema level, ensuring data confidentiality and integrity.
6. Total Tables
In MySQL, a table is a collection of data organized into rows and columns. Tables store data in a structured format and are fundamental components of the database schema. Each table represents a distinct entity or type of data within the database.
MySQL supports different table types, such as InnoDB, MyISAM, and others, each offering specific features related to data integrity, storage, and indexing. Tables may have one or more indexes defined to optimize data retrieval and query performance.
Monitoring the total number of tables also involves tracking index usage and efficiency. It provides insights into database size and structure and helps in performance optimization, resource management, and database maintenance.
You need to monitor changes in table count to facilitate database maintenance tasks, such as backup and restore procedures, schema modifications, and performance tuning efforts. It helps you with scaling decisions, and infrastructure upgrades as the database expands over time.
7. Total Indexes
Indexes in MySQL are data structures that enhance the speed of data retrieval operations by providing quick access to rows in a table based on specific column values. Indexes improve query performance by reducing the number of rows that need to be scanned.
MySQL supports various types of indexes, including primary keys, unique indexes, and composite indexes. Each type serves a specific purpose in optimizing data access. Indexes enforce uniqueness constraints and facilitate efficient data retrieval without the need for full table scans.
Monitoring the total number of indexes and their usage helps you optimize query execution, and ensure data integrity. Monitoring total index metrics involves analyzing index fragmentation, considering index size, and evaluating the overall impact of indexes on database performance.
It helps you identify redundant or unused indexes, optimize index structures, and ensure efficient database maintenance practices.
Top 8 MySQL monitoring tools in 2024
The following are the top MySQL monitoring tools to consider for your MySQL deployments:
Middleware
Middleware is a full-stack cloud observability platform with intuitive dashboards that give insights into application performance. It seamlessly integrates with various applications and databases, including MySQL.
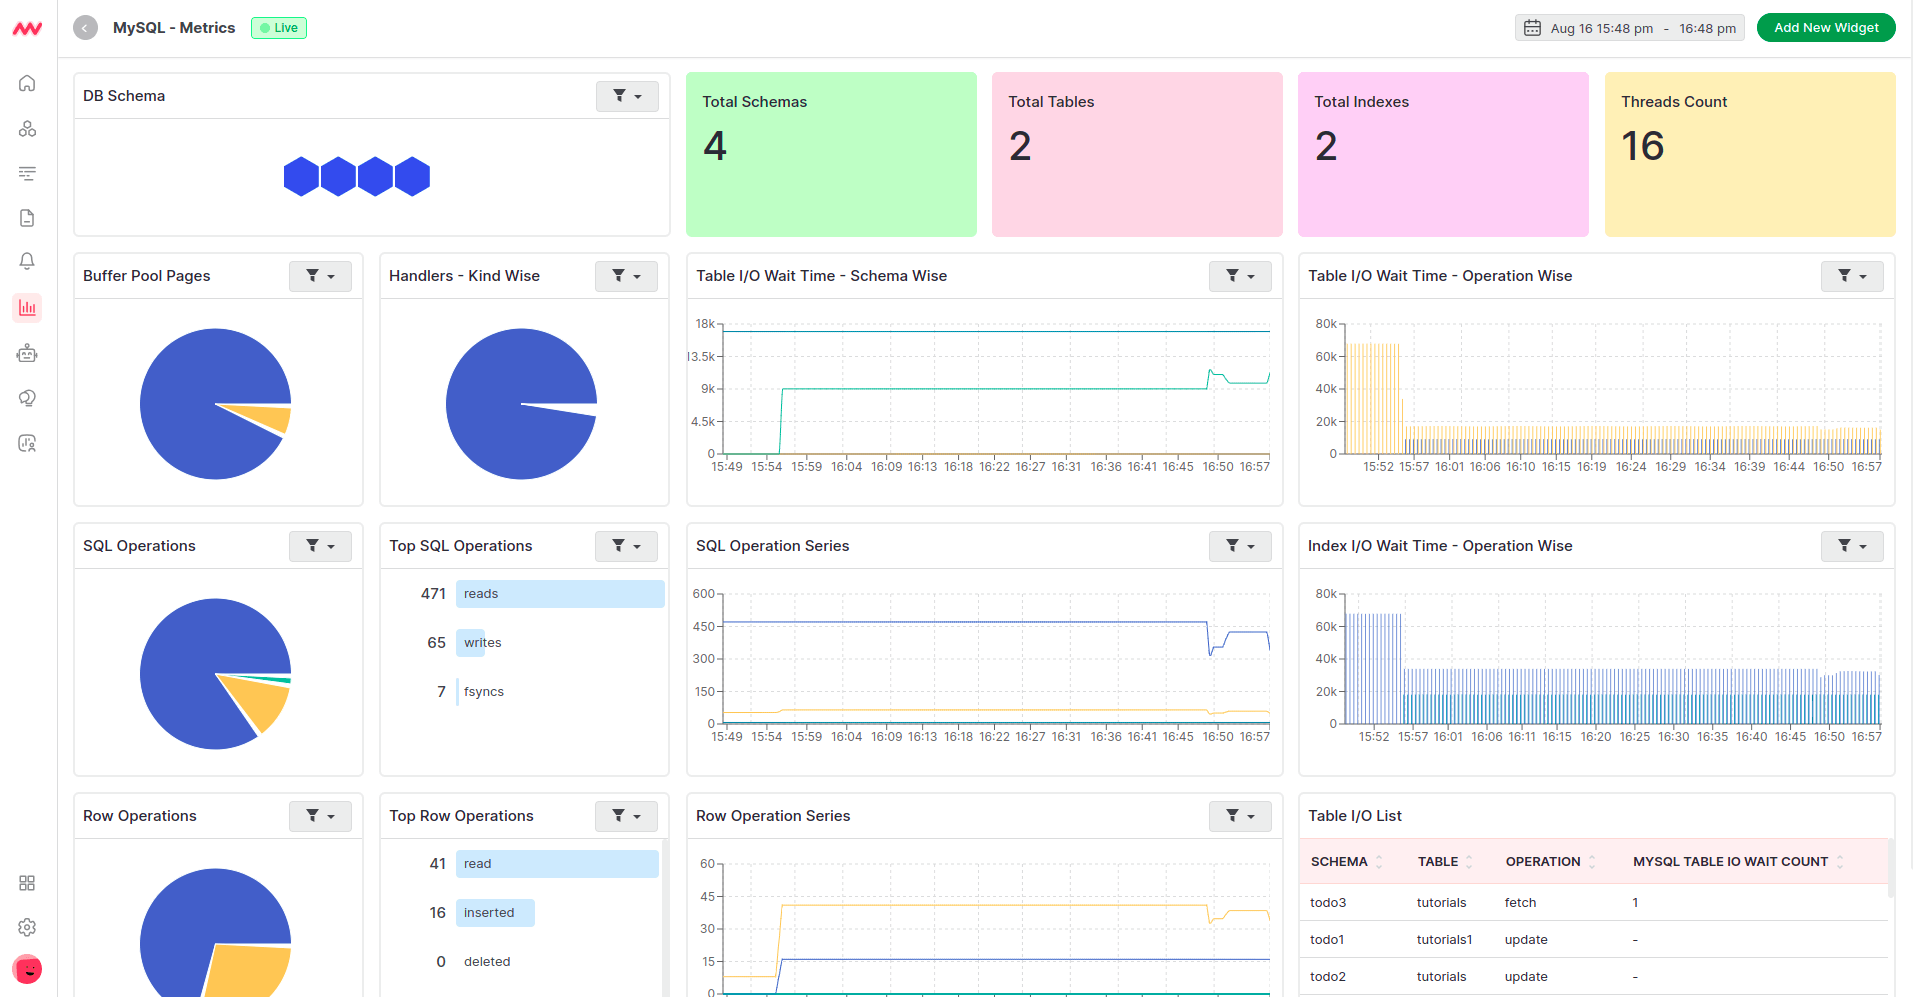
Middleware automatically collects MySQL performance metrics and presents them within its centralized dashboard. This dashboard can be customized to suit your specific needs.
The tool also offers a customized alert system that provides in-depth root cause analysis for a comprehensive understanding of issues. This alert can be configured to trigger anomaly detection and send notifications when specific thresholds are exceeded.
Middleware supports all the key MySQL metrics including but not limited to mysql.buffer_pool.pages, mysql.operations, mysql.table.io.wait.time, mysql.locks, mysql.query.slow.count, and mysql.statement_event.count. While offering correlation of metrics for in-depth analysis, Middleware also provides a causation-to-correlation feature that spots when an issue begins and where it ends.
Middleware offers both free and paid plans, with a pricing model for the modern, scalable architecture. They charge $49 per database.
Start monitoring MySQL with Middleware. Get Started Free.
MySQL Enterprise Monitor
MySQL Enterprise Monitor is an enterprise monitoring tool designed specifically for MySQL. Because of this, you need no agent or complex configuration to use it. It provides real-time visibility into the performance and availability of your MySQL database.
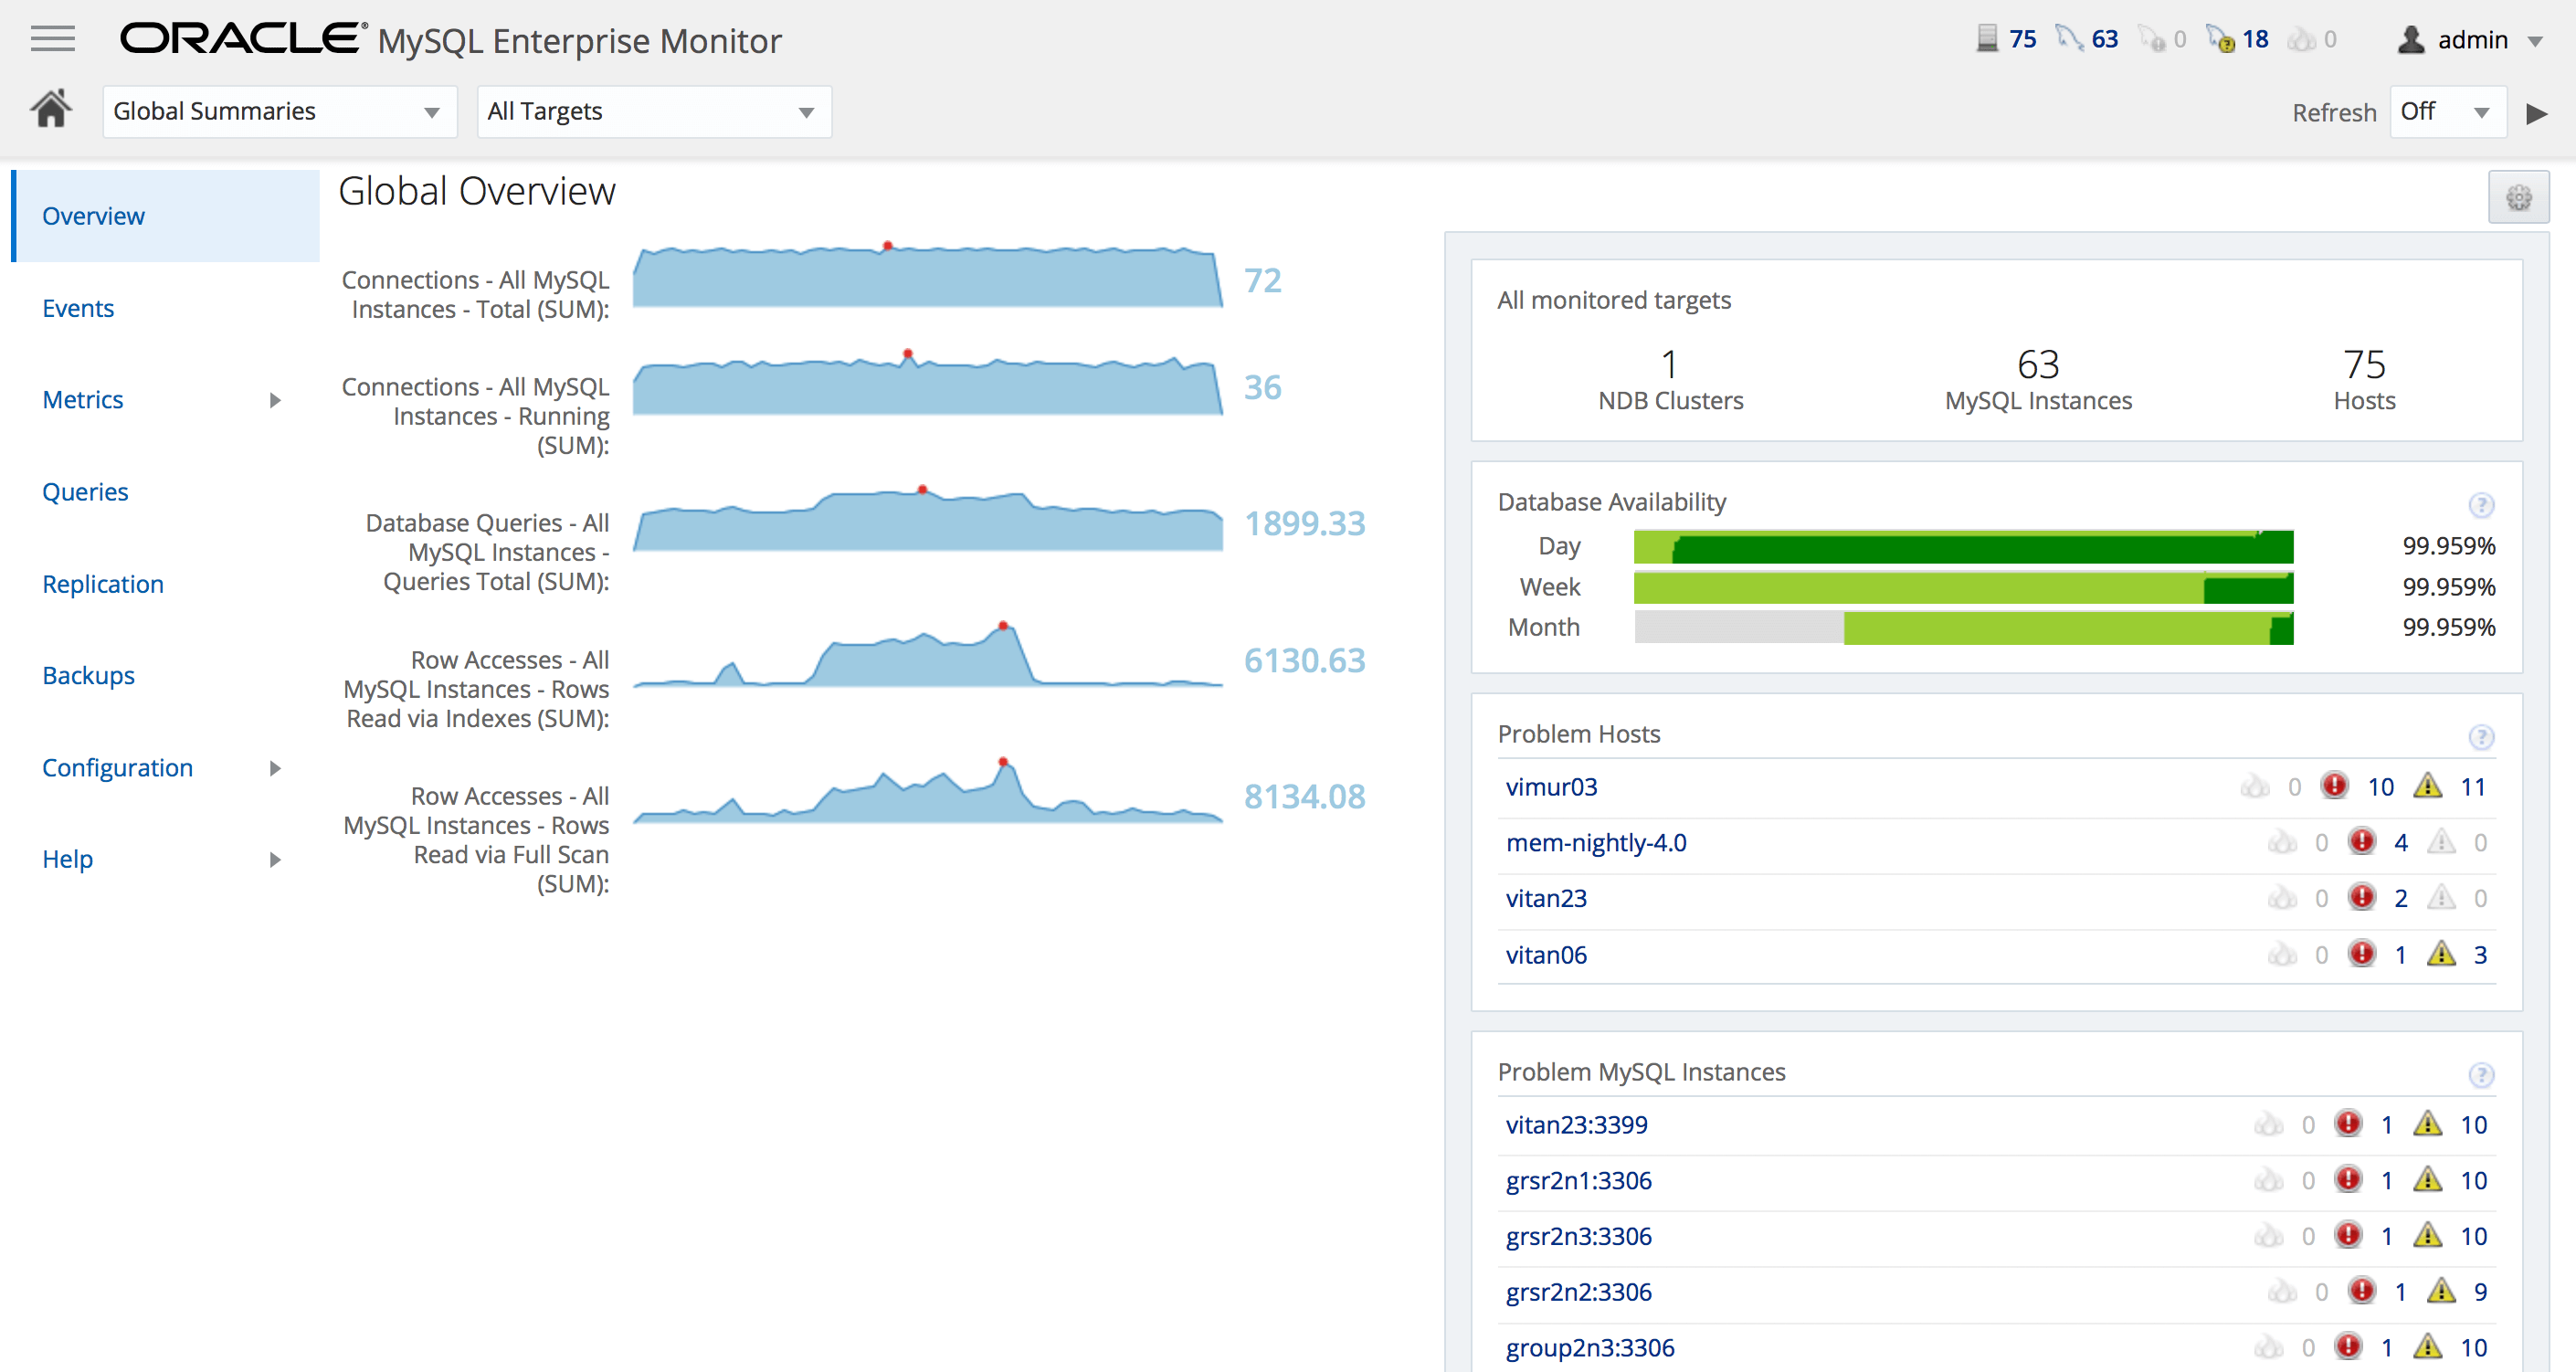
MySQL Enterprise Monitor has an alert system that notifies you about issues and helps you resolve them swiftly. The cost is based on an annual subscription, with a two-core server starting at $5,350 per year. Additional cores or servers can be added to the license for a fee of up to $32,100.
Prometheus (open-source)
Prometheus is an open-source monitoring tool for applications and databases, including MySQL. Once you install a MySQL exporter, it collects key metrics from your MySQL deployment and sends them to Prometheus.
Because of the limitation of its visualization system, Prometheus is integrated with Grafana for a more graphical view, which allows you to create dashboards and graphs to visualize MySQL metrics.
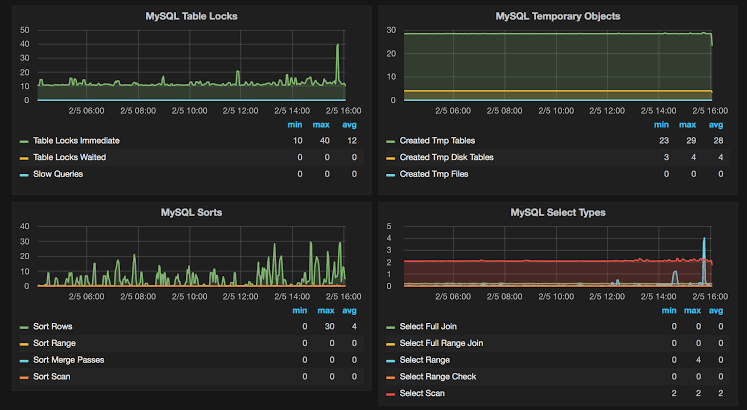
You can also set up alerts based on defined thresholds and rules, for real-time notifications for issues and anomalies. However, Prometheus does not support distributed tracing and cannot therefore provide you with contextual information about your MySQL database. In any event, Prometheus is free to use.
Sematext
Sematext is a monitoring tool for monitoring applications and their infrastructures. It works with MySQL and can retrieve metrics from any MySQL deployment.
With its dashboard, you can view all key MySQL metrics through its charts designed for error detection, root-cause analysis, and troubleshooting.
Sematext also has an alerting system that notifies you whenever an issue is discovered. Sematext charges per node or agent in your PostgreSQL cluster, and there’s a 14-day free trial with no limitations regarding its features.
Datadog
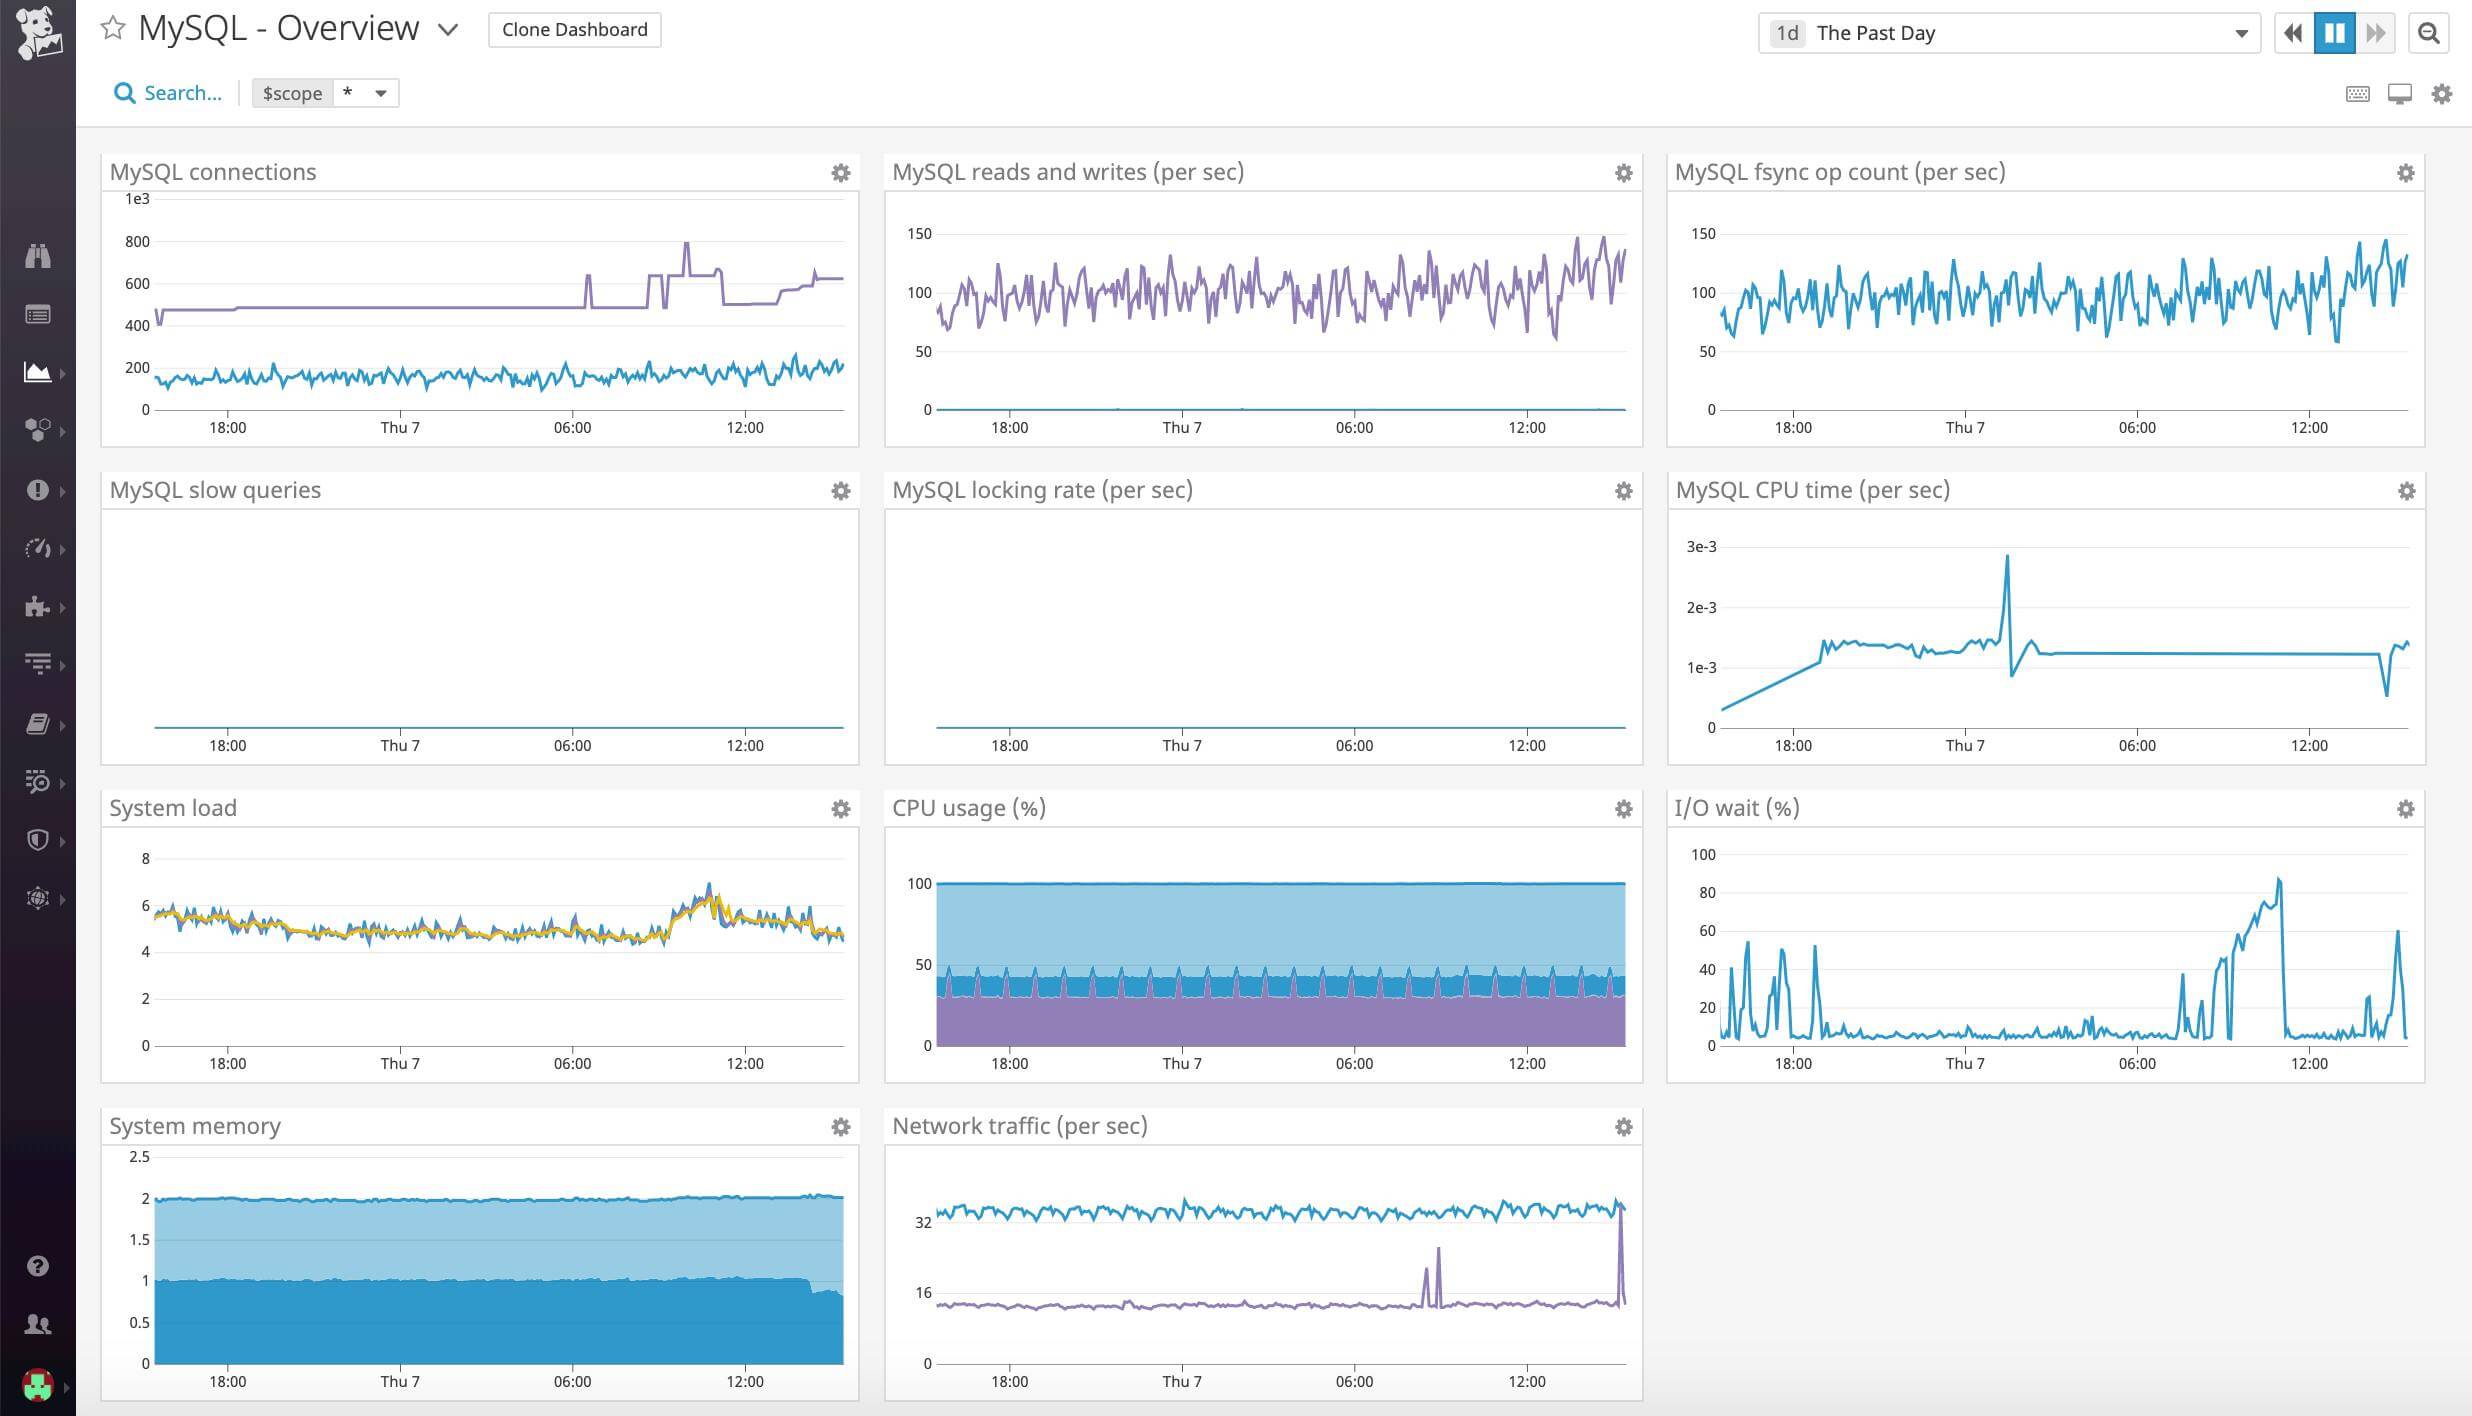
Datadog is a monitoring tool that provides a host of solutions including management and monitoring of infrastructures. It seamlessly monitors MySQL databases and collects metrics that matter. With the Datadog dashboard, you can view the historical performance of your MySQL databases.
Datadog’s database monitoring price follows a per-host pricing model, meaning you are charged based on the number of database hosts you are monitoring.
Datadog pricing offers two billing options: the High watermark plan where you’ll be charged based on the highest number of unique database hosts you monitor each hour within a month and the Annual plan where you commit to a specific number of database hosts upfront for a year and receive a discount.
The cost is $70 per database host per month if billed annually or $84 per database host per month if billed on-demand (pay-as-you-go). It has a 14-day free trial without limitations.
SolarWinds
Solarwinds is an observability platform for monitoring various systems, including MySQL databases.
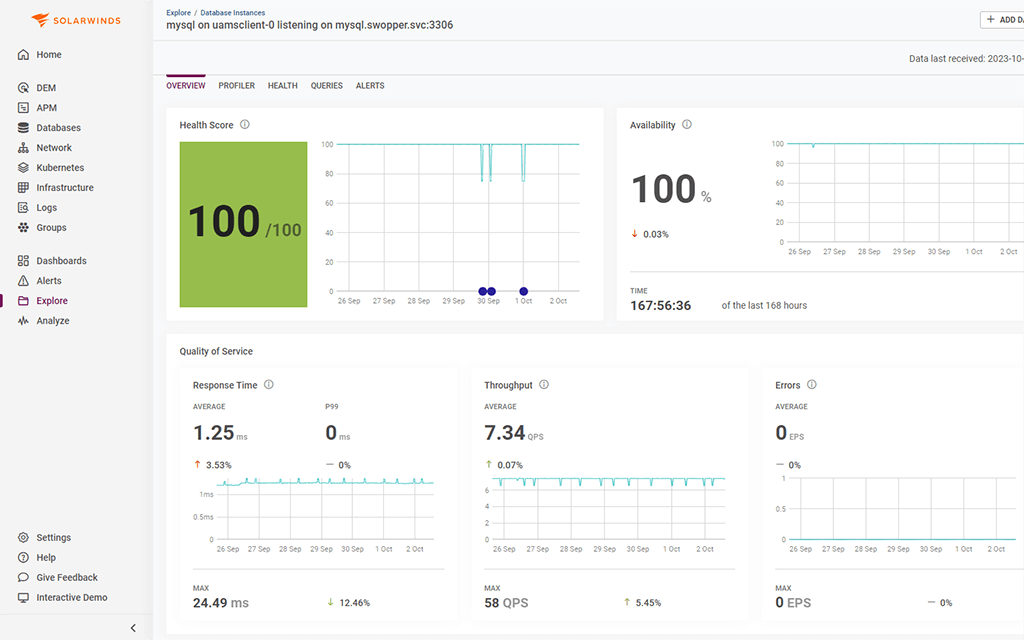
Its database performance monitoring capability (DPM) helps pinpoint MySQL issues through agents that auto-discover your systems. With DPM, you can examine your instances globally and analyze individual problem queries on specific instances.
Through Solarwinds’ user-friendly dashboard, you can swiftly identify the source of a slow query, discover the root cause of the issue, and correlate it with server resources.
On Solarwind, you can choose either a periodic subscription or a perpetual licensing option with a price starting at $1,275 alongside a 30-day free trial.
Dynatrace
Dynatrace is a cloud-based monitoring solution that detects every MySQL performance metric for analysis.
It compares current MySQL performance to historical data to establish a performance baseline. Dynatrace also can view MySQL from the application’s standpoint.
For instance, it automatically identifies queries that read a large amount of data. Dynatrace’s pricing structure is feature-based, as it is calculated based on the number of host units per hour. Pricing for the logs aspect is however based on the volume.
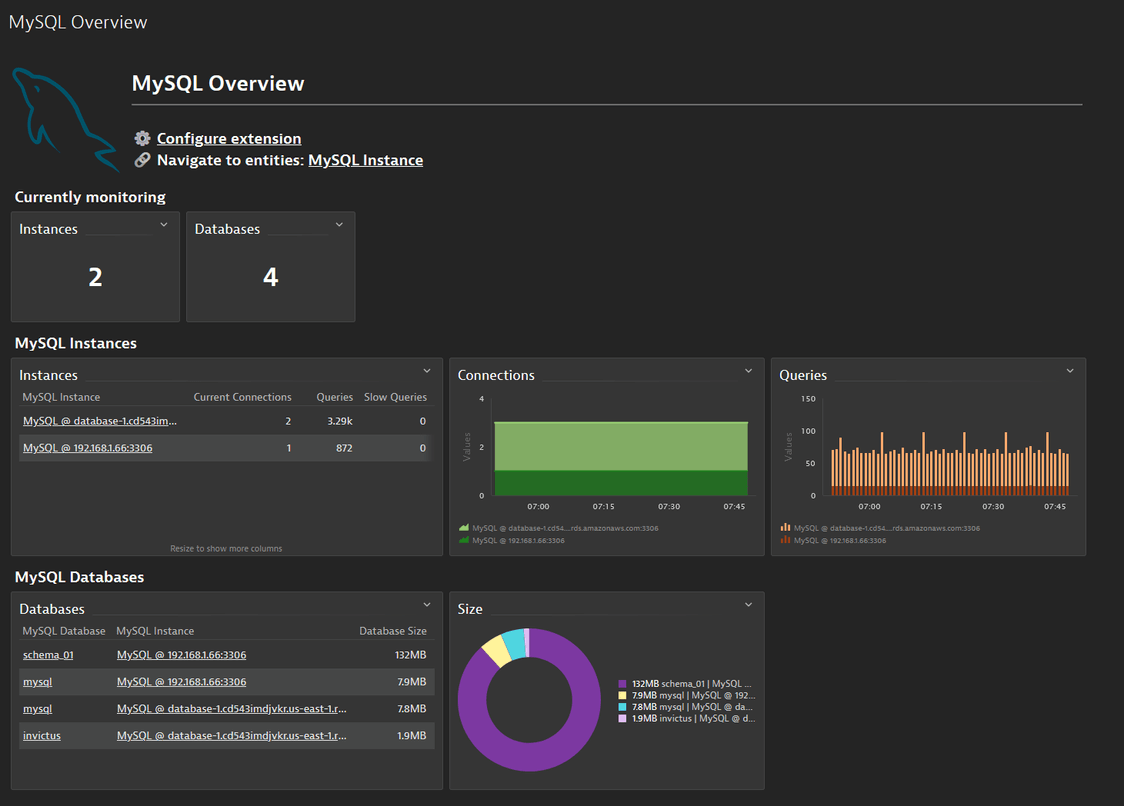
ManageEngine Applications Manager
This MySQL performance monitoring tool monitors key MySQL metrics, including request statistics, connection statistics, and table lock statistics, among others.
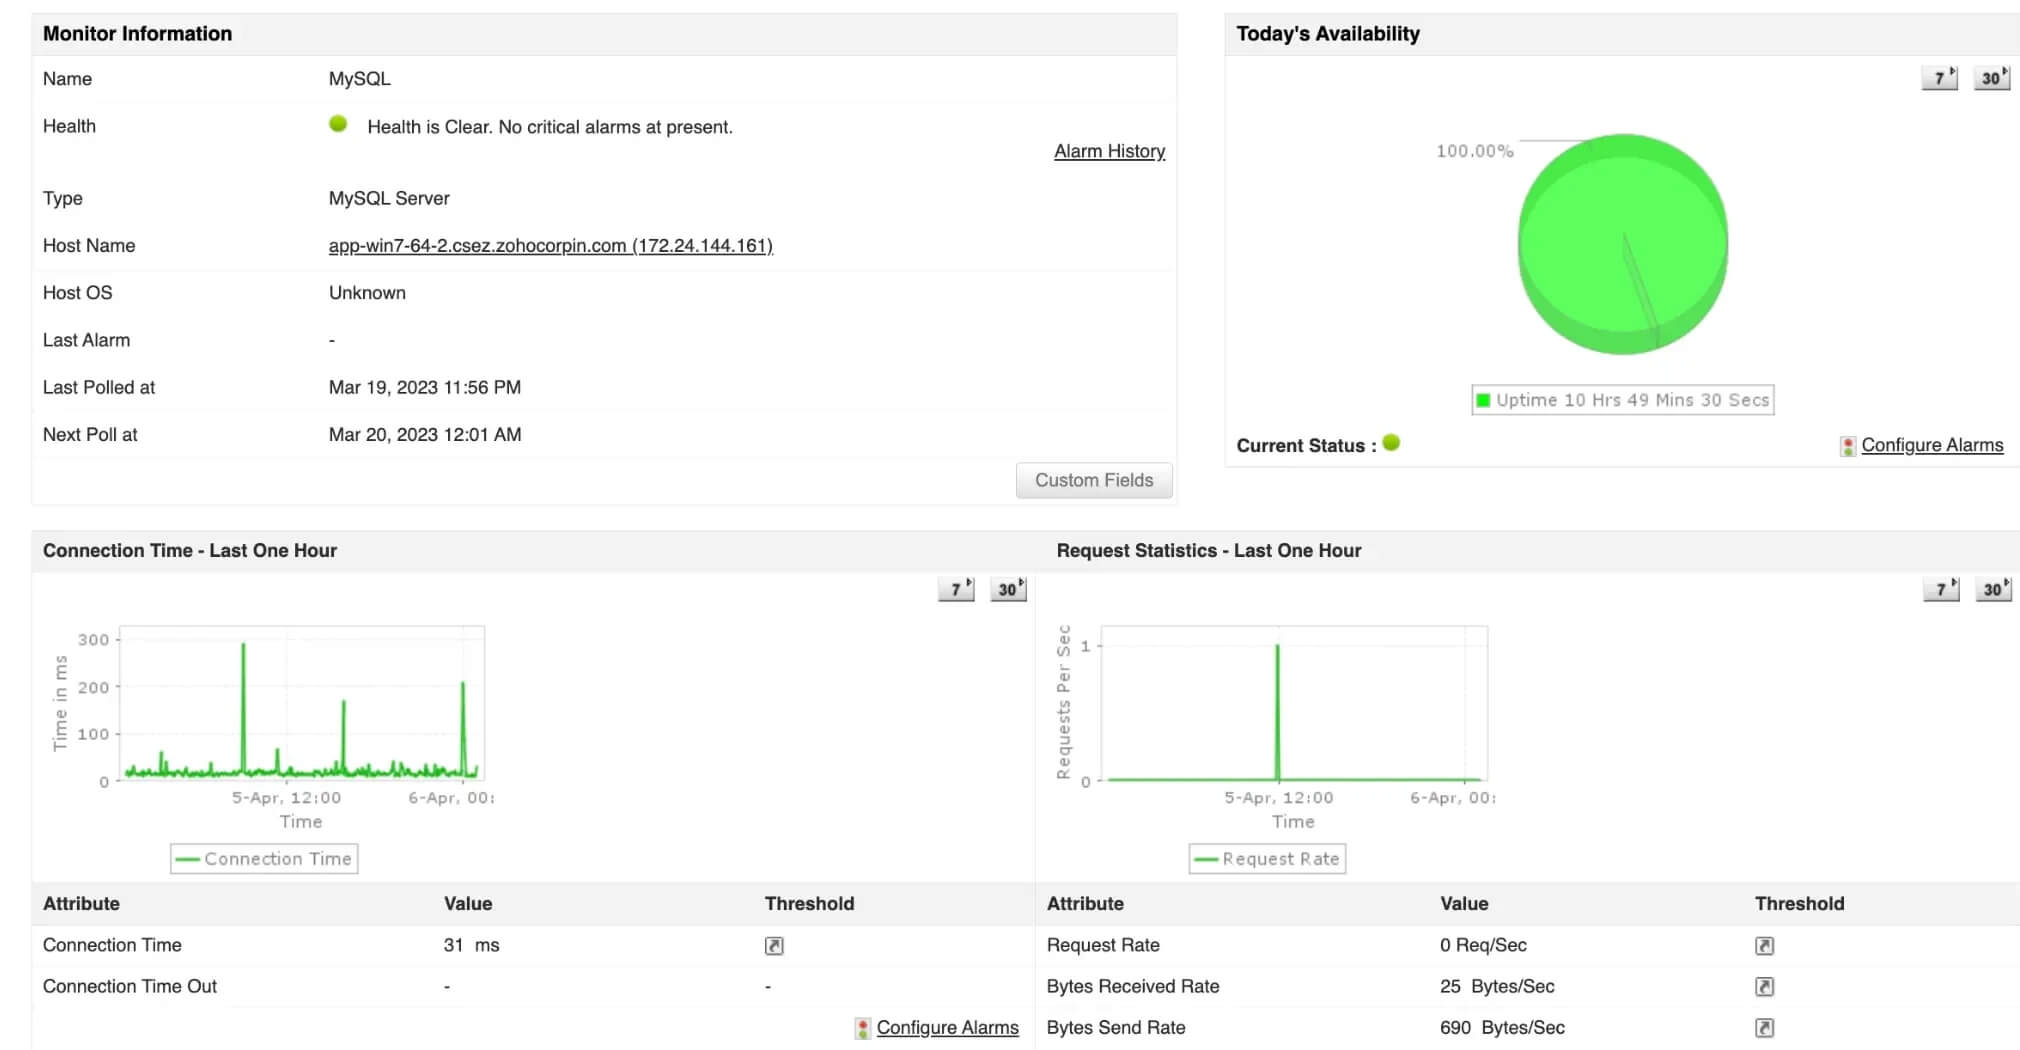
It also can trigger notifications in the event of any error or anomaly. ManageEngine Applications Manager helps you track the health and execution stats of specific queries to optimize database performance.
The pricing for ManageEngine is determined by the version of ManageEngine Applications Manager you choose, that is, between Professional and Enterprise.
Final thoughts
Monitoring MySQL database performance is not only a necessity but a best practice for software developers.
As you’ve learned the key metrics to observe, it is crucial to monitor the database with the right tool, to unlock insights that pave the way for enhanced reliability.
With the ability to capture and analyze performance data, a proficient monitoring tool like Middleware will make all the difference in identifying and addressing performance bottlenecks.
Middleware’s intuitive customizable dashboard, advanced alerting capabilities, and AI-driven insights are all you need to optimize your MySQL database performance.