
You know how frustrating it can be when you try to use a web or mobile app and see that the pages aren’t responding or something isn’t working as it should.
When users face delays or errors in your web or mobile app, especially during purchases or financial transactions, it damages trust and leads to churn. Digital Experience Monitoring (DEM) helps you identify these issues early by tracking real user behavior, synthetic performance tests, and backend metrics.
In this guide, you’ll learn how DEM works, its key components, and how Middleware simplifies the entire process.
What Is Digital Experience Monitoring (DEM)?
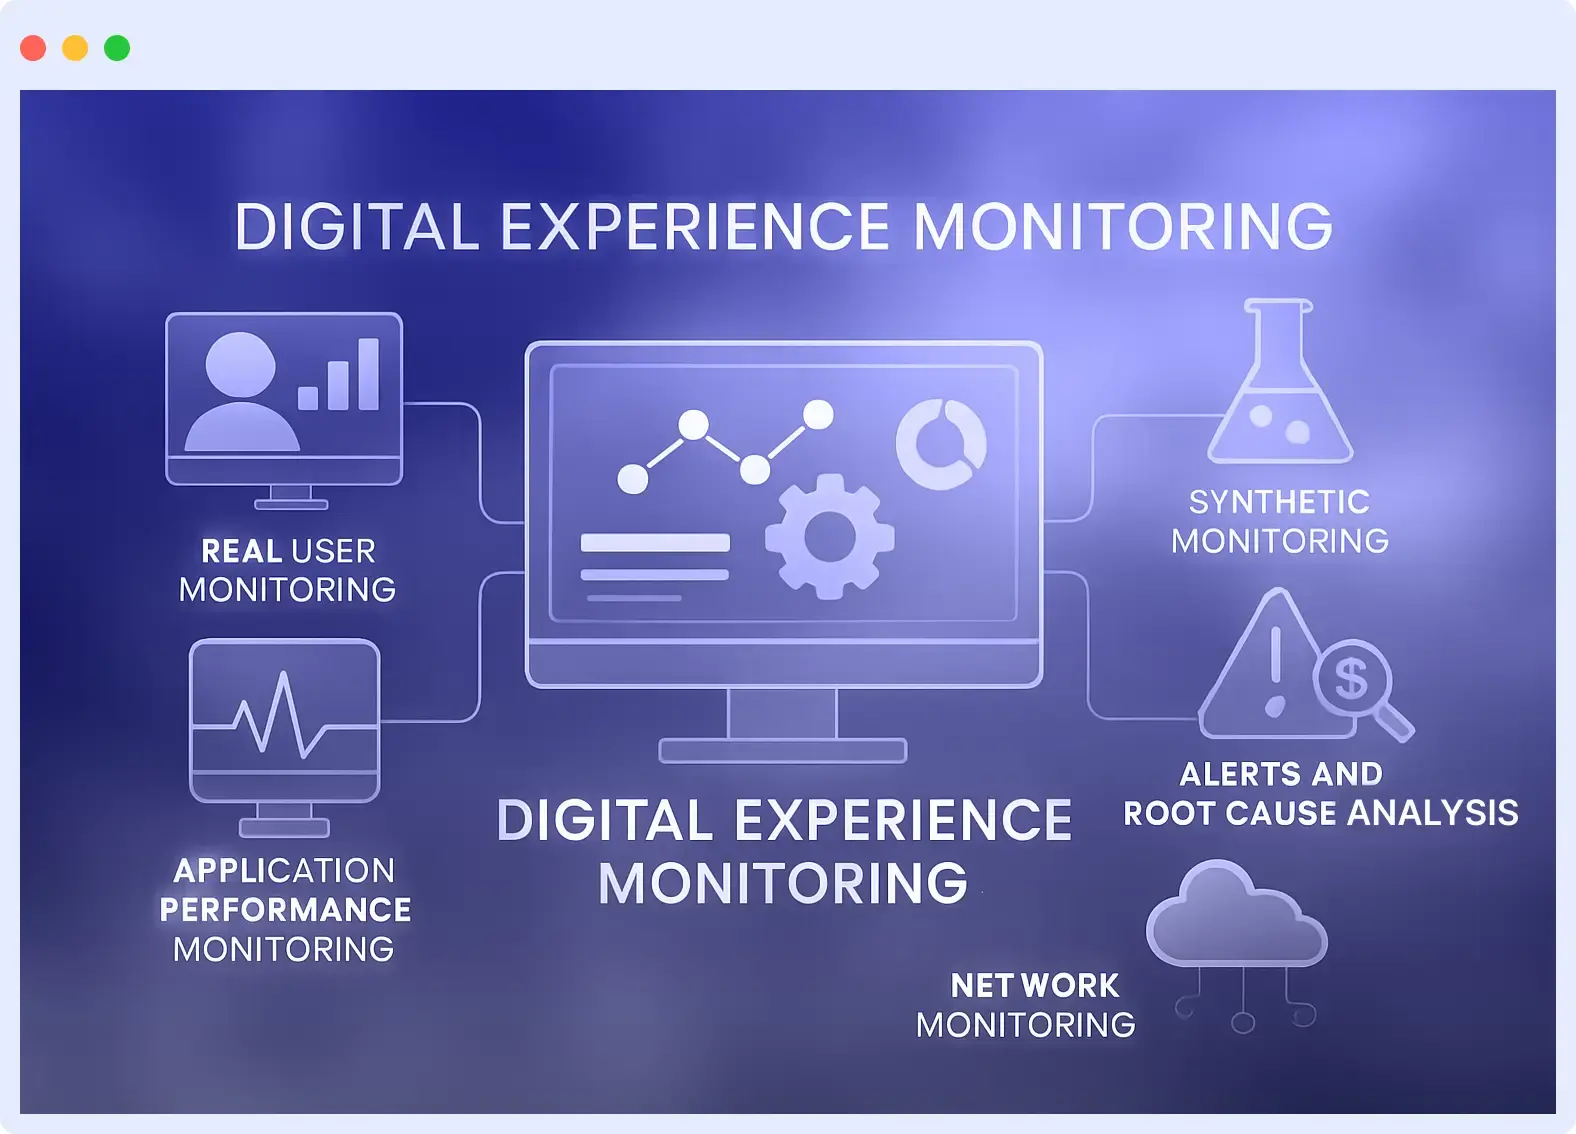
Digital Experience Monitoring (DEM) refers to the way users interact with and experience a digital platform or service. This can be on the web, mobile, or any other platform. DEM tracks page load time, latency, navigation patterns, clicks, and drop-offs.
The main goals of DEM are to detect problems, improve usability, show performance, and support continuous improvement. It uses various monitoring techniques to carry out those tasks. These include:
- Application Performance Monitoring (APM): APM focuses on monitoring the backend part of an application. It collects data on response time, CPU usage, memory consumption, and error rates.
- Real User Monitoring (RUM): It involves the continuous collection of performance data from real users. RUM shows the time it takes a page to load. It also shows the most used features and where users encounter problems.
- Synthetic Monitoring: This mimics how people interact with an application using an automated script or bot. Synthetic monitoring also tests for performance across different locations, browsers, and devices.
- Session Replay: Session replay plays back all user sessions for teams to analyze what users did. It’ll also show where they had issues and what caused them.
- Network Performance Monitoring: This tracks latency, bandwidth, and packet loss. It ensures a good connection among devices. It also resolves network issues that can hinder the digital experience.
DEM helps identify common application performance issues like slow page loads, API latency, JavaScript errors, and network failures that can impact user experience.
How Digital Experience Monitoring Works
Here’s a breakdown of how digital experience monitoring works:
1. Data Collection
DEM relies on various methods to collect data. We’ve discussed these methods in the previous section. They include RUM, APM, session replay, network performance monitoring, and synthetic monitoring.
It collects data from users, synthetic tests, backend systems, and network layers to create a comprehensive view of digital performance from the user’s perspective. These data include:
- User interaction data
- Performance metrics
- Error rates
- Network metrics
- Response time
2. Correlation and Analysis
This involves connecting data points from different sources to provide a full view of the digital experience. After DEM tools collect data through various methods, they correlate these datasets to identify the relationship between different system components and user interactions.
For example, DEM can link slow load times experienced by users to network bandwidth issues or high CPU usage on backend servers. This will help the team to pinpoint the root cause of performance problems.
3. Visualization
Dashboards are used to display results, enabling you to understand the details of an incident. It also shows you performance trends and user experience metrics. This will expedite troubleshooting and facilitate collaboration among various teams within the organization.
4. Alerting
It sends notifications when there’s unusual behavior. Most DEM tools enable businesses to set up custom alerts for key events, such as slow page loads, high error rates, failed synthetic transactions, or outages.
Learn how timely notifications can help your team respond faster, reduce downtime, and stay ahead of performance issues with Real-Time Alerts.
How DEM Improves User Journeys
Digital Experience Monitoring improves user journeys in the following ways:
1. Find & Fix Problems Early
Let’s take a look at a banking app, where users send and receive money. Say the development team made an update, and one morning, there’s a glitch. People can’t open the app; it’s taking forever to load. That is one of the most annoying experiences, especially if you need to access the money immediately.
With DEM in place, teams see up to 4× faster incident resolution and 65% lower MTTR because faster fixes mean better user experiences.
DEM helps you quickly spot those problems, whether it’s a broken feature or a slow response time. Users may not even notice because it monitors and identifies issues before they occur.
| Before DEM | After DEM |
| Users face delays or downtime without teams knowing | Issues are detected instantly via synthetic tests and real user metrics |
| Developers investigate blindly, unsure if it’s a frontend or backend issue | DEM pinpoints root causes with full-stack visibility |
| Glitches go live and affect real transactions | Problems flagged pre-deployment or as they occur, minimizing user impact |
2. Make Apps Faster & More Reliable
Still, with the banking app example, the reason why the app keeps loading can be caused by anything: a slow API, large files, or a poor network connection.
With DEM, teams can pinpoint precisely where the problem originates. It might be the frontend, backend, or even the user’s device. However, once you identify and resolve the issue, the app becomes faster. People can now make transactions quickly without frustration.
| Before DEM | After DEM |
| App load times vary widely across devices and regions | DEM provides geo-specific insights to optimize performance for all users |
| Teams guess where bottlenecks are (e.g., is it API, CDN, or JS?) | DEM shows precisely where the delay is: frontend, backend, network, or user device |
| Performance issues degrade during traffic spikes | Load testing and synthetic monitoring prepare the system for high-demand periods |
| Frequent crashes or latency on mobile are hard to diagnose | Session replay and mobile SDKs provide visibility into app behavior on all devices |
3. Boost User Satisfaction
When people use your app without any problems, they’re more likely to stick with it and even tell their friends about it.
Take an online travel agency, for example. During festive periods, their platform often lags due to high bookings. The site becomes slow, and people turn to look for other alternatives. However, if the agency addresses these issues promptly, people will complete their bookings. That means more money and good reviews for the company.
This shows how important DEM is. It doesn’t just make users happy, it also builds trust and loyalty.
| Before DEM | After DEM |
| Poor performance leads to high bounce rates or cart abandonment | Smooth, fast experiences encourage users to stay and complete actions |
| Negative reviews and user churn increase | Happy users are more likely to leave positive reviews and refer others |
| Teams are reactive — solving problems after users are affected | Teams are reactive, solving problems after users are affected |
| Trust in digital products decreases with every failed experience | Reliable performance builds long-term trust and brand loyalty |
4. Ensure Consistency Across Devices & Platforms
People use different devices to access applications, and they expect the same smooth experience on all devices. DEM will help you identify which devices are exhibiting different behaviors so you can rectify them immediately.
| Before DEM | After DEM |
| Users face inconsistent performance across platforms (e.g., works on desktop but crashes on mobile) | DEM ensures unified monitoring across web and mobile for a consistent experience |
| Teams optimize for one platform, ignoring issues on the other | Insights from both platforms help teams balance performance across environments |
| Fragmented monitoring leads to blind spots | Unified dashboards provide a single source of truth across devices and sessions |
5. Enable Data-Driven UX Improvements
DEM shows you different user interactions with your app. With that insight, teams can enhance the user experience based on real behavior, rather than guesswork.
| Before DEM | After DEM |
| UX decisions are based on guesswork or subjective feedback | DEM provides session replays, heatmaps, and user flows for evidence-based decisions |
| Teams don’t know where users drop off | Drop-off points and hesitation zones are clearly visualized |
| Hard to prioritize what to fix or improve | Prioritized by impact and frequency of user-facing issues |
How Middleware Enables End-to-End Digital Experience Monitoring (DEM)
Middleware enables Digital Experience Monitoring by combining various capabilities to provide end-to-end observability of the real user journey. Here’s how it works:
Learn more about Middleware’s Real User Monitoring capabilities.
Real User Monitoring (RUM)
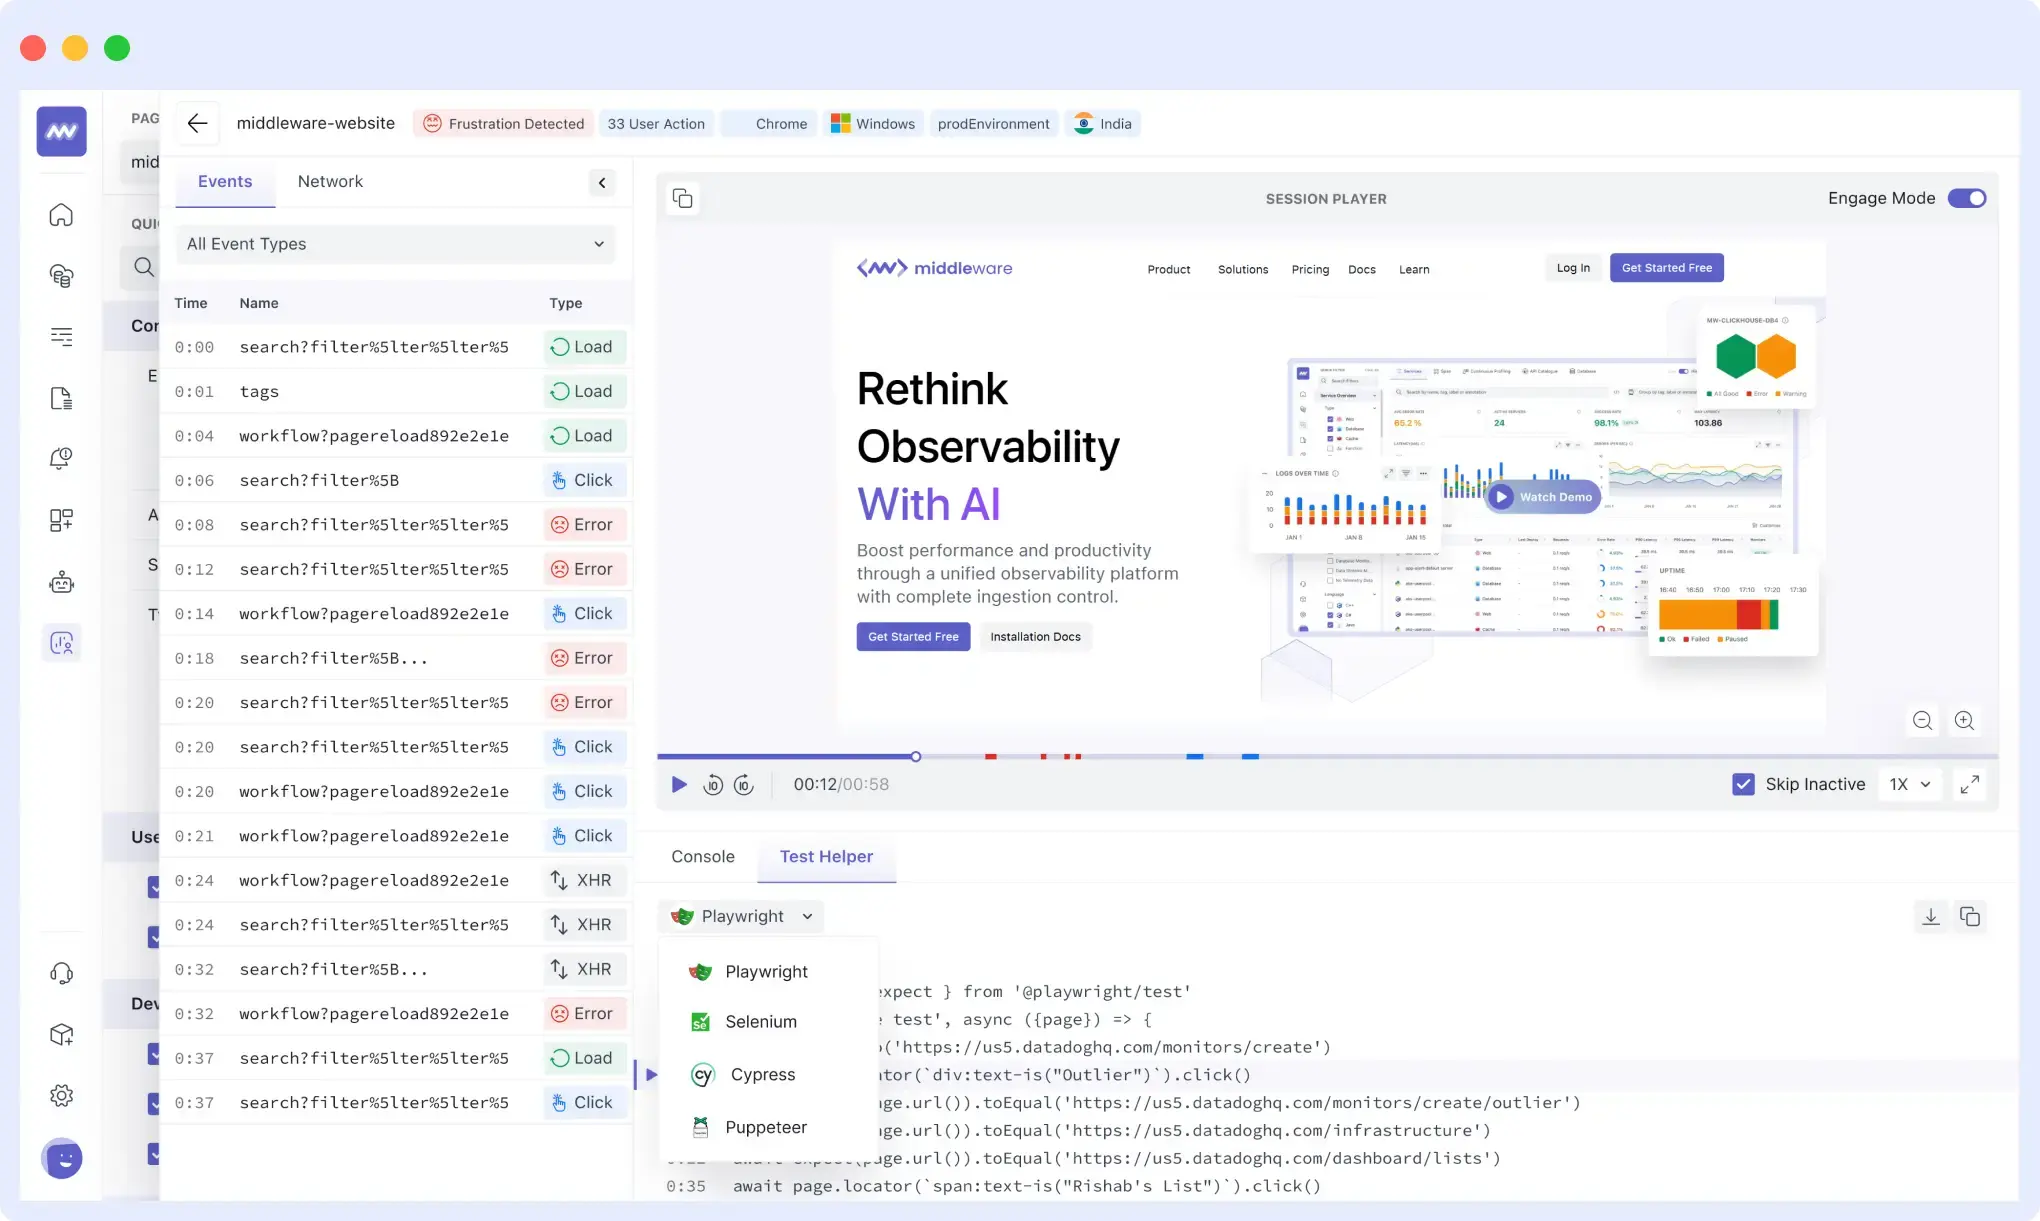
Middleware’s Real User Monitoring capability captures real-time user interactions. It provides a JavaScript code snippet that you can embed into your website and SDKs for your mobile applications. After integrating the code snippet and SDK, you will then be able to do the following:
- Track Performance: It provides you with a thorough understanding of how well apps and websites are performing.. You’ll be able to track metrics such as page load time, error rates, and the number of users on the platform.
- Session Replay: You can record user sessions and replay them to analyze interactions, such as navigation paths, clicks, and scrolls. With this, you can see where something went wrong.
- Error Correlation: Some errors you get on the frontend (like 404, 500, and network errors) are linked to backend issues. Middleware helps you identify this and take necessary action.
Before vs After Middleware DEM
Hotplate, an online food ordering platform, utilizes Middleware’s Real User Monitoring and session replay to quickly diagnose and resolve issues that impact user experience during high-traffic events. This helped them reduce latencies and improve performance.
| Aspect | Before Middleware | After Middleware |
| Observability Costs | Relied on multiple tools, expensive and complex setup | Achieved ~10× reduction in observability costs with a unified solution |
| Incident Root Cause Analysis | Slow troubleshooting, frequent performance issues without clarity | 75% faster incident analysis powered by detailed back‑end traces and session replays |
| Latency & Performance | High latency during high-traffic spikes; limited insights on root causes | Latencies reduced significantly across millions of monthly events with detailed optimization |
| User Session Diagnostics | Hard to understand user-facing issues; reliance on logs and guesswork | Real-time session replays let teams see exactly what users experienced |
| Frontend-Backend Correlation | Frontend errors were disconnected from backend traces, resulting in delays in identifying root causes. | Frontend errors were disconnected from backend traces; delays in identifying root causes. |
| Cost-Efficiency with Scale | Middleware’s pricing incentivizes rich data ingestion, providing more visibility at scale. | Full trace propagation unifies frontend sessions with backend logs for seamless diagnosis. |
Application Performance Monitoring (APM)
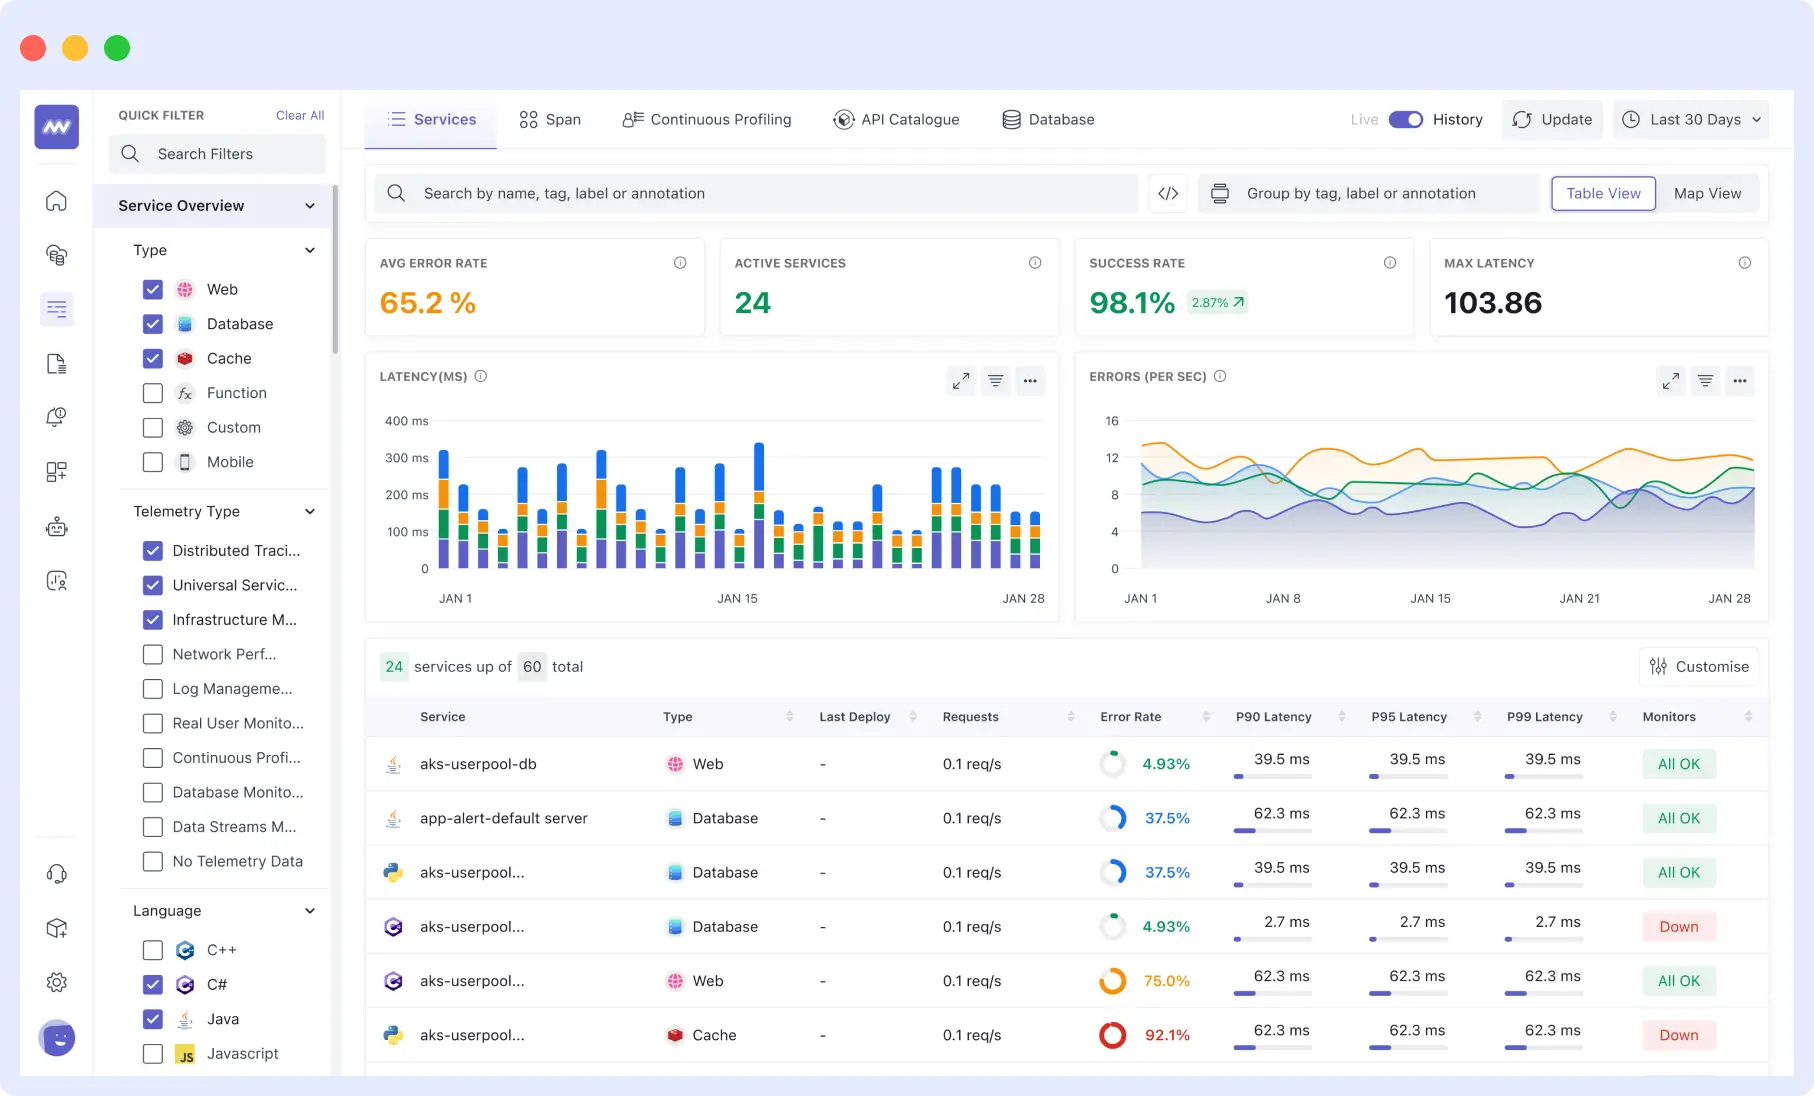
Aside from the frontend, Middleware also captures metrics from your backend service through Application Performance Monitoring. It gives you a complete view of what’s happening with your server. It:
- Monitors memory usage and network activities on servers, containers, and cloud services.
- Collects and analyzes backend logs for errors and any unusual patterns to support root cause analysis and troubleshooting.
- Integrates with cloud services (e.g., AWS) to gather logs and metrics from various backend resources.
- Gives you a view of resource consumption. This will help the team start making plans on scaling.
Middleware also supports various languages, including Python, Java, and Node.js.
Synthetic Monitoring
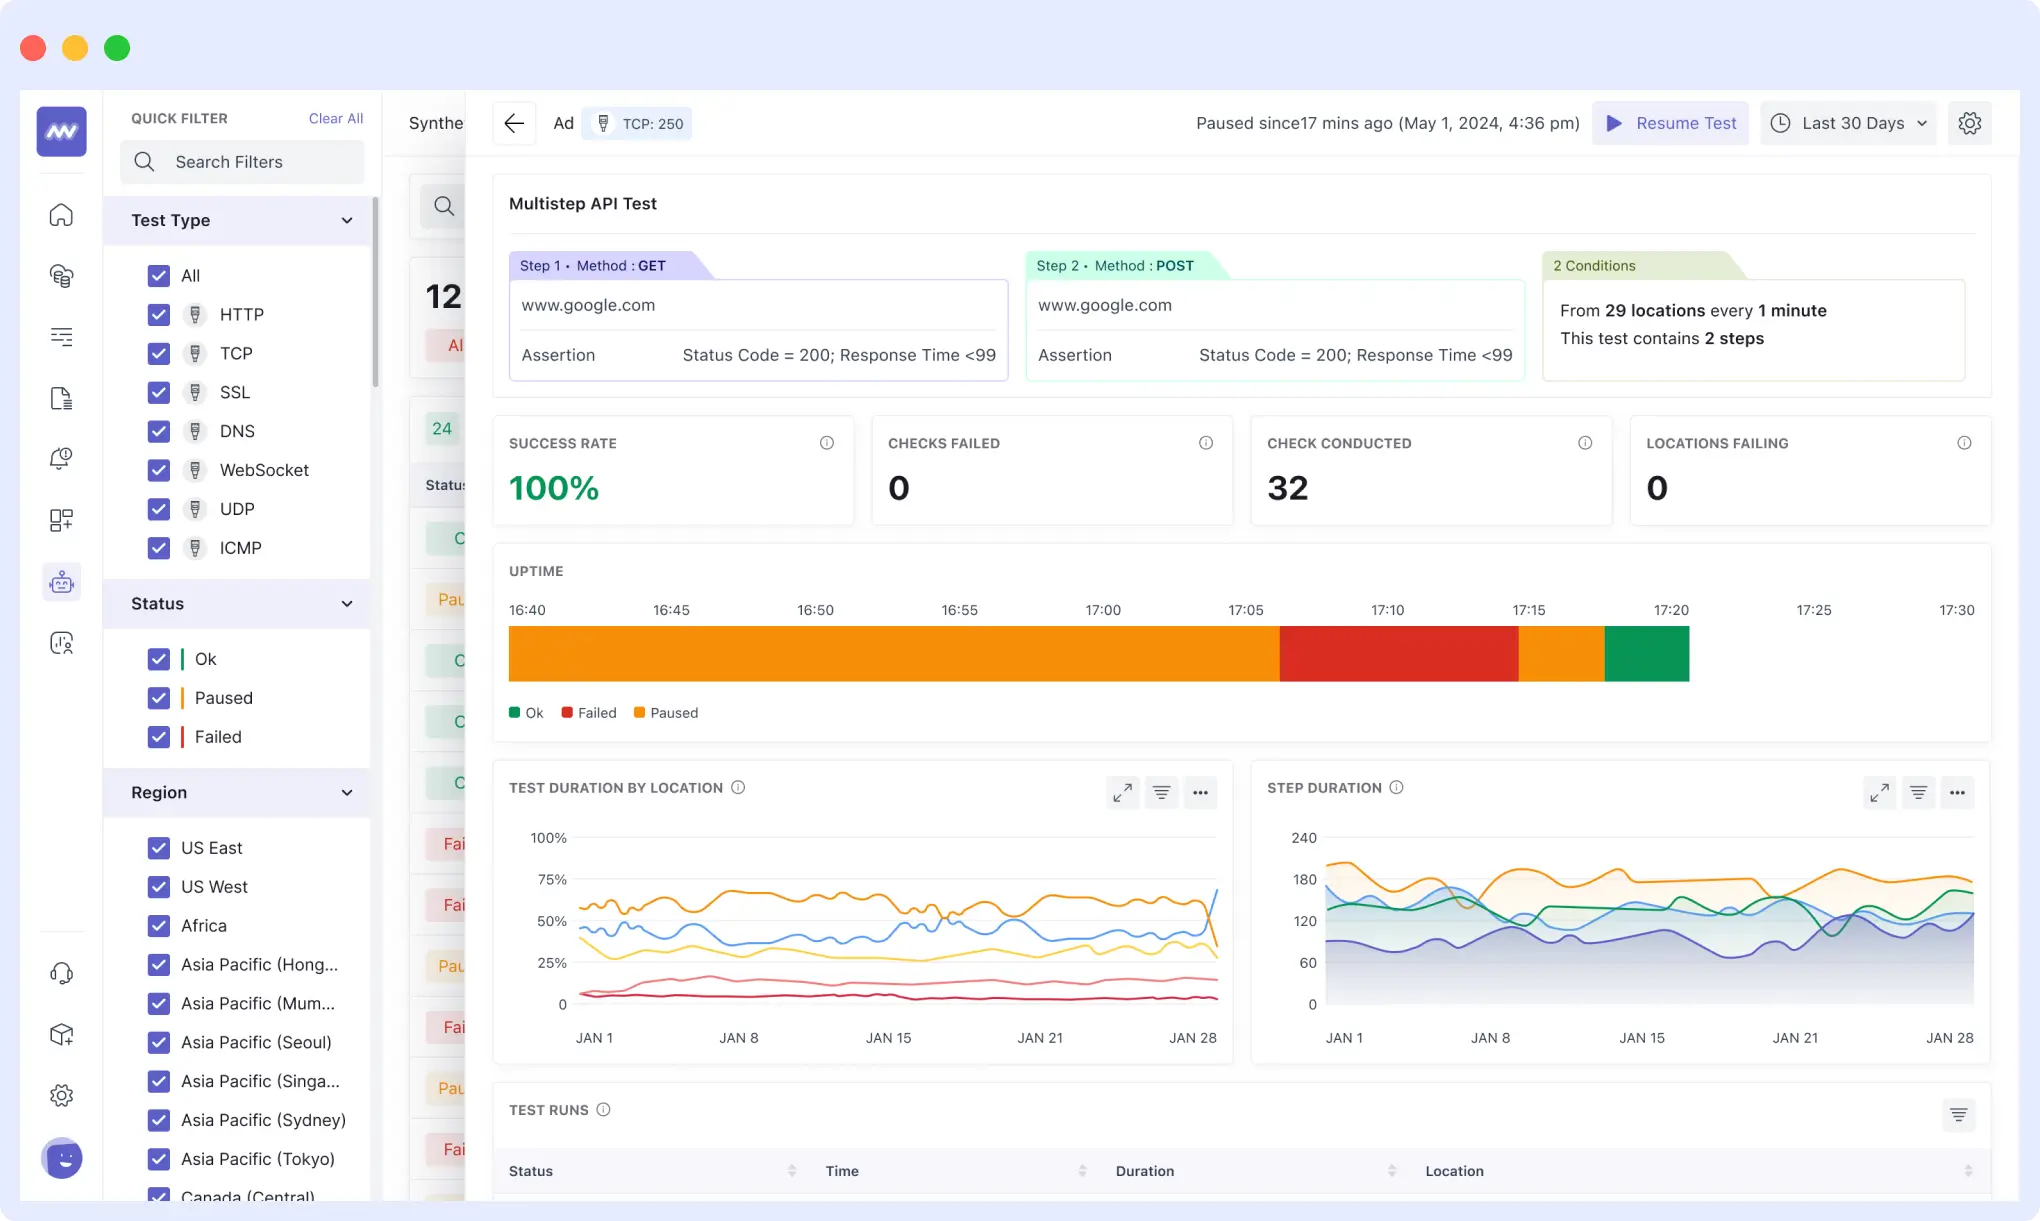
With synthetic monitoring, you can simulate user interactions and API calls to test the application’s performance and availability from different locations and devices. It does this using automated scripts or bots that run continuously from other places around the world.
Here’s how it works:
- Request Simulation: Middleware utilizes multiple locations to send automated, scripted requests (such as HTTP, API calls, or browser actions) to your web pages, APIs, and endpoints.
- Custom Test Creation: To check for expected behaviors, you can add assertions, define request types, create single-step or multi-step tests, and configure authentication.
- Location and Frequency: Tests can be conducted at specific intervals and from various geographic locations. This will enable you to monitor performance worldwide and identify any region-specific issues.
- Dashboards and Reports: A real-time dashboard will show every test result. It will contain all the information recorded during your test.
You can monitor network performance, web page performance, API and endpoint performance, and geographic performance with Middleware’s synthetic monitoring.
Error Detection & Resolution
Middleware enables you to identify and address issues before they affect users quickly. It monitors both backend API errors and front-end issues, including network failures, console logs, and browser errors. Teams don’t have to switch between tools because everything is displayed in one location.
You can rapidly determine the origin and cause of an error with drill-down views and root cause analysis. Additionally, middleware sends alerts when something breaks or behaves strangely, and it supports assertions for API responses.
This reduces the time required to identify problems (MTTD) and resolve them (MTTR).
Best Practices for Web and Mobile DEM
To use DEM well on both web and mobile platforms, you need to take a strategic approach that balances business and technical goals. Here are some things to remember:
Integrate DEM with Existing Systems
Integrate DEM tools with your working stack to create a unified view of user experience across different platforms. Use dashboards that combine both web and mobile performance data for full visibility. This will enable teams to identify and fix issues no matter where they occur.
Optimize Continuously
Monitor the effectiveness of your system and user behavior in real-time. Utilize both RUM and synthetic monitoring to find problems before they affect users. As your apps evolve, regularly review and refine key user journeys, and adjust your monitoring goals and metrics accordingly.
Data Privacy and Scalability
Select DEM tools that align with your business needs and can accommodate new features as they emerge. Follow the rules that apply to you, like GDPR and CCPA, and protect user data by making it anonymous.
Collaboration
Prioritize communication and sharing of DEM results as a key collaboration area for DevOps, product, and business teams. Use session replay to help everyone understand the problems that users are having.
Conclusion
Digital Experience Monitoring isn’t just about maintaining speed and reliability; it also makes your app or website better for all users. By spotting issues early and understanding how real people use your product, DEM helps you create smoother, faster, and more enjoyable experiences.
With a tool like Middleware, teams can go from reacting to problems to actively improving the user journey. It makes it easy for them to see where you can improve and helps you fix issues before users even notice.
FAQs
What are the main elements of DEM?
The primary elements of DEM are Network Monitoring, Application Performance Monitoring (APM), Synthetic Monitoring, and Real User Monitoring (RUM).
What is the difference between real user monitoring and synthetic monitoring?
RUM examines user behavior, whereas synthetic monitoring employs tests to verify that things work even when no one is using the app.
How does Middleware support DEM across both web and mobile platforms?
Middleware tracks real users, runs tests, monitors performance, and sends alerts to help you fix problems on web and mobile apps.


