



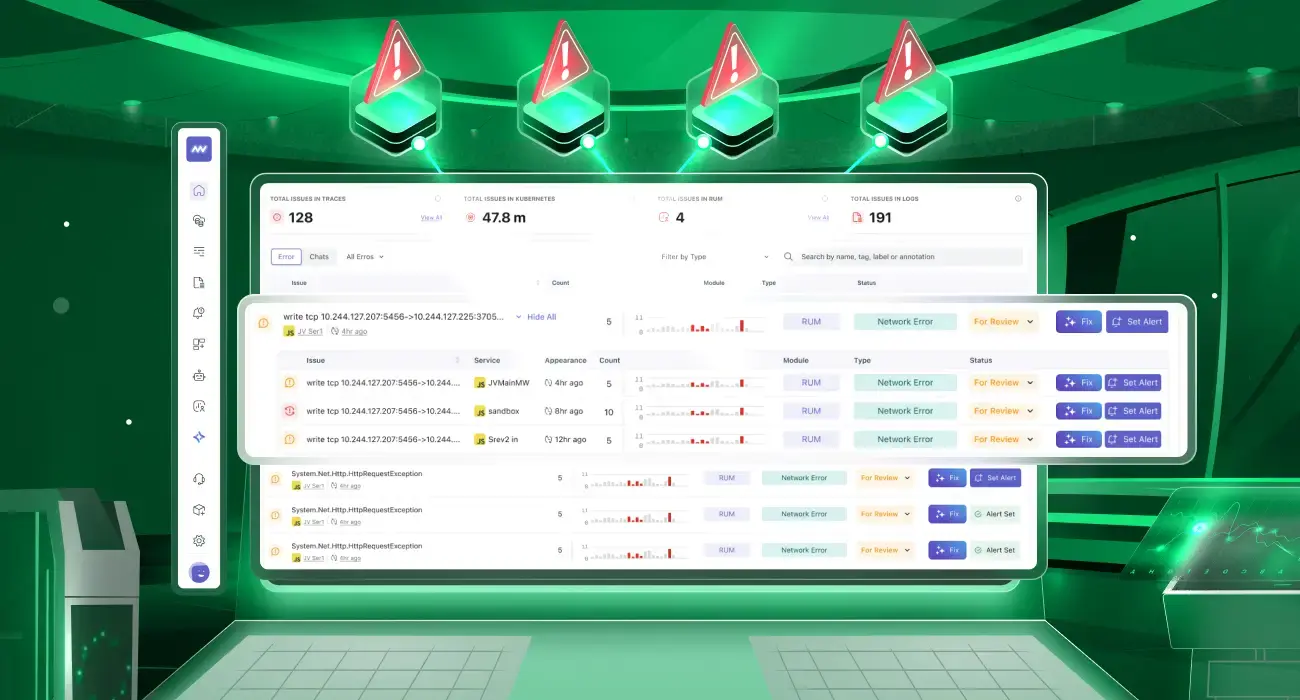
Incident correlation automatically links alerts, logs, traces, and metrics from the same failure into one incident, instead of paging on each signal separately. This article covers how correlation works, the main grouping techniques, and how to apply them when one outage floods your on-call channel with dozens of alerts.
The core trade-off is speed versus trust: group too aggressively and you hide a second, unrelated failure inside one bundled incident; group too conservatively and your team pages on 40 symptoms of the same root cause. By the end, you’ll know which method fits which failure mode, and how to make a 50-alert outage collapse into one actionable incident.
Key takeaways
- Incident correlation groups alerts by shared root cause using signals like service topology, deployment metadata, trace context, and temporal proximity not just matching alert text.
- The most common correlation methods are fingerprint deduplication, topology/dependency mapping, OpenTelemetry trace-context correlation, time-window clustering, and ML-based similarity grouping.
- Correlation and simple deduplication solve different problems: dedup collapses identical repeats of the same alert, correlation links different alerts that share a root cause.
- Vendor benchmarks vary widely (mid-80s to high-90s percent noise reduction), and the number that matters most is your own alert-to-actionable-incident ratio, not a published industry average.
- Trace-context correlation (via consistent OpenTelemetry resource attributes and trace IDs) is the most reliable method for microservice architectures because it ties alerts to the exact request path that failed.
- A 50-alerts-for-one-outage pattern is almost always a topology or deployment-correlation gap, not an alerting-volume problem the fix is grouping logic, not fewer checks.
What Is Incident Correlation and How Does It Work in Observability Tools?
Every incident produces more than one alert. A database connection pool exhausting, for example, can simultaneously trigger a latency alert on the API gateway, an error-rate alert on three downstream services, and a saturation alert on the database host itself. Incident correlation is the layer that recognizes those four alerts as one event rather than four separate pages.
Observability tools do this by matching alerts against shared context: the service that emitted them, their place in the dependency graph, a shared trace ID, or a shared time window. Datadog’s event-management layer, for example, pulls third-party alerts into one filterable timeline instead of leaving engineers to jump between tools. The vendor term varies “correlation,” “grouping,” “aggregation” but the mechanism is the same pattern-matching problem underneath.
How Alert Correlation Actually Works
Correlation engines run in three stages, regardless of vendor: ingest, match, and group.
- Ingest normalizes alerts from every source Prometheus Alertmanager, cloud-provider monitors, APM error thresholds, synthetic checks into a common event schema, usually with a service name, severity, timestamp, and a set of labels or attributes.
- Match compares each new alert against active incidents using one or more keys: identical fingerprint, shared service or host, overlapping trace ID, or a dependency-graph edge (“database X feeds service Y,” so an alert on X near one on Y is a candidate match). This is where methodology diverges most between vendors see the comparison below.
- Group merges matched alerts into a single incident record, typically promoting the highest-severity alert as the primary signal and demoting the rest to supporting evidence, so the on-call engineer sees one page with full context instead of a wall of duplicates.
A concrete example using Prometheus Alertmanager’s native grouping, which correlates purely on label similarity within a time window:
route:
  group_by: ['alertname', 'cluster', 'service']
  group_wait: 30s
  group_interval: 5m
  repeat_interval: 4h
  receiver: 'oncall-pagerduty'
group_by is the correlation key every alert sharing alertname, cluster, and service within the group_wait window collapses into one notification. It’s deliberately simple: label equality, not causal reasoning. Teams outgrow it once they have more than a handful of interdependent services (more on that trade-off below).
Alert Correlation Methods Compared
| Method | How it groups alerts | Setup effort | Best for | Weakness |
| Fingerprint deduplication | Collapses identical repeats of the same alert (same rule, same target) | Low | Flapping checks, retry storms | Doesn’t link different alerts from one root cause |
| Topology/dependency mapping | Uses a service dependency graph to link alerts on upstream/downstream services | Medium–High | Microservices with cascading failures | Requires an accurate, maintained service map |
| Trace-context correlation | Groups alerts and logs that share a trace ID or OpenTelemetry resource attributes | Medium | Distributed tracing environments | Only as good as instrumentation coverage |
| Time-window clustering | Groups alerts firing within a shared time window, regardless of source | Low | Fast triage during an active outage | Prone to false grouping during high-alert-volume periods unrelated events |
| ML-based similarity clustering | Learns historical incident patterns to match new alerts to prior fingerprints | High (needs training data) | Recurring incident types, repeat outages | Opaque grouping logic, needs tuning to avoid over-merging |
Most mature platforms layer two or three of these rather than relying on one. Forrester’s research on ML-assisted triage puts the typical mean-time-to-triage reduction at 25 – 40% once historical incident data is applied, a real gain, but one that assumes clean training data. That’s why topology and ML clustering are usually paired with a simpler fallback like fingerprinting.
5 Techniques for Grouping Related Alerts by Root Cause
1. Fingerprint deduplication
Every alert gets a fingerprint, a hash of the rule, target, and key labels. If the same fingerprint fires again before the last instance resolves, it’s suppressed as a repeat instead of a new page. It’s the cheapest correlation to implement and the first thing to configure; Alertmanager, Datadog Monitors, and Grafana all support it natively.
Fingerprint dedup should be table stakes in every alerting pipeline if it isn’t configured, fix that before touching anything more advanced.
2. Topology and service-dependency correlation
This method uses a dependency graph which services call which, which database backs which API to decide whether two alerts are causally related. If service B calls service A and both fire within a short window, topology correlation links them and can infer directionality: A is upstream, so A’s alert is likely the root cause.
# Example dependency edge definition (conceptual)
services:
  checkout-api:
    depends_on: [payments-service, inventory-service]
  payments-service:
    depends_on: [postgres-payments]
With this graph, an alert on postgres-payments and a subsequent error-rate spike on checkout-api correlate automatically, because the graph shows a two-hop dependency path between them.
Topology correlation catches cascading failures that pure label-matching misses, but it’s only as accurate as how recently the service map was updated stale maps produce silent gaps, not errors.
3. Trace-context correlation via OpenTelemetry
Resource attributes identify which service, instance, or environment a piece of telemetry came from. When those attributes stay consistent across traces, metrics, and logs, a correlation engine can join all three without extra configuration. OpenTelemetry’s semantic conventions standardize those attribute names so data from different languages lines up automatically. In practice, that means tagging every signal with the same service.name and service.namespace, and propagating the trace_id from an incoming request through every downstream call.
# Python OTel SDK: propagate trace context across a service call
from opentelemetry import trace
from opentelemetry.propagate import inject

tracer = trace.get_tracer(__name__)

with tracer.start_as_current_span("checkout.process"):
    headers = {}
    inject(headers)  # injects traceparent header for downstream propagation
    response = requests.post("https://payments-service/charge", headers=headers)
Because the traceparent header carries the trace ID downstream, any alert or log from payments-service during that request joins back to the originating checkout-api span automatically.
Trace-context correlation is the most precise method for microservices, but it only covers what’s instrumented; an uninstrumented hop breaks the chain.
4. Time-window clustering
The simplest catch-all: group any alerts firing within a rolling window (5–10 minutes), regardless of source. This is what Alertmanager’s group_wait/group_interval settings do. It’s a useful baseline even alongside richer correlation, since it catches relationships the topology graph or trace context missed.
Time-window clustering is a good safety net, not a primary strategy on its own; it will occasionally bundle two genuinely unrelated incidents that happen to fire close together.
5. ML-based similarity clustering
Industry analysis of AI-driven incident response consistently points to correlation and context-gathering as the tasks AI handles best the triage work that used to eat an engineer’s first ten minutes on every page. These systems fingerprint resolved incidents and match new alerts against that history, enabling a “seen this before” moment where the fix that worked last time surfaces immediately. That’s the real difference from plain alerting: the system remembers what worked instead of starting cold.
ML clustering pays off most on recurring incident types; a first-time novel failure gets far less benefit than the fifth occurrence of a known one.
How to Reduce Alert Noise When 50 Alerts Fire for One Outage
If your team is getting dozens of pages for a single root cause, the fix is almost never “alert less” ; it’s correlating what you already have. Work through these in order:
- Audit for missing dedup first. If the same alert is refiring every time its condition re-evaluates, fix that before anything else it’s inflating your count artificially.
- Check whether your service map is current. Topology correlation can only link an alert on your database to an alert on the five services that depend on it if that dependency is actually recorded somewhere the tool can read.
- Verify trace propagation isn’t dropped at a gateway or queue. A message broker or API gateway that doesn’t forward the traceparent header silently breaks trace-context correlation for everything downstream of it.
- Widen or narrow the grouping window based on your actual incident duration, not a default value a five-minute window is too short for an outage with a slow blast radius (e.g., a cache eviction cascading over 20 minutes).
- Set a severity hierarchy so the grouped incident promotes the right primary alert group by service/dependency, but page on the highest-severity member, not just the first one to fire.
Concrete scenarios:
- A checkout API outage caused by a database connection pool exhausting: topology correlation should link the pool-saturation alert (root), the checkout-api latency alert, and the payments-service error-rate alert into one incident, with the pool alert promoted as primary.
- A Kubernetes node running out of memory and evicting 12 pods simultaneously: without topology correlation, this produces 12+ separate pod-crash alerts; with it, they collapse into one node-level incident.
- A third-party API dependency going down and triggering timeouts across every service that calls it: trace-context correlation is essential here, since the failures are distributed across unrelated internal services that only share the external call in their trace path.
Where Alert Correlation Fits Into Middleware’s OpsAI
Manual triage jumping between a paging tool, a dashboard, and a log search to figure out if ten alerts are one incident or ten is exactly the correlation work described above, done by hand. Middleware’s OpsAI does that correlation for you: it looks for patterns across the full stack to find a probable root cause, not just list symptoms, pulling logs, metrics, and traces onto one timeline.
That means joining traces, logs, metrics, and frontend session data across backend, frontend, and Kubernetes into a single root-cause analysis, down to the line of code. Teams don’t need to rip out an existing alerting setup OpsAI can ingest alerts straight from Datadog or Grafana and run the same correlated investigation on them inside Middleware.
For recurring incidents, OpsAI fingerprints every issue it resolves, so a similar signature next time gets flagged before it fully escalates the ML-clustering technique from earlier, running automatically. MindOrigin, a fintech platform serving stockbrokers and banks, cut time spent on infrastructure root-cause analysis by roughly 75% after adopting Middleware, largely from this kind of automated correlation replacing manual dashboard-hopping.
FAQs
What is incident correlation and how does it work in observability tools?
Incident correlation is the automatic grouping of alerts, logs, traces, and metrics that share a root cause into a single incident. Tools do this by matching shared context service topology, trace IDs, deployment metadata, and time proximity rather than just matching alert names, so one failure produces one incident instead of many separate pages.
How can I automatically group related alerts from the same root cause?
Layer at least two correlation methods: fingerprint deduplication for exact repeats, plus topology mapping or trace-context correlation (via consistent OpenTelemetry resource attributes) to link causally related alerts across services. Most platforms let you configure a grouping window and a service dependency graph to drive this automatically.
My team gets 50 alerts for one outage. How do I reduce alert noise?
This pattern almost always means correlation, not alert volume, is the gap. Check that dedup is working, that your service dependency map is current, and that trace context propagates across every hop a broken trace chain or stale topology map is the most common reason 50 symptoms of one root cause show up as 50 separate pages.
What's the difference between deduplication and correlation?
Deduplication collapses repeated instances of the same alert (identical rule, identical target). Correlation links different alerts from different services, different alert rules, even different monitoring tools that share an underlying cause. Both are usually needed together.
Does alert correlation replace the need for good alert design?
No. Correlation reduces noise from alerts that are already firing for real reasons; it doesn’t fix non-actionable alerts that shouldn’t exist in the first place. Teams still need to periodically audit and remove alerts with a low actionable-incident conversion rate, independent of how well correlation groups what remains.

