When a service goes down, even if you already created alerts to detect abnormal behavior, the first 10 minutes are often a blur. You’re jumping between the Log Explorer, APM dashboards, and Slack frantically pasting screenshots and links that will be broken or irrelevant by the time the post-mortem starts.
Traditional incident notes fail because they are static. You might write that “DB latency spiked,” but the chart proving it is buried in another tab inside your observability dashboards, disconnected from the investigation itself. The “why” and the “evidence” live in two different worlds.
The Missing Piece of the Operational Puzzle
Most documentation fails because the “proof” rarely lives with the explanation. This gap creates friction in the moments that matter most. Handoffs slow down because the next engineer must rebuild the investigation path. Post-mortems become memory-based because the evidence is buried in dashboards or lost in chat threads.
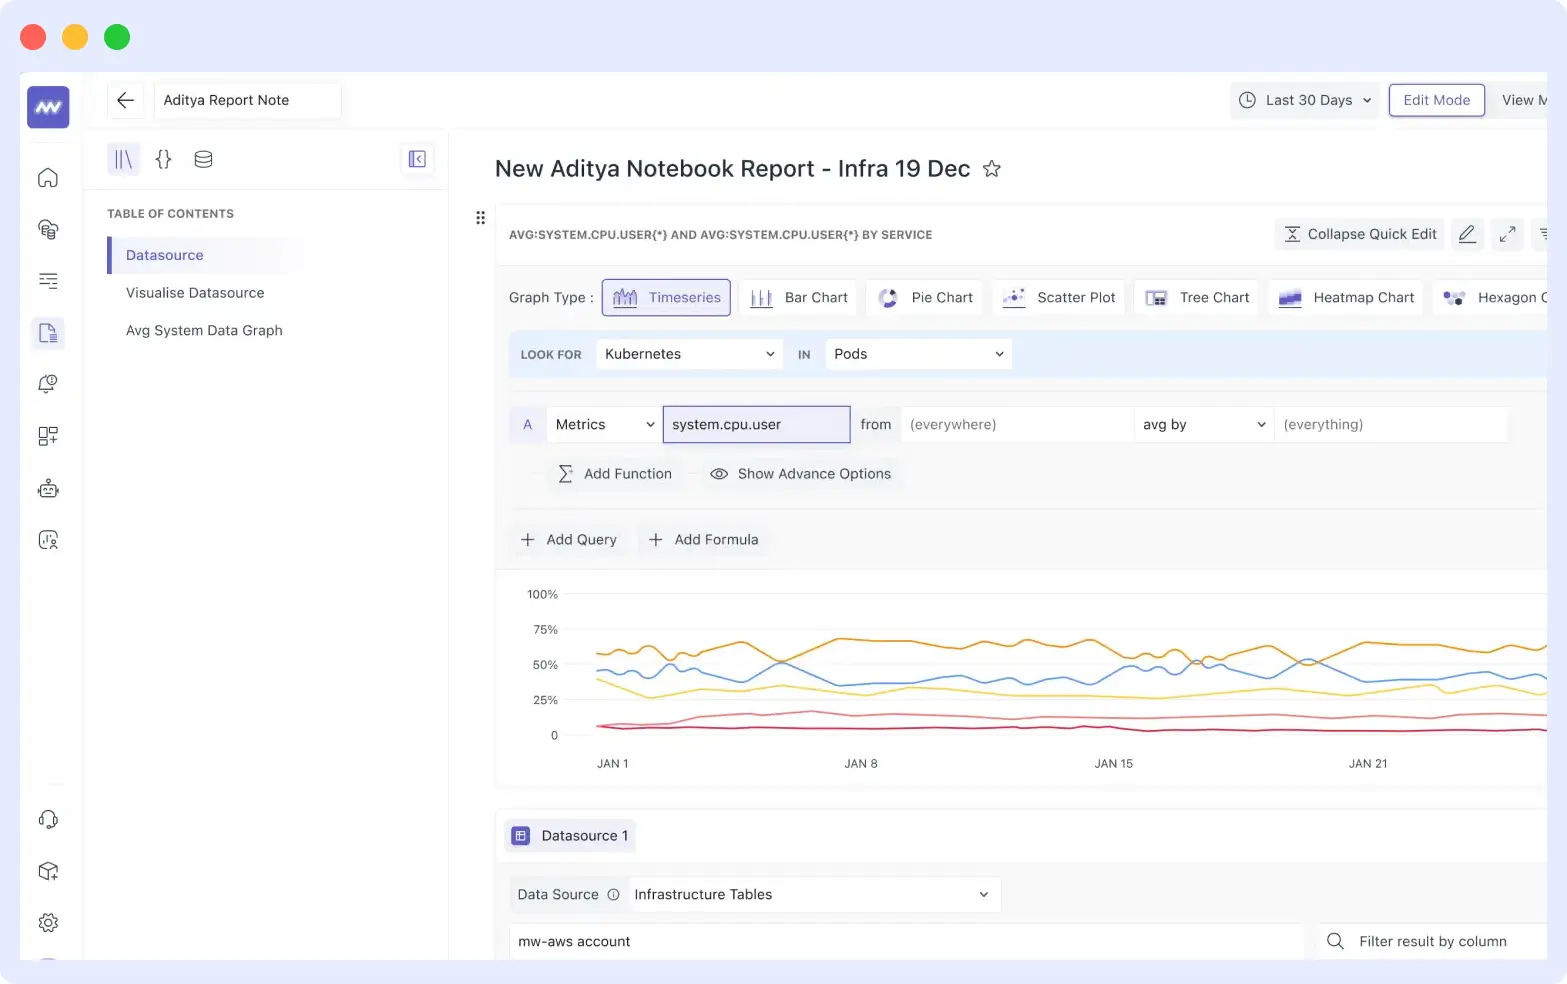
Middleware Notebooks change the experience immediately. Instead of switching between dashboards, logs, traces, and a separate document, you have one place where your reasoning and your supporting visuals sit side-by-side.
“The result is a note that reads like a story but behaves like a technical artifact your team can trust.”
Why Notebooks Feel Different
Notebooks aren’t just a place to type; they are an extension of your telemetry. They combine a rich text editor with Live Data Blocks powered directly by your logs, metrics, and application performance monitoring data.
1. Investigations with “Live Evidence”
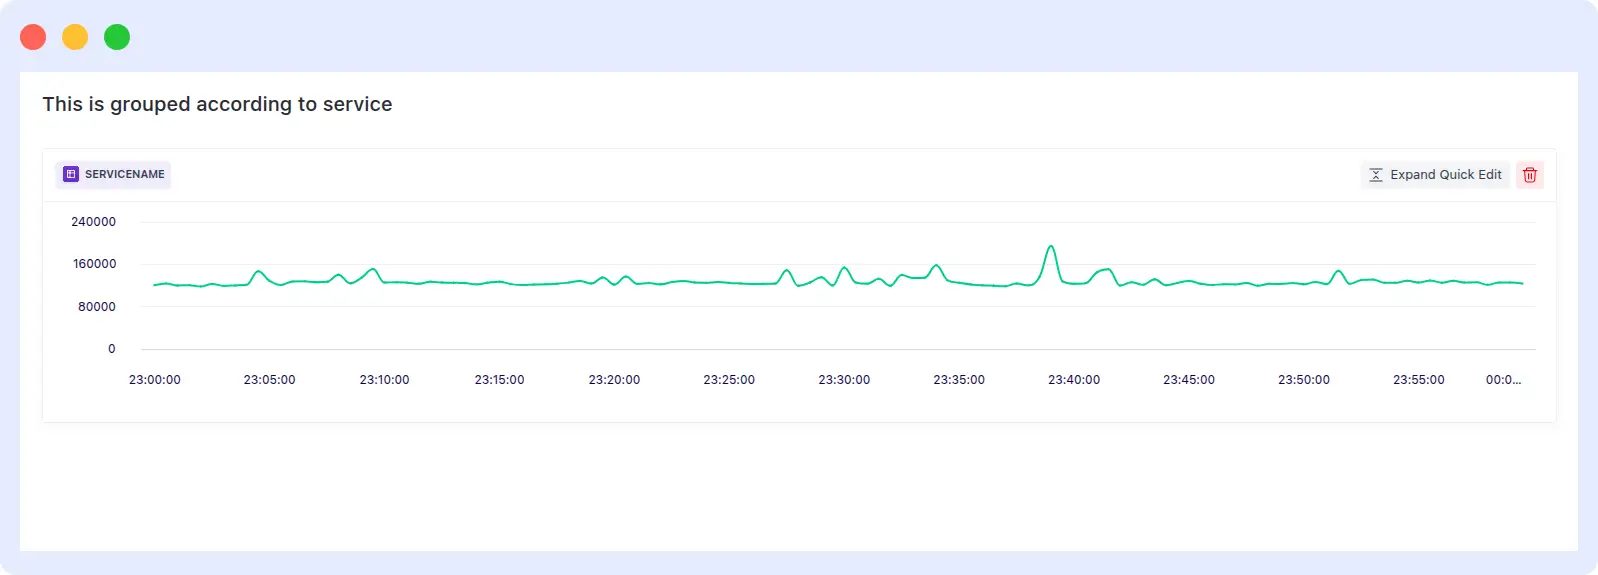
Instead of describing a spike, you drop the query directly into the Notebook. It stays interactive. If a teammate opens the Notebook, they can hover over the data points, change the time range, or tweak the query without leaving the document.
2. Post-Mortems That Build Themselves
Since you’re already documenting your investigation in the Notebook as it happens, your Root Cause Analysis (RCA) is 80% done by the time the issue is resolved. You have the timeline, logic, and proof in a single shareable link.
3. “Living” Runbooks
Turn your static wikis into dynamic instructions. A Notebook runbook can include the “How-To” text alongside live graphs that show what a “Healthy” vs. “Unhealthy” state looks like right now.
Teams can reference healthy service patterns in their Middleware AI dashboards while documenting response steps.
⭐Learn how the AI Dashboard Builder helps you create production-ready observability views from natural language, so you can move from detection to explanation faster. Read More
See it in Action:
How it Works: From Logs to Logic
Getting started is seamless. You can move from raw data to a structured report in seconds:
- Access: Navigate to Logs > Notebooks in the Middleware sidebar.
- Create: Start a new Notebook and give it a title (e.g., “Q1 API Latency Investigation”).
- Build: Mix rich-text documentation with live metrics to create your report, runbook, or troubleshooting sandbox.
Beyond Plain Text: Collaborative Notes Powered by Graphs
Most documentation fails because the “proof” rarely lives with the explanation. Middleware Notebooks bridge this gap by bringing narrative and observability data into a single workflow.
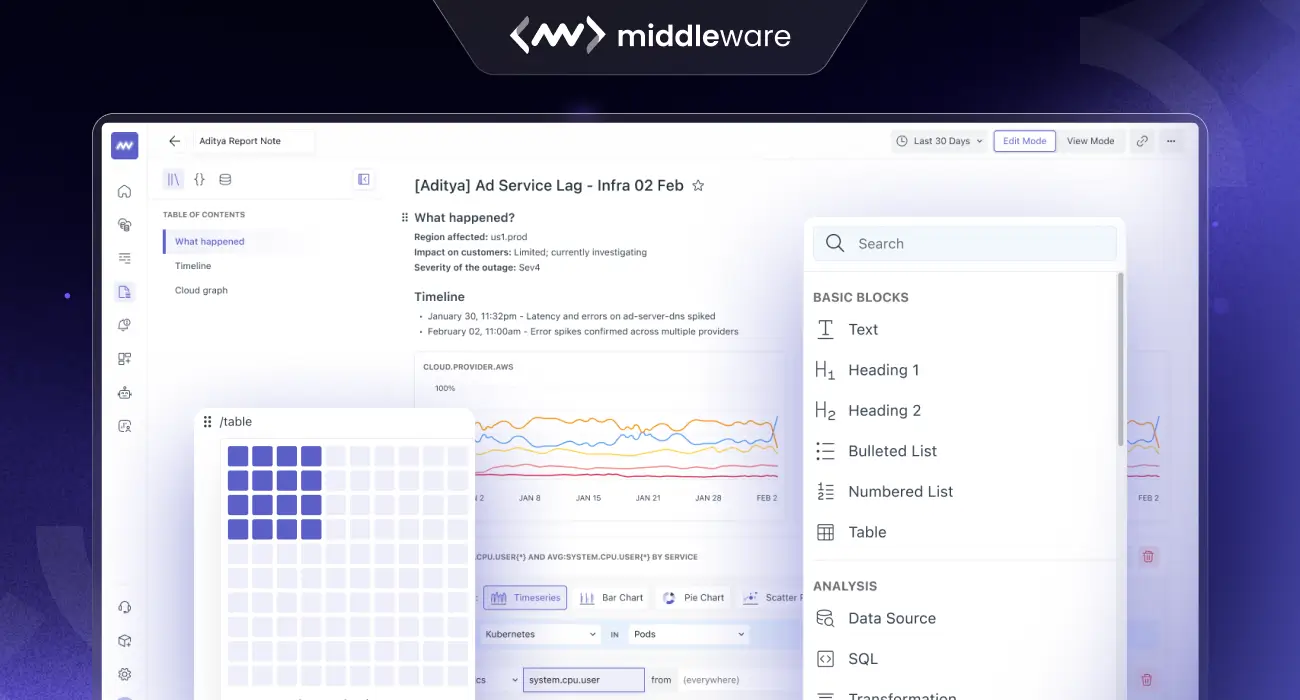
Unlike a static wiki, Notebooks are an extension of your telemetry. You can start with a clean page, add structured text, and drop in log monitoring queries as interactive charts or tables. When you’re ready to loop in the team, they see the same notes and the same supporting views, eliminating the need to re-explain your logic in chat.
1. Flexible Visualization Types
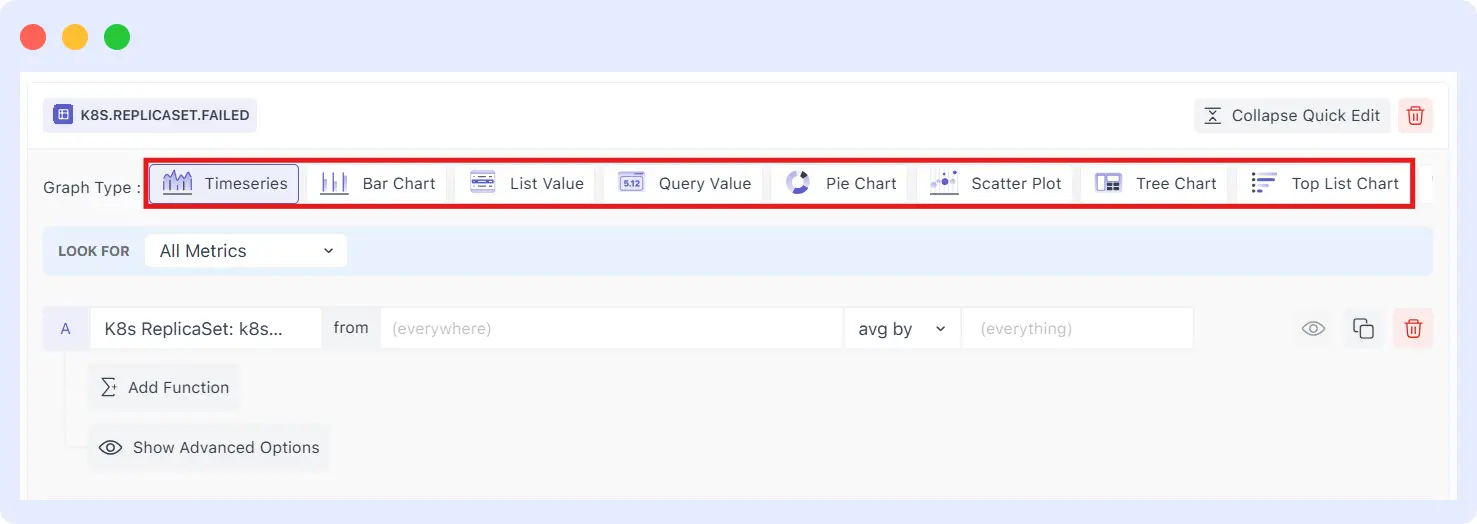
Pick the type that matches your goal. From the data source editor, you can choose output styles including:
- Timeseries & Bar Charts for trends and spikes.
- Pie, Scatter, & Tree Charts for distribution and relationship analysis.
- List Values for quick breakdown tables.
- Hexagon & Top List Charts for high-density data.
2. Configure with “Quick Edit”
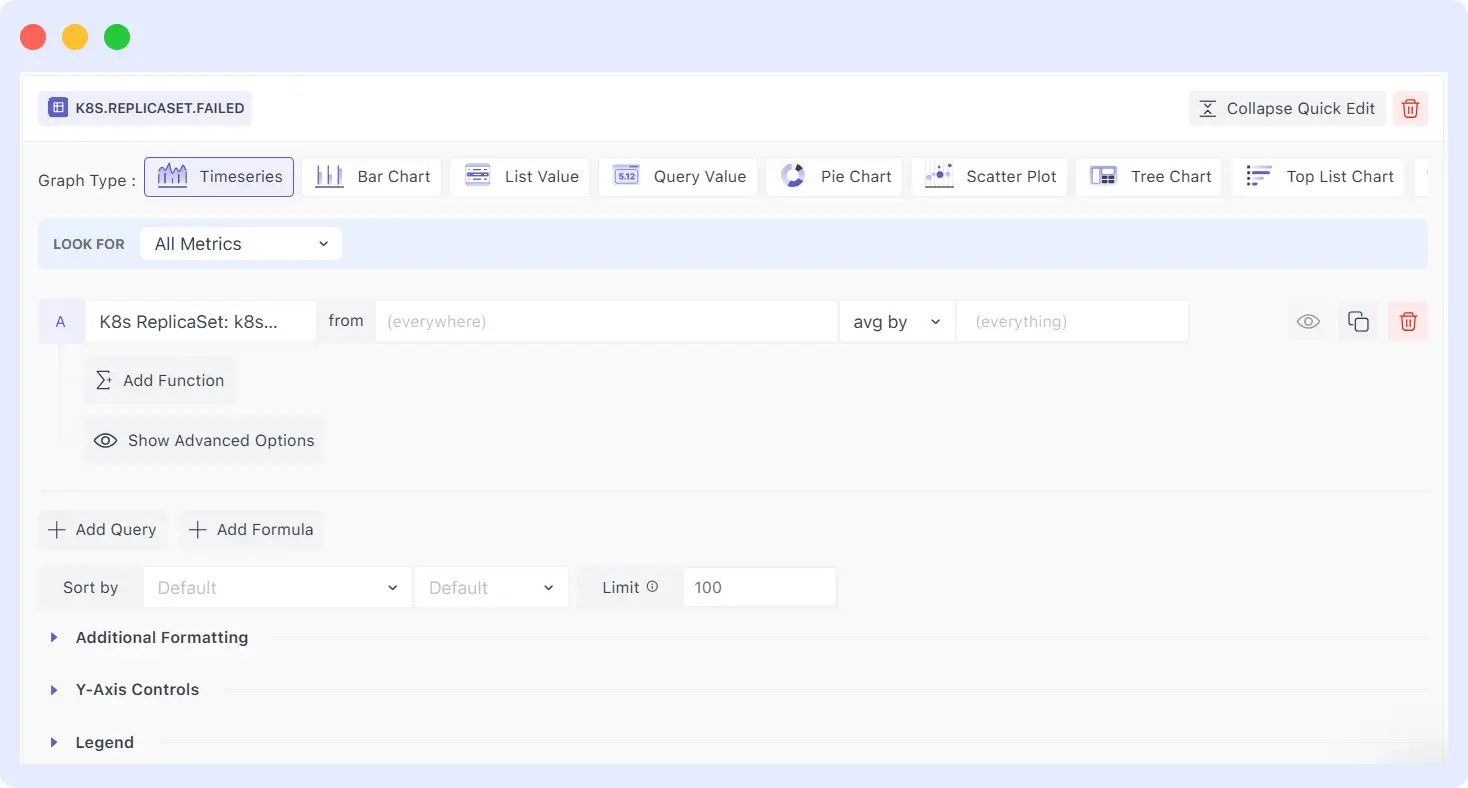
Each data source block includes an Expand Quick Edit option. This allows you to tune your investigation on the fly:
- Multi-Query Support: Add multiple queries (A, B, C…) in a single block to compare different data sets.
- Advanced Shaping: Apply functions, formulas, and aggregations (like uniq by or any by) to refine your results.
- Granular Control: Adjust Y-Axis controls, legends, and sorting to make your “evidence” as readable as possible.
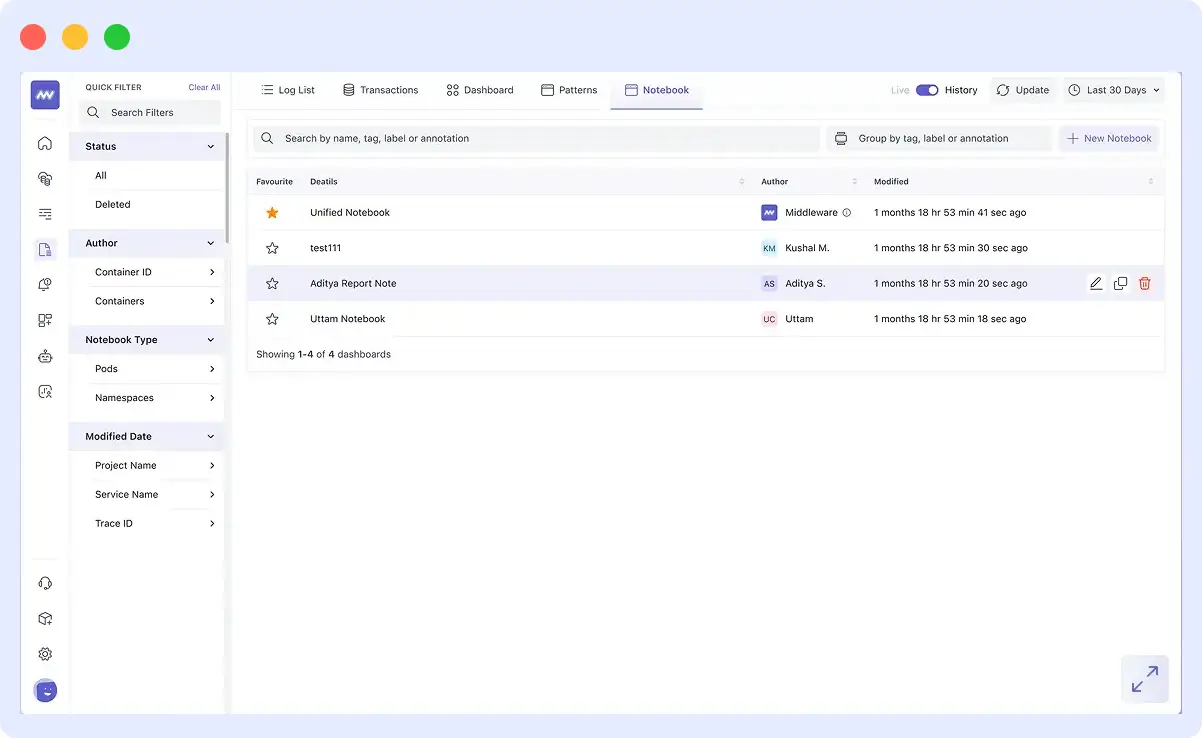
3. Access & Organization
Navigate to Logs → Notebooks from the top navigation. Here, you can manage your library of insights:
- Search & Star: Quickly find notebooks by name or “Star” favorites for instant access.
- Ownership Tracking: The list shows the Author and Date Modified, so you always know who has the most recent version.
- Automatic TOC: As you add H1 and H2 headings, a Table of Contents updates on the left so you can jump between sections easily.
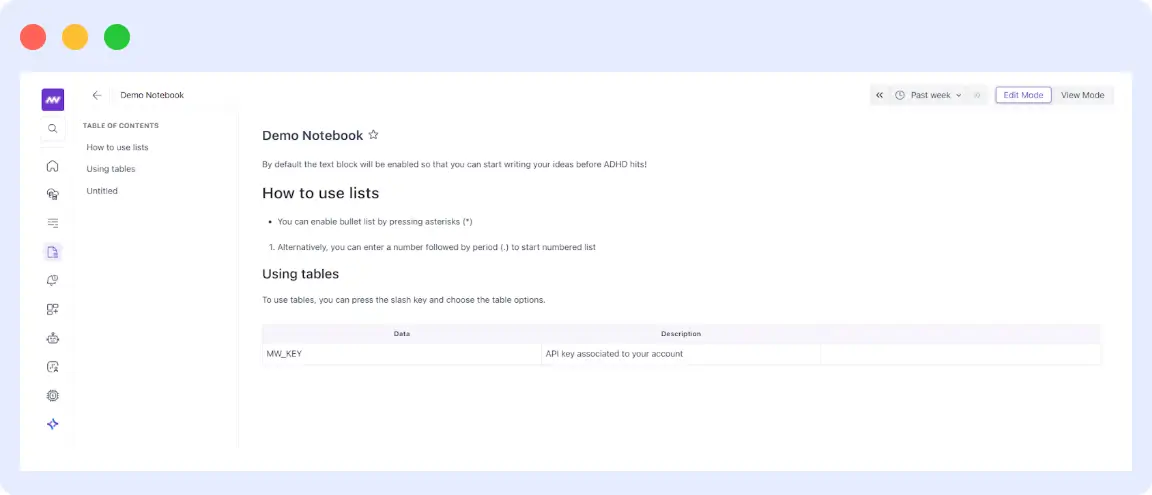
4. Write and Format Content
Notebooks support simple formatting to keep your notes readable without heavy markdown:
- Headings: Use H1 for main sections and H2 for sub-sections.
- Lists: Use bullet points for findings and numbered lists for sequences or runbooks.
- Tables: Insert tables (using the / command) for environment variables, endpoints, or incident timelines.
Where Notebooks Help the Most
1. Incident Investigation with Evidence Attached
When an outage occurs, your incident management workflow depends on fast, evidence-backed decisions. You form hypotheses and test them in real time. A Notebook gives you a natural place to capture that flow.
You can keep a short timeline, record what you checked, and attach live visuals from the data source to confirm what changed. This turns a frantic session into a record others can follow without repeating your steps.
2. Clean On-Call Handoffs
Handoffs fail when the next person gets a wall of text or a set of links without context. A Notebook keeps the narrative, the current status, and the supporting graphs together. The next engineer can scan the story, review the evidence, and continue from the last known state rather than starting from scratch.
3. Post-mortems That Are Faster to Write (and Trust)
Post-mortems are painful when you have to reconstruct everything days later. When a Notebook is used during the incident, the core details already exist. The narrative is written while the incident is fresh, and the charts used to confirm impact are already embedded. This makes the final RCA less about recollection and more about verifiable evidence.
4. Living Runbooks That Do Not Go Stale
Most runbooks fail because they become unreadable over time. A Notebook-style runbook includes explanations, steps, and live charts that confirm the expected healthy vs. unhealthy states. This keeps documentation practical and reduces uncertainty for new team members during stressful moments.
5. Support Escalations & Stakeholder Summaries
When a customer-facing issue happens, real user monitoring (RUM) data helps teams understand the impact faster. Leaders need a crisp summary. A Notebook can hold the symptoms, impact window, and evidence in one place. This reduces back-and-forth and keeps everyone from support to engineering aligned on what is known and what remains to be tested.
6. Weekly Ops Reviews & Reliability Updates
Stop wasting time on slide decks or screenshot collections. A Notebook makes reliability updates lighter by combining a short narrative with key charts and action items on a single page that can be shared and revisited.
Shared Narratives, Not Just Shared Links
The value of Notebooks compounds when they are shared. Sharing a dashboard link is useful, but it doesn’t explain the reasoning. Sharing a screenshot is quick, but it becomes stale. Sharing a Notebook gives your coworkers the narrative, timeline, and visuals in the exact order in which the investigation unfolded.
Stop Guessing. Start Documenting.
Middleware Notebooks turn “I think this happened” into “Here is the proof.” By combining the engineer’s narrative with the system’s evidence, we’re making incident response faster, clearer, and more human.
Ready to see it in action?
- Existing Customers: Click the Notebooks icon in your Middleware Topbar.
- New to Middleware? Stop chasing logs across tabs. Experience Middleware for free and see how Notebooks bring your entire team onto the same page.
- Join the Conversation: Connect with our engineering team in the Middleware Community Slack.