Ask any system administrator or network expert about downtime, and they will probably tell you that it is “everything that can go wrong in a system at the exact moment when it should function optimally.”
Since organizations today are highly reliant on technology and digital processes, there is a lot that can happen if the system fails, especially just minutes before an important event.
As per the Annual Outages Analysis Report 2023, 60% of organizations have faced some kind of outage or downtime in the past three years. For context, the cost of downtime is estimated to be around $9,000 per minute, with 98% of companies claiming that just an hour of downtime costs them roughly $100,000.
To combat downtime effectively, organizations rely on two key incident management KPIs: Mean Time to Repair (MTTR) and Mean Time to Detect (MTTD). While their acronyms may sound similar, their roles within the incident management life cycle are distinct.
MTTD is essentially the time it takes to detect an issue, while MTTR tells us how long it takes to repair it. These two metrics form the core of any incident management process.
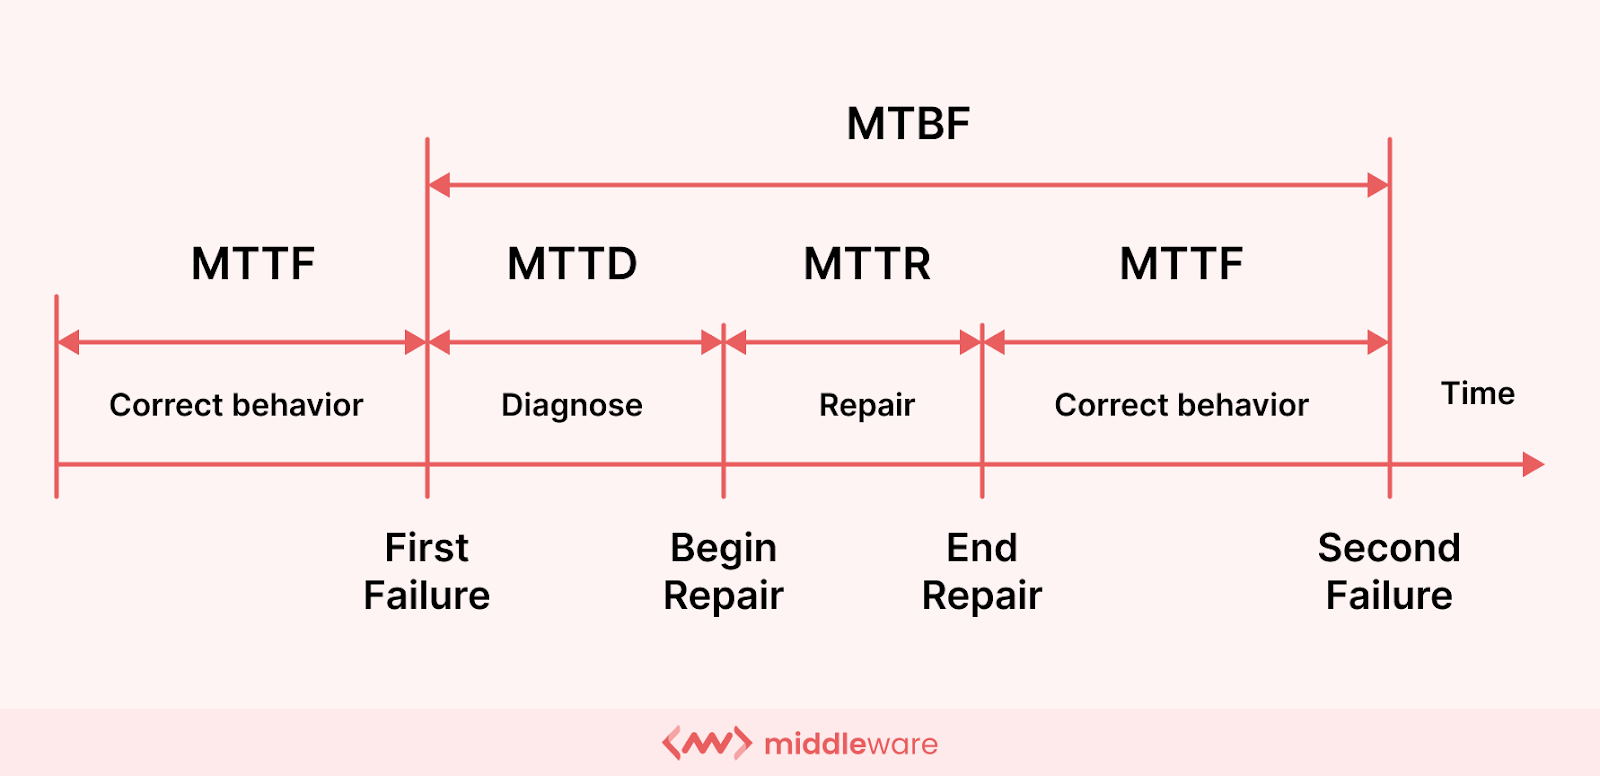
By utilizing these metrics strategically, organizations can identify and diagnose the root cause of any outage and decrease the time it takes to repair it. To understand this in-depth, let’s explore these metrics and the critical differences between MTTR and MTTD.
What is MTTD?
Let us start by understanding the first crucial KPI, Mean Time To Detect (MTTD). MTTD signifies the average time it takes to identify an incident after it has actually occurred in your IT infrastructure. It is calculated from the time the system experiences failure or outage and the time it takes to detect or fully diagnose the issue.
This metric essentially reflects the effectiveness of your monitoring and alerting systems in spotting issues before they snowball into major problems. A lower MTTD translates to faster issue detection, enabling your team to take swift action and minimize downtime.
To calculate MTTD, you can use the following formula:
MTTD = (the sum of all incident detection times) / (the total number of incidents reported in that time period)
For example, if the total number of incidents in a month is 5, and the total time to detect the incident is 251 minutes, the MTTD will be 251/5 = 50.2.
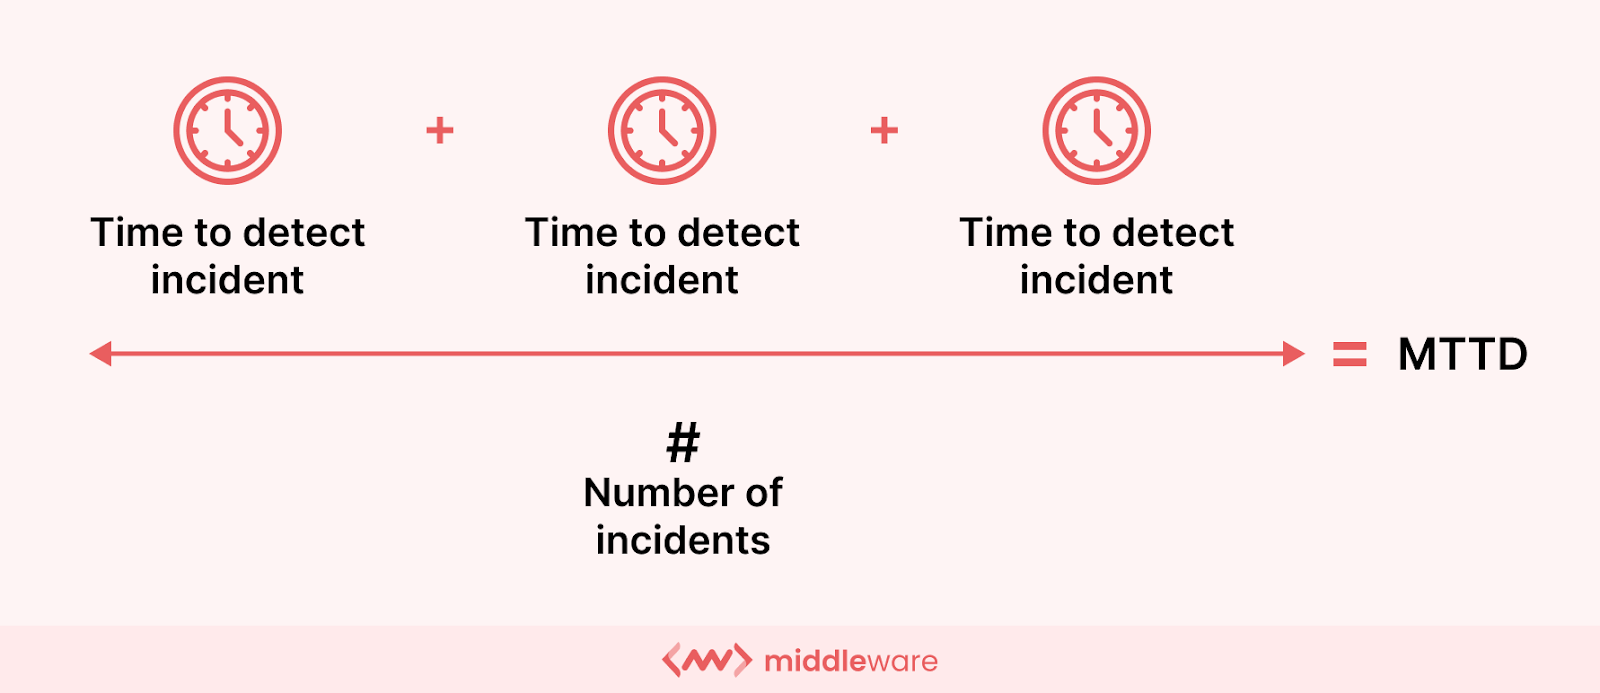
MTTD is crucial for incident detection and management and is influenced by the following factors:
- Monitoring capabilities: Comprehensive monitoring tools that capture a wide range of system metrics and logs are crucial for the early detection of anomalies.
- Alert configuration: Effectively configured alerts, with clear notification thresholds and appropriate channels, ensure timely awareness of potential issues.
- Data correlation: The ability to correlate data from various sources allows for a holistic view of system health and helps identify the root cause of problems faster.
By using a real-time and unified observability platform like Middleware, organizations can significantly reduce MTTD. This platform should centralize data collection from all your systems and applications, providing a single dashboard for monitoring systems. This helps you uncover potential threats and patterns before they can make a huge impact, even raising triggers to notify your team about suspicious activities or fluctuations.
Detecting incidents in time allows your incident management teams to resolve issues before they impact the business. Similarly, downtime can be detected in real-time and diagnosed faster.
What is MTTR?
Once an issue or downtime is effectively diagnosed, we come to the next crucial metric – the time it takes to repair or fix this issue. This is calculated using Mean Time to Repair (MTTR).
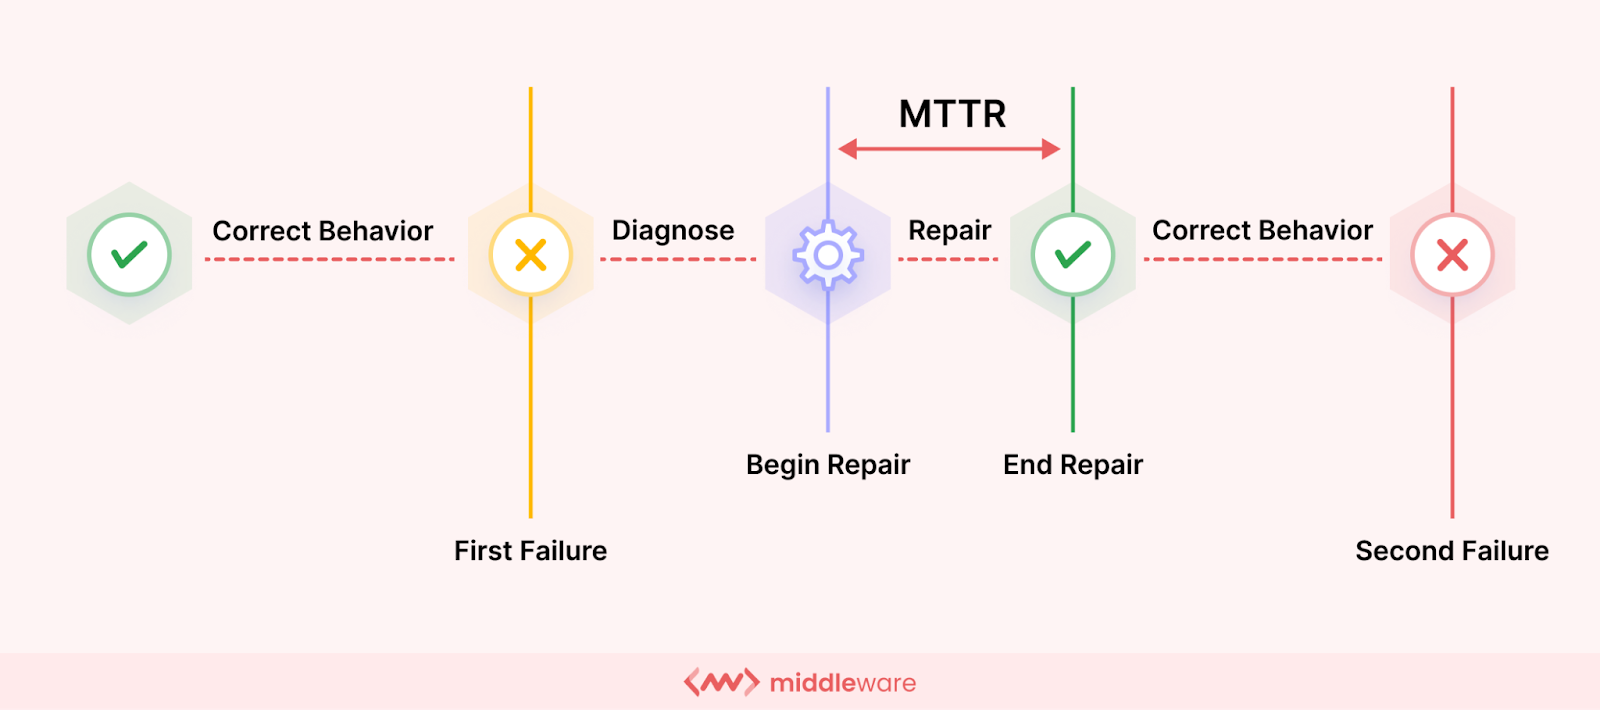
MTTR, also referred to as Mean Time to Resolve or Recover, measures the average time it takes to diagnose and fix an incident after it’s been discovered.
This metric essentially reflects the efficiency of your troubleshooting and resolution processes. A lower MTTR signifies a faster recovery time, minimizing the impact of downtime on your business operations.
It can be calculated using the formula:
MTTR = Total Time to Resolve All Incidents / Number of Incidents
Wherein,
- Total Time to Resolve All Incidents: This represents the cumulative time spent resolving all incidents within a specific timeframe (e.g., a week, month, or quarter).
- Number of Incidents: Refers to the total number of incidents encountered during the chosen timeframe.
The following factors influence MTTR:
- Technical complexity: Intricate system issues naturally take longer to diagnose and resolve compared to simpler ones.
- Team expertise: A skilled and experienced team can pinpoint and address problems faster than a team with limited knowledge.
- Availability of resources: The readily available tools and resources streamline the troubleshooting process.
- Standardized procedures: Clearly defined incident response protocols ensure efficient collaboration and minimize wasted time.
To reduce MTTR, organizations can invest in a proactive monitoring tool, which allows them to monitor all their IT infrastructure and identify potential threats before they escalate into significant issues.
If the issue cannot be diagnosed early on, the incident management teams can swing into action quickly and take appropriate steps to resolve or repair it before it makes a bigger impact.
By focusing on these aspects, organizations can significantly reduce MTTR and minimize the disruption caused by system outages.
MTTR vs MTTD: Which metric matters most?
In simple words, both matter! This is because both KPIs are essentially correlated. The faster your team can detect and diagnose an issue, the lower the MTTD. And by identifying issues faster with an accurate diagnosis, your teams can resolve them effectively, translating into improved MTTR.
Traditionally, reducing MTTR (Mean Time to Repair) and MTTD (Mean Time to Detect) has been a balancing act. Efforts to improve issue detection (MTTD) often relied on generating a high volume of alerts, which could overwhelm teams and slow down the resolution (MTTR) process.
However, Middleware’s innovative observability platform bridges this gap by offering a robust suite of features designed to tackle both metrics simultaneously.
How to reduce MTTR and MTTD using Middleware?
Here’s how Middleware empowers organizations to achieve a significant reduction in both MTTR and MTTD:
Unified dashboard
Middleware provides a central dashboard that offers a real-time, consolidated view of all your system metrics, logs, traces, and events. This eliminates the need to toggle between disparate tools, allowing your team to quickly identify anomalies and potential issues.
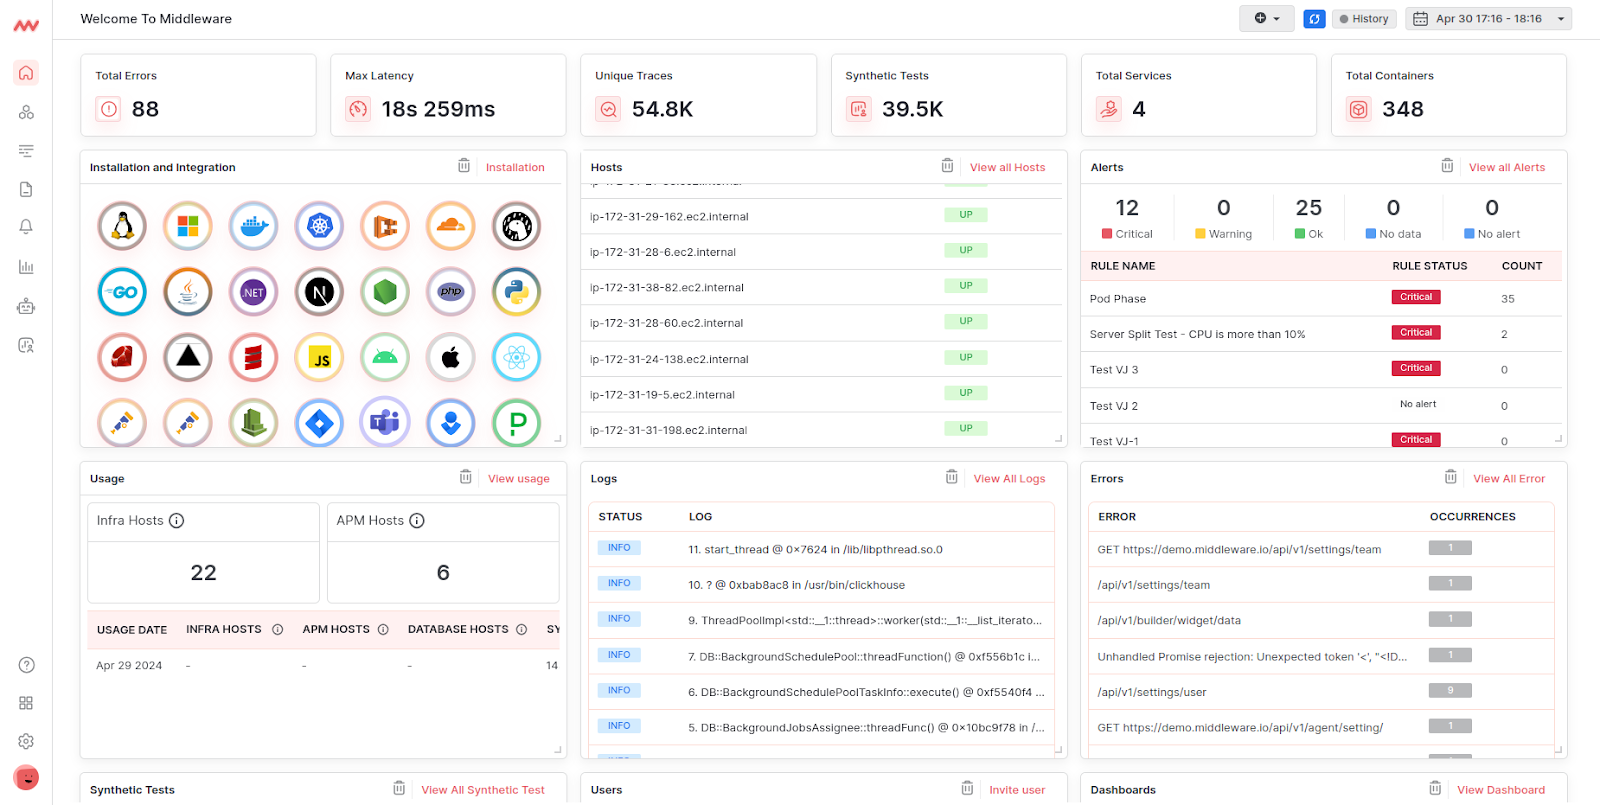
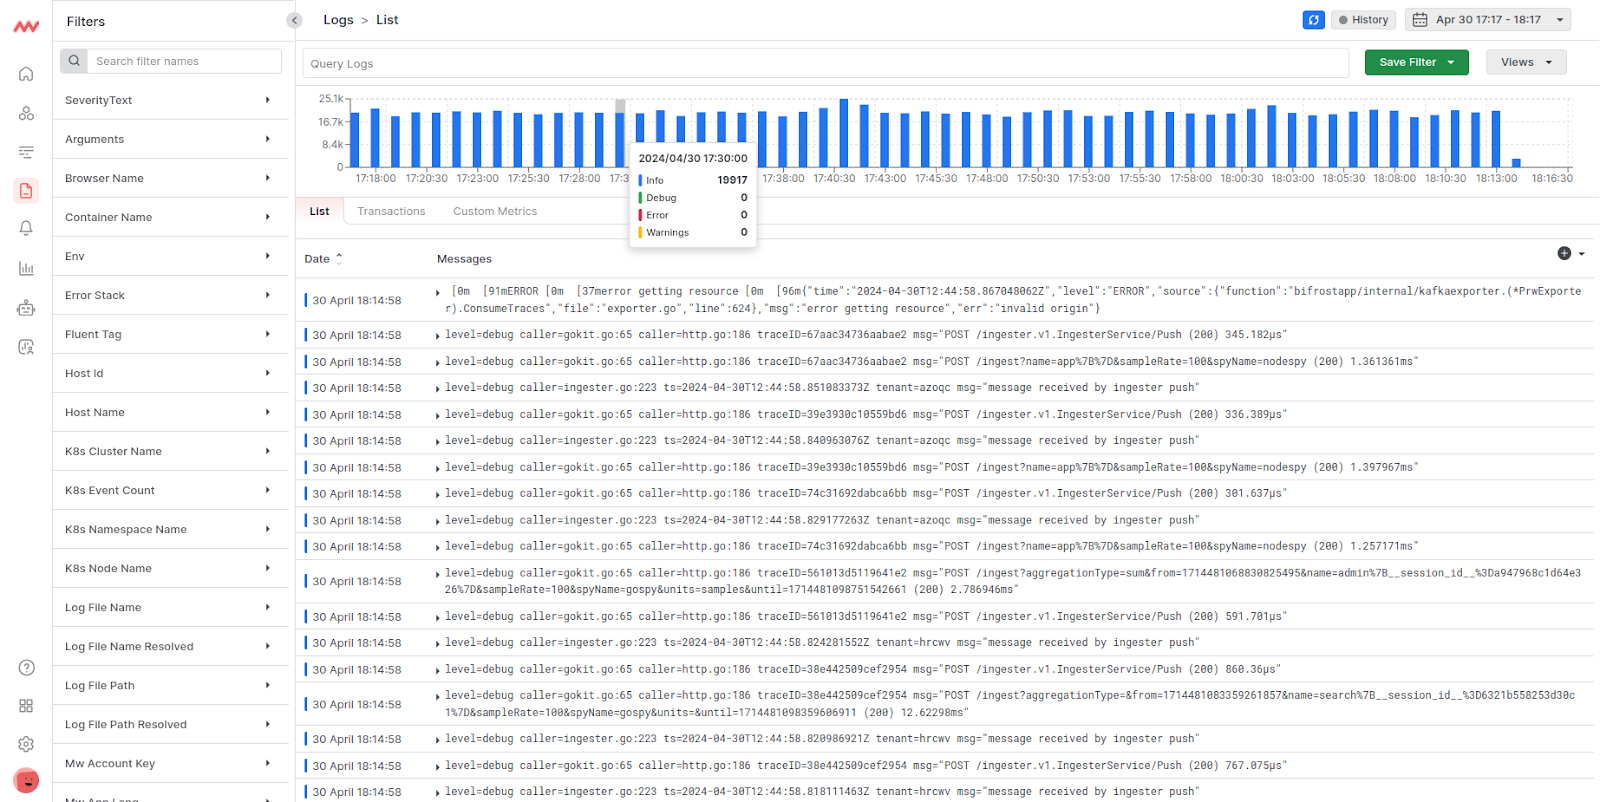
Logs and traces
Middleware empowers users to drill down into specific metrics and traces associated with an identified issue. This granular visibility allows for a deeper understanding of the problem and facilitates faster troubleshooting.
Real-time alert notifications
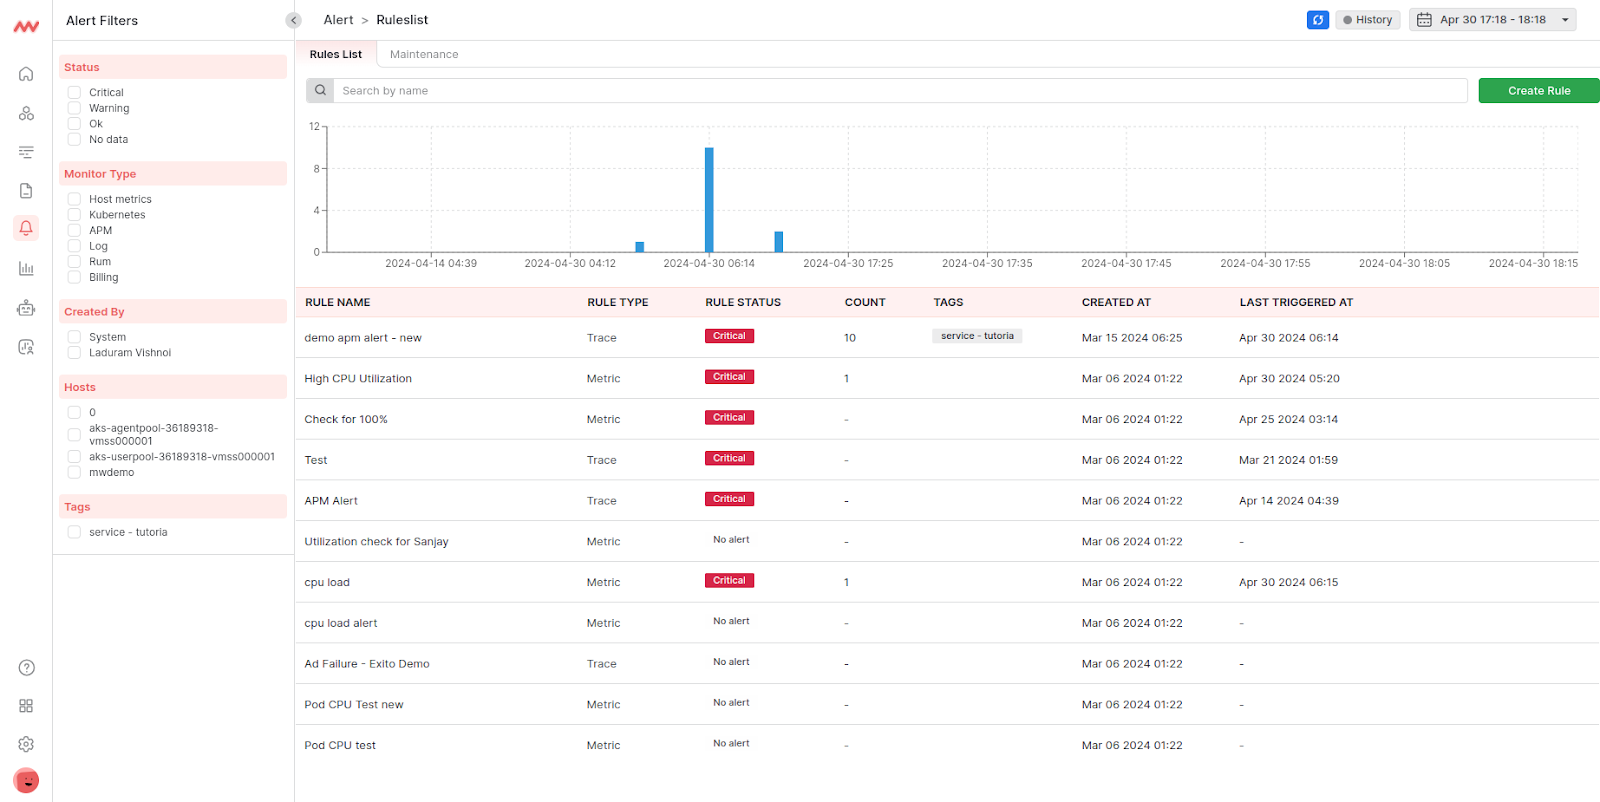
Middleware allows for the configuration of intelligent alerts that prioritize critical issues and provide context-rich notifications. This ensures your team receives actionable information, allowing them to focus on resolving the most impactful problems first.
Centralized knowledge base
Middleware facilitates the creation and maintenance of a centralized knowledge base where past incidents and their resolutions are documented. This empowers teams to learn from previous experiences and resolve similar issues faster in the future.
In essence, Middleware acts as a force multiplier for your IT team. The unified dashboard and advanced data correlation features empower faster issue detection (MTTD reduction).
Once an issue is identified, metric and trace analysis coupled with intelligent alerts streamline resolution (MTTR reduction). This holistic approach ensures your team is prepared to tackle any challenge that arises, minimizing downtime and maximizing system uptime.
Conclusion
Optimizing MTTR and MTTD is a continuous pursuit for any organization striving for optimal system performance. By understanding the nuances of these metrics and implementing the right strategies, you can significantly reduce downtime and ensure a more efficient incident response process.
End-to-end observability tools like Middleware don’t just offer a platform; they empower a proactive approach to system health. With its comprehensive observability features, Middleware equips your team to identify potential problems before they escalate into major incidents.
This proactive approach minimizes the impact of downtime and fosters a culture of continuous improvement within your IT operations.
Ready to unlock the power of faster issue detection and resolution?
Explore how Middleware’s observability platform can transform your incident response capabilities and ensure a seamless user experience.
