
To gather telemetry data in a secure, non-intrusive way from the entire system is something that has not been available in the past without many products, application-level agents, and very complex operations.
eBPF has been experiencing a lot of growth and interest from cloud-native and other modern infrastructure-focused communities in 2024 and will in 2025!
As the number of eBPF-based projects continues to crop up at a fast rate, some of the best software engineering companies in the world recently came together to form the eBPF Foundation, which is a cohort that steers and maintains the standards and vision for the technology.
Therefore, it’s quickly becoming an increasingly ubiquitous technology in the modern software infrastructure landscape. As things have since developed, one of the top use cases for eBPF is in the observability space.
This post will start by elaborating what eBPF is, how it works, why it’s so useful in distributed environments and its common use cases and then delve into eBPF observability.
What is eBPF?
At first glance, you may be wondering what eBPF stands for. Previously, eBPF was an acronym for Extended Berkley Packet Filter.
Today, as the official website shows, it’s no longer an acronym for anything but a standalone name. This is because its capabilities span well beyond the packet filtering that its previous name implied.
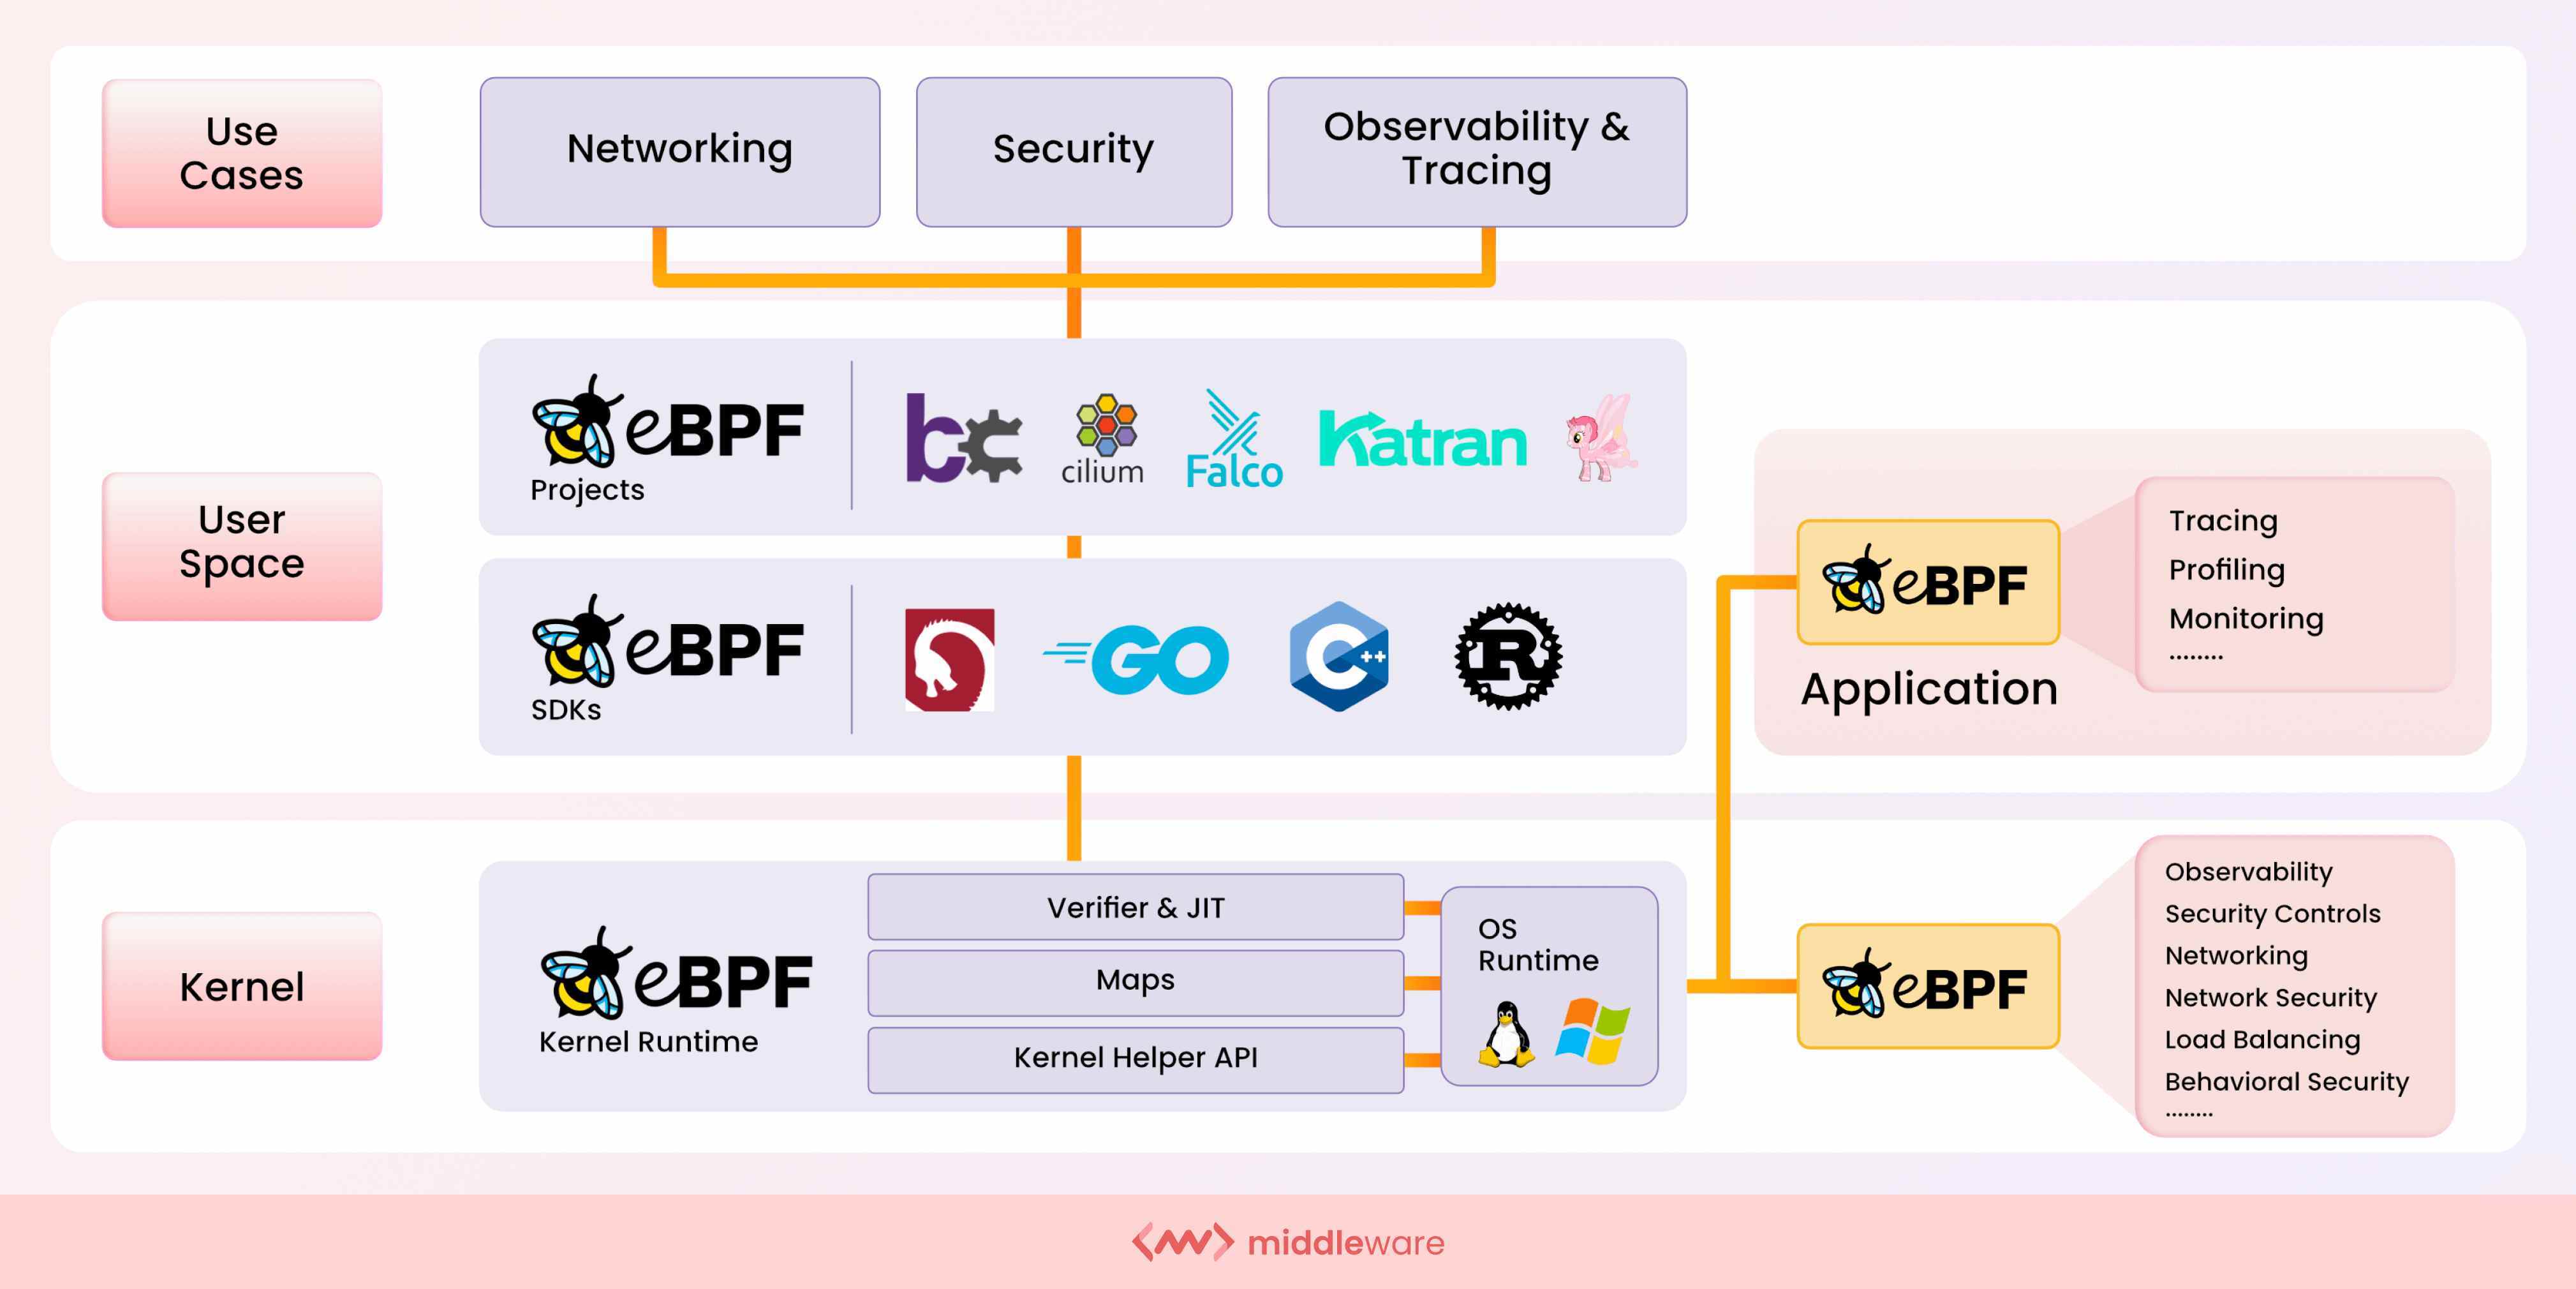
It’s a programming framework used to extend the capabilities of the OS kernel by loading and running programs that don’t modify the kernel’s source code or add additional modules. It was originally developed for Linux but now also has an implementation for Windows.
The operating system kernel is a critical component that provides stability and security for the entire system. As such, there’s no surprise that it may be seen as somewhat of a no-go zone because of the potential implications.
However, eBPF brings programmability to this particular space while offering the requisite isolation in the OS kernel. It’s lightweight and provides a sandbox environment within the kernel.
As a result, you can run programs that add to the OS at runtime with safe and efficient execution whilst leveraging specific resources in the kernel. What exactly would you want to add or apply to the OS kernel using eBPF? The next section will address this question by exploring the various use cases for eBPF.
Use Cases for eBPF
This section will focus on the key areas or domains where eBPF can be applied.
1. Networking
As you would expect, eBPF is especially useful for incorporating enhanced packet processing solutions into your systems’ networking domain. With eBPF, you can apply additional logic, policies, and protocols for your networking requirements by running eBPF programs that augment the networking process at a packet level.
In addition, eBPF can also be used to improve load balancing at a lower level than containers and network performance in network address translation (NAT).
2. Kubernetes Observability
Another key area where eBPF can be applied is observability. The Kubernetes architecture as a whole consists of multiple underlying components in both the control plane and the node components. Furthermore, these components orchestrate to run of container workloads.
In a nutshell, there are a number of critical moving pieces. As a result, visibility for security and performance is paramount. Using eBPF, you can gather deeper insight into occurring events as well as collect and aggregate custom metrics from a wide range of system sources.
Container attributes and cluster components can be closely monitored closely with detailed event capturing. This can be accomplished without incurring additional overhead to collect the desired data and level of visibility.
Performance visibility also varies by orchestrator compare Docker Swarm vs Kubernetes performance and architecture here.
3. Distributed Tracing
Kubernetes is widely used to run distributed container workloads at scale. This increases the complexity of tracking network requests traversing modern application systems. For both visibility and security purposes, it’s important for operators to trace events for unique requests at a detailed level. Running eBPF programs in the kernel and attaching them to kernel tracepoints enables teams to accomplish this.
4. Security
For enhanced security, we want to be able to closely monitor system events at the kernel level and leverage native capabilities for protective measures. However, this is too risky to implement with kernel modules because of the implications if something goes awry.
With eBPF, teams can capture the desired security observability events (i.e., system calls, file descriptors, socket connections, network sockets, etc.) using kernel-native technology to get container attributes and enforce network security policies.
What is eBPF Observability?
eBPF observability encompasses the light yet thorough implementation of programs designed to monitor events in the kernel. This is primarily carried out in Linux kernels. However, significant progress has been made with Windows, as pointed out earlier in this post.
As an observability tool, eBPF stands out because it can execute programs to exfiltrate monitoring data within the kernel without altering the source code.
Observability with eBPF is very secure, isolated, and non-obtrusive and can be exported to centralized platforms. It enhances observability by providing a great deal of visibility, context, and accuracy of infrastructure and network events. How does it work?
Typically, eBPF programs are either written in Rust or C. The just-in-time (JIT) compiler compiles, verifies, and loads the code into the kernel. After the program is loaded into the kernel, you have to attach it to kernel functions or events.
The eBPF programs will then run every time the respective function or event is executed. eBPF programs can be attached to events like tracepoints, entry to and exit from functions, perf events (used to collect performance data), the Linux Security Module (LSM) interface, network interfaces, network sockets, and more.
- Tracepoints – Tracepoints are lightweight hooks that can be used to call a function at runtime and are commonly used to account for tracing and performance in the kernel. eBPF programs can be attached to tracepoints to trace events like system calls.
- Entry to and exit from functions – Operators can attach eBPF programs to entry and exit functions so that their custom kernel programs run in the event of these respective scenarios.
- Perf events – As the name implies, this is a subsystem used to collect performance data. With eBPF, you can attach custom programs to where this data is collected.
- LSI module interface – This is a powerful module interface used by tools like AppArmor and SELinux. Both AppArmor and SELinux are commonly used in Kubernetes security techniques to apply low-level system measures to prevent and mitigate the risks of running container workloads. Similarly, eBPF programs can be attached to the LSI module interface checkpoints for runtime security with dynamic policies.
- Network interfaces (XDP) – The eXpress Data Path (XDP) allows operators to attach eBPF programs to network interfaces so that their custom programs are executed whenever a network packet is received.
Pros of eBPF for Observability
- Unintrusive – As detailed earlier, eBPF programs run in the kernel in a sandboxed environment similar to that of a VM. This provides sufficient isolation from the kernel itself and other modules.
- Secure – eBPF programs not only run in an isolated environment, but they also don’t require any altering of the kernel source code and have to go through a verification process by the JIT compiler before being loaded into the kernel.
- Centralized – eBPF programs provide finer granular details of events taking place in the kernel. This provides great insight into container and network activity and can be exported to centralized platforms for aggregation and visibility.
Cons of eBPF for Observability
- Market Adoption & Novelty – There is a lot of excitement and buzz around the technology, and the support from top tech companies has bolstered its case in the cloud-native space. However, it’s still relatively new and requires relatively advanced domain knowledge. As such, market adoption hasn’t been rapid.
- Linux Restrictions – Currently, eBPF is primarily used in Linux kernels. This presents a challenge for teams looking to adopt eBPF technology for Kubernetes and container workloads running with environments that aren’t Linux based. However, eBPF for Windows is under active development.
Who should go for eBPF Observability?
The adoption of eBPF in cloud-native apps is accelerating. As a result, the two situations where eBPF is most commonly required are as follows:
- When observability is required employing kernel tracing – eBPF is quicker and more precise in this case. Because eBPF applications are event-based and don’t use context switches, nothing happens without a specified trigger, and you won’t miss any occurrences.
- Traditional security monitoring is inefficient – Kubernetes and other distributed and container-based environments are big users of eBPF. In such environments, eBPF can narrow the visibility gap because it provides visibility into HTTP traffic.
You may also find eBPF deployed for other security measures, including:
- Network performance monitoring
- Firewalls
- And, device drivers
Best Practices for eBPF
- Compiling Code – Previously, assembling and compiling code for eBPF programs was very restricted and error-prone because of a lack of sufficient optimal tooling. Nowadays, eBPF programs can be compiled with the use of LLVM Clang.
- Writing Programs – To assist with writing optimal kernel programs for tracing and manipulation, you can use the BPF Compiler Collection (BCC) toolkit.
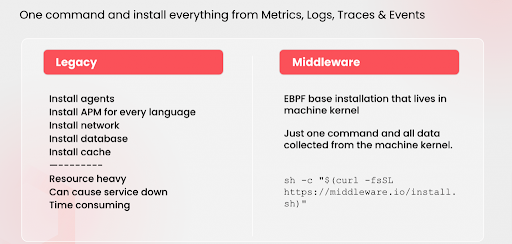
How Middleware uses eBPF
Middleware uses eBPF to provide in-depth data and insight into your infrastructure, container behavior, and network activity for better tracing and monitoring capabilities. With a simple installation command, Middleware allows you to execute an eBPF base installation to start collecting data from the system kernel.
The program installed in the kernel will monitor all the network traffic and activity that flows through the system. All hops will be detected, along with source and destination IP data, in order to provide accurate and real-time service maps.
This is what enables Middleware’s comprehensive tracing and allows you to have a full scope of monitoring. The agent exporting data to the Middleware platform is able to recognize various network protocol requests such as HTTP, gRPC calls, SQL queries, Kafka Calls, and more.
If you’re running fronted, backend, and database applications, you will be able to view a service map for the network flow. In addition, you can review and visualize the queries made from the backend to the database and any issues or occurrences in the flow of network traffic between the respective services.
Un-silo your complex data with Middleware to get unique Insights, traces and logs.
The Middleware agent converts the collected data into OpenTelemtry (OTel) format enabling teams to consume the data with a wide variety of tools that support OTel specifications.
Conclusion
eBPF is becoming a more widely accepted foundation for observability, feeding data to tools like Grafana, technologies in Kubernetes, and other systems, including those of many leading cloud providers.
If you’re interested in seeing how eBPF can enhance your observability, Middleware can help to achieve detailed, granular results for tracing and observability.
Schedule an eBPF observability demo with one of our experts today!
FAQs
How is eBPF different from BPF technology?
Extended Berkeley Packet Filter-eBPF is a modern version of Berkeley Packet Filter that increases its abilities and use cases.
- Traditional BPF programs can only be run in user space, whereas eBPF applications can be run safely inside the kernel.
- eBPF programs are more flexible since they can be coupled to different kinds of kernel events, not just network packets.
- eBPF programs can call into other eBPF programs and return values, enabling more complex logic.
- eBPF has a wider range of use cases, including tracing, security, and performance optimization.
- eBPF is available for Microsoft Windows.
Where is eBPF used?
eBPF programs access services and hardware from the Linux kernel area. These programs are used in tracing, debugging, firewalls, security, performance optimization, networking, and more.
Does Docker use eBPF?
Yes, Docker makes use of eBPF (extended Berkeley Packet Filter) in certain versions. Docker use of eBPF allows for improved networking, service discovery, and performance, as well as a better way to connect and manage containers.
However, running eBPF programs in Docker containers is not straightforward.
What is the key difference between eBPF and the kernel module?
eBPF is a more advanced and versatile technology than kernel modules. While kernel modules are typically used to add new functionality to the kernel, eBPF allows for more fine-grained control over kernel behavior.
Hence, can be used for a wide variety of tasks, from filtering packets to tracing system events.
Primary some key differences:
- eBPF is a virtual machine (VM) technology. Kernel modules, on the other hand, are pieces of code that can be loaded into the kernel
- Loading and removal of eBPF programs can be done dynamically while kernel modules can only be loaded or removed by modifying the running kernel and rebooting the system
- eBPF programs are executed inside the kernel and have a safer access to the kernel data. Kernel modules are executed directly in kernel space, so errors in kernel modules can cause system crashes or data corruption.
What are different eBPF tools available?
Few eBPF tools adopted by the Cloud Native Computing Foundation are:
- Falco
- Inspektor Gadget
- Cilium
- Hubble