
Have you ever experienced an extreme computational load on your Linux server? CPU (Central Processing Unit) overload occurs when the processor reaches its maximum capacity due to excessive workload, making it unable to handle new tasks efficiently.
Several factors can contribute to high CPU usage, including misconfigured applications, unoptimized processes, malicious activity, or background tasks consuming excessive resources. If not addressed, this can lead to system lags, request freezes, and application crashes.
To prevent CPU overload and ensure smooth server performance, it’s essential to monitor resource consumption, optimize processes, and eliminate unnecessary tasks. Overheating and excessive CPU usage can significantly degrade performance, causing high CPU usage issues that impact productivity and user experience.
In this guide, we’ll explore how to lower CPU usage and implement best practices to maintain an optimized server environment.
What is CPU overload?
CPU overload occurs when CPU resources are stretched beyond their limits, causing critical processes to slow down and the system to become unresponsive. A slow server, delayed responses, and unexpected crashes are every system administrator’s nightmare.
But what if you could identify the warning signs before your server becomes unmanageable?
By understanding how the Linux kernel manages CPU resources, you can detect high CPU usage early, prevent CPU overload, and take proactive measures to lower CPU usage before performance issues escalate into critical failures.
How Does the Linux Kernel Manage CPU Resources?
To prevent CPU overload, it’s essential to understand how the Linux kernel manages CPU resources and identify common causes behind high CPU usage. By implementing CPU optimization strategies, you can lower CPU usage and improve system performance.
The Linux kernel prioritizes tasks, allocates processing time, and maintains a balance between throughput and responsiveness. When resources are limited, it uses time-slicing and preemption to ensure that critical processes run smoothly.
Additionally, built-in load-balancing mechanisms help distribute workloads efficiently, reducing CPU bottlenecks and minimizing performance degradation. By leveraging these kernel-level optimizations, you can enhance system stability and efficiency.
Common Causes of High CPU Usage
Several factors affect high CPU usage, and understanding these common factors is essential to optimizing CPU resources and ensuring smooth server operations. Knowing how to lower CPU usage can help mitigate performance bottlenecks and enhance system efficiency. Common causes of high CPU usage include:
Resource Heavy Applications
Certain applications, such as virtual machines, database servers, and analytical tools, require high processing power, memory, and network bandwidth to function efficiently. These resource-intensive applications can significantly impact CPU usage, leading to potential performance bottlenecks.
If these applications are not properly configured and optimized, they may consume excessive CPU resources, resulting in server slowdowns, increased CPU load, and performance degradation.
Unoptimized Background Services
Multiple high resource-consuming processes run in the background of the server, which affects performance. Individually, each process may not seem threatening, but collectively, processes such as logging, daemon, and automated scripts can drain CPU resources and increase CPU usage, leading to CPU overload and reducing system efficiency.
Server default configurations are not specialized for a particular purpose and depend on a variety of hardware setups. Therefore, numerous services and applications may compete for CPU, memory, and disk resources, which can result in high CPU usage.
This performance degradation may slow down the server responsiveness. Regular service audits and optimization strategies can help lower CPU usage, prevent CPU overload, and free up resources for critical tasks.
Memory Leaks Leading to Excessive CPU Utilization
When a process or service doesn’t release memory properly and allocates continuously, it leads to excessive memory consumption and in turn, memory leaks occur. Over time, when memory is never released, this forces the system to work harder and increases the CPU load.
Regular infrastructure monitoring and debugging are essential to identify memory leaks and fix them before they encounter any resource bottlenecks. Without implementing these techniques, high-resource usage applications can consume excessive memory and lead to CPU overload.
Malicious Activities (DDoS attacks, Crypto-Mining Malware)
Malicious activities like DDoS attacks and crypto-mining malware hijack the server resources. DDoS attacks flood the system with multiple processing requests while mining malware hijacks CPU cycles.
Attackers identify vulnerabilities to execute malicious activities in the background. As a result, they rapidly drain computing power and slow down legitimate applications.
5 Ways to Prevent CPU Overload on Linux Servers
Now that you know about the various reasons for CPU overload, this is time to check some of the ways to prevent this overload on Linux servers.
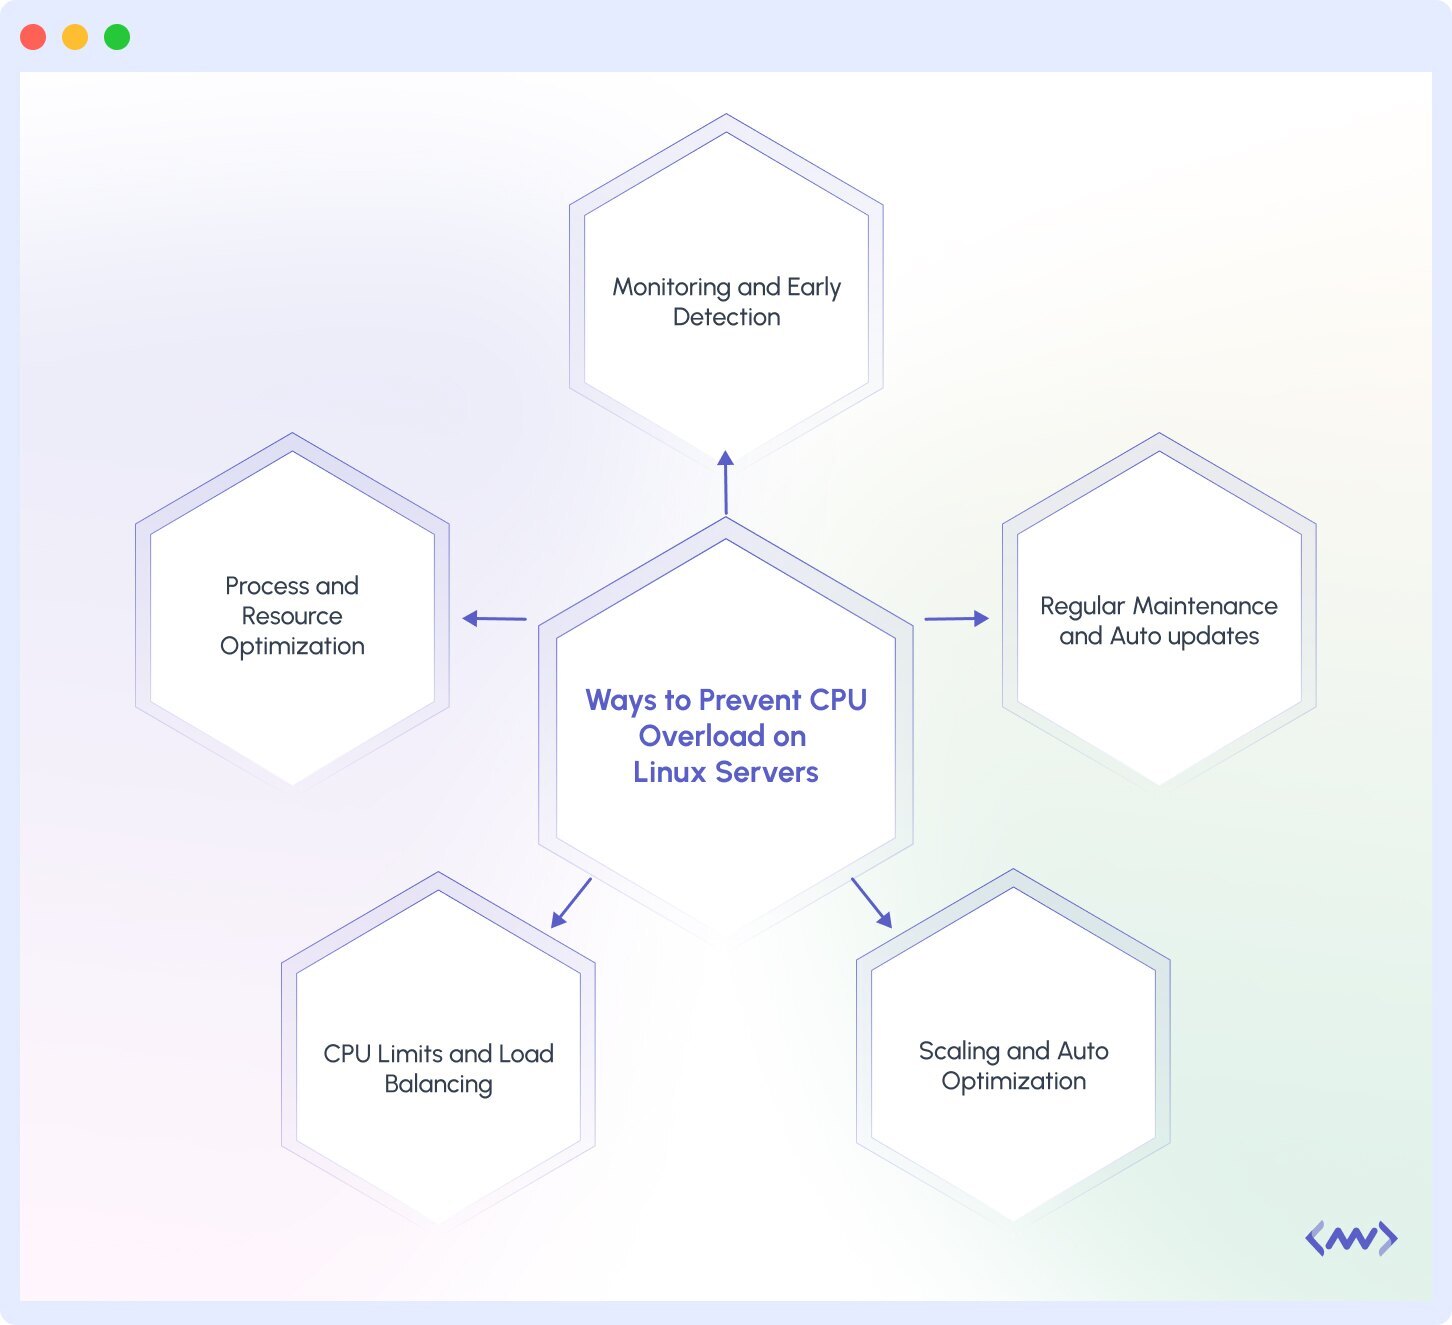
1. Monitoring and Early Detection
Monitoring CPU usage is the first step to prevent CPU overload. It helps to detect issues before they escalate. And, it requires the right system monitoring tools and proactive management.
Using Linux Utilities to track CPU usage
Linux utilities top, htop, iostat, mpstat, and vmstat provide real-time insight into CPU usage. Where top and htop, these two utilities show you real-time process activity, and system health, mpstat focuses on CPU metrics, helping you to identify resource-heavy applications.
Utilities like iostat and vmstat help you to identify when disk or memory issues might be cascading into CPU problems.
# Monitor real-time process activity and system health
top
htop

# Track CPU metrics to identify resource-heavy applications
mpstat

# Monitor I/O performance to detect disk-related CPU bottlenecks
iostat

# Monitor memory, CPU, and system processes to identify performance issues vmstat
Setting up real-time monitoring
The combination of Prometheus and Grafana allows you to collect detailed system metrics and visualize CPU performance.
- Setting up Prometheus paired with the Grafana dashboard gives you powerful visualization over time, helping you in proactive load management.
- This open-source combo requires significant resources and expertise to maintain the monitoring infrastructure itself.
- Prometheus and Grafana help to spot gradual degradation patterns that basic tools might miss.
Steps to set up the Prometheus + Grafana
- Install the Prometheus server to gather time-series metrics
- Set up Prometheus exporters and targets
- In the Prometheus configuration file, set the proper alerting rules, retention policies, and scrape intervals.
- To build visualizations, install Grafana and connect it to your Prometheus data source.
- Create Grafana dashboards to display metrics, establish thresholds, and track system health in real-time.
Tracking system metrics with Prometheus and Grafana, on the other hand, requires a lot of time and effort to set up and then maintain. With Middleware, setting up real-time monitoring is straightforward as tracking system performance on the platform is quite simple.
“I don’t want my developers to stay up all night to try to fix issues. That’s a waste of everyone’s time. Middleware helped us become faster. It saves at least one hour of my time every day, which I can dedicate to something else”
Akshat Gupta, Trademarkia
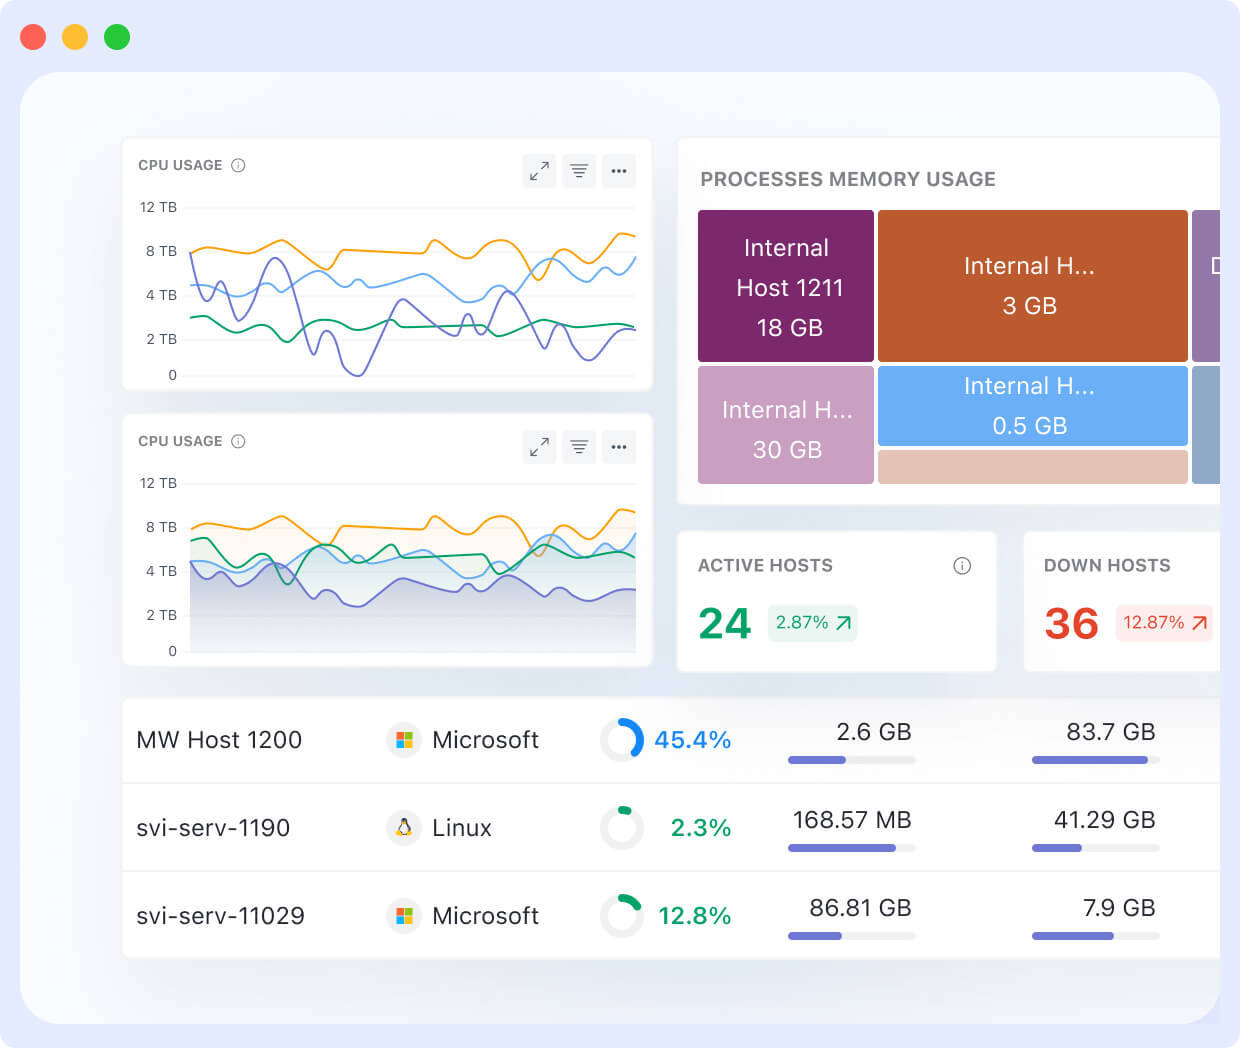
Just sign up and see everything in action. Middleware simplifies CPU monitoring and management with powerful features that can prevent system slowdowns and crashes.
- CPU Usage Tracking: Middleware provides end-to-end visibility into your system’s health, helping to prevent CPU overload and lower CPU usage effectively.
- You can get a list of all hosts running inside your infrastructure with key metrics like CPU utilization, memory utilization, and resource status.
- With real-time monitoring, you receive continuous updates on infrastructure performance metrics, allowing you to identify and mitigate high CPU consumption issues.
- The best part about Middleware is that you can get a look at tens of thousands of infrastructure metrics at once without fail.
- Historical Data Trend Analysis: Middleware stores historical performance data, enabling users to analyze CPU usage trends over time.
- This helps predict potential CPU overload, optimize resource allocation, and implement proactive performance tuning.
- Middleware also utilizes anomaly detection and machine learning algorithms to detect irregular CPU spikes, preventing potential system failures.
- Real-time Alerts and Notifications: Middleware continuously tracks CPU usage and can send instant notifications when resource consumption goes beyond a predefined threshold.
- Beyond just CPU monitoring, you can configure custom alerts for any performance metric within your infrastructure.
- This ensures system administrators can take preventive actions before the server performance degrades, minimizing downtime and maintaining optimal CPU efficiency.
Some of the common use cases where Middleware shines are as follows:
- Web Applications: You can detect sudden CPU spikes caused by increased traffic and take action before response times degrade.
- Database Performance: You can identify and resolve CPU-intensive queries or background jobs that can slow down your database performance.
- Microservices and Containers: You can also monitor CPU usage across distributed environments and make sure that no single container is consuming excessive resources.
Middleware has a distinct advantage over the competition by providing complete infrastructure monitoring services with the bare minimum resource overhead. This allows the tool to be an ideal solution for teams looking to improve observability without losing out on system performance.
Monitoring is just not enough to prevent CPU overload. Additionally, setting up proper alerting mechanisms can catch problems early. Alerting mechanisms include email or Slack to notify you when CPU usage crosses a critical threshold, ensuring immediate action can be taken.
2. Process and Resource Optimization
Process and resource optimization refers to the systematic improvement of how processes run and utilize available system resources. It involves fine-tuning how individual processes and services operate on your system.
Adjusting process priorities using nice and renice
The overall performance of the system can be significantly enhanced by adjusting priorities to a process. The nice and renice command helps you to adjust priorities.
The nice command allows you to launch a new process with priority level, while renice modifies existing ones. For critical applications, setting up higher priorities to ensure they maintain responsiveness even under heavy load is considered.
# Start a new process with a specified priority
nice -n 10 <command>

# Change the priority of an existing process
renice 5 -p <PID>

# Example: Increase priority for a critical application
sudo renice -10 -p <PID>

# Example: Start a new process with lower priority to reduce system load nice -n 19 <command>
Using taskset and schedtool to bind processes to specific CPU cores
When dealing with multi-core systems, techniques like taskset and schedtool help you to distribute CPU load more efficiently. Tools like these prevent the single core from getting overwhelmed.
These techniques bind specific processes to individual CPU cores. This prevents the kernel scheduler from bouncing processes between cores, reducing cache misses and context-switching overhead.
This is effective for workloads with high cache dependency or when isolating performance-critical services from general system tasks.
# Bind a process to specific CPU cores using taskset
taskset -c 0,2 <command>  	# Runs the command on CPU cores 0 and 2
taskset -cp 1 <PID>       	# Assigns an existing process to CPU core 1

# Bind a process to specific CPU cores using schedtool
schedtool -a 0x3 -e <command> # Runs the command on CPU cores 0 and 1 (0x3 = binary 11)
schedtool -a 0x4 -p <PID> 	# Assigns an existing process to CPU core 2 (0x4 = binary 100)
Managing system services with systemctl disable for unnecessary background tasks
Many background services, some of which are unnecessary, use the CPU without adding value. Unnecessary services are a major contributor to CPU strain. Use the systemctl disable utility to turn off unnecessary services.
This will stop the printing service from starting up, which means it won’t consume CPU cycles on servers that don’t need printing capabilities. This not only reclaims CPU cycles, but often reduces the memory footprint and improves startup times as well.
# Disable unnecessary background services to reduce CPU load
sudo systemctl disable <service_name>

# Example: Disable the printing service to save resources on non-printing servers
sudo systemctl disable cups

# Stop the service immediately without reboot
sudo systemctl stop <service_name>

# Verify the status of a service
systemctl status <service_name>
3. CPU Limits and Load Balancing
Managing CPU usage effectively ensures system stability and prevents any single process from causing CPU overload. Efficient load balancing across CPU cores or multiple Linux servers improves performance optimization and system responsiveness under varying workloads. Let’s explore some methods for process capping, and load balancing strategies with HAProxy, Nginx, or Apache.
Implementing cgroups to restrict CPU usage for certain processes
Control groups(cgroups) allow you to limit CPU usage for specific processes. It provides a powerful way to establish resource limits for applications or users. Also, it enforces actual CPU restrictions. They ensure that no single application can monopolize system resources.
Using cpulimit to cap CPU-intensive applications
This tool helps cap CPU-intensive applications, preventing them from consuming excessive CPU power. This lightweight tool caps specific processes to a defined percentage of CPU usage. This is ideal for carrying out resource-intensive batch operations without affecting vital services, such as backups or analytics procedures.
Load balancing across multiple CPU cores or servers using HAProxy, Nginx, or Apache
Appropriate load balancing is crucial when one server reaches its limit. Excellent HTTP load balancing with low overhead is provided by Nginx, while TCP-level distribution is best served by tools like HAProxy.
Workloads can be divided among several CPU cores or even servers to help manage traffic effectively and avoid bottlenecks. Apache with mod_proxy offers extensive customization options and flexible balancing for complex applications.
Selecting the appropriate algorithm is crucial; round-robin works for identical servers, but least-connections or IP hash techniques are better suited for different workloads or session persistence needs.
4. Scaling and Auto-Optimization
Scaling ensures that systems can handle increased workloads by dynamically adjusting resources. Auto-optimization techniques enhance efficiency by automating resource allocation based on demand. Let’s explore methods like horizontal and vertical scaling, autoscaling with Kubernetes, and performance tuning strategies.
Implementing autoscaling in cloud environments (AWS, GCP, Azure)
Cloud environments offer unparalleled flexibility in handling varying workloads. The autoscaling features of AWS, GCP, and Azure cloud platforms prevent overload during peak hours by dynamically modifying CPU resources in response to workload demand.
Set up scaling rules based on CPU usage; these typically initiate new instances when usage briefly exceeds 70–80%. This prevents performance degradation during traffic spikes and avoids unnecessary expenses during slow times.
Using container orchestration (Kubernetes, Docker Swarm) to distribute workloads dynamically
Container orchestration is the true source of modern infrastructure’s power. By distributing workloads among several containers, these tools maximize CPU utilization without the need for human intervention.
Based on resource availability and specified constraints, it redistributes your application containers throughout your cluster while continuously monitoring containers.
5. Regular Maintenance and System Updates
Keeping systems updated and well-maintained prevents security vulnerabilities and ensures optimal performance. Regular patching, log monitoring, and performance tuning help maintain system stability.
Keeping Linux kernel and software updated for performance improvements
Maintaining optimal CPU performance requires updating your Linux kernel and core packages. Each kernel release includes bug fixes, scheduler improvements, and often noticeable performance increases for specific workloads.
Make it a practice to review release notes for updates relevant to your use case Sometimes, it’s a simple kernel parameter change that can solve persistent CPU issues that no amount of application tuning can resolve.
Automating system updates and security patches with unattended-upgrades
Use tools like unattended-upgrades to automate system updates and ensure that security patches and performance improvements are consistently applied. Configure the tool to handle routine updates automatically and notify administrators of important changes that require human involvement.
A balanced strategy ensures security without increasing the possibility of unscheduled outages brought on by potentially harmful changes to crucial system components.
Scheduled log audits to detect and prevent CPU resource leaks
System logs should be regularly reviewed to identify inefficiencies, rogue processes, and CPU resource leaks that might otherwise go undetected. Examine application and system logs once a week for odd patterns and recurring errors that could point to ineffective procedures.
Applications that repeatedly restart or use more resources over time are classic indicators of memory leaks that eventually lead to CPU issues, and tools like log rotation, when paired with basic grep scripts, can help find them.
This proactive approach frequently identifies problems weeks before performance monitoring alone would.
Conclusion
Utilize tools such as top, htop, and specialized monitoring platforms to closely monitor system resources to spot issues early. Bind critical apps to specific cores and use nice/renice to adjust priorities to streamline processes. Implement resource limits using cgroups and cpulimit to prevent any one process from monopolizing CPU resources.
However, manual monitoring and intervention can be time-consuming and inefficient. This is where Middleware comes in with features like real-time alerts, CPU usage tracking, and historical trends analysis, Middleware provides an automated approach to system monitoring. Ultimately, it detects CPU spikes early, optimizes resource allocation, and prevents unexpected slowdowns or crashes.


