
I’m sure, as an engineer, there’s no bigger nightmare than a production outage at 3 AM. We live in a world where software is becoming more complex by the minute. From distributed architectures to container orchestration and microservices, an observability tool is a must-have digital vigilante for your system and infrastructure.
Prometheus is a powerful open-source monitoring tool that enables system administrators and engineers to collect useful data points about their system’s health and performance.
These data points or metrics are called Prometheus metrics, help in tracking resource utilization, identifying system bottlenecks, and ensuring smooth operations. If you’re wondering what is Prometheus metric, it is essentially a time-series data point that represents system behavior over time.
In this guide, we’ll unravel how Prometheus metrics provide visibility into your systems. By the end of this post, you’ll have everything under your belt to make the most of Prometheus metrics.
What Are Prometheus Metrics?
Prometheus collects data points that represent the behavior and performance of your application or infrastructure. These data points, also known as Prometheus metrics, are stored in a Prometheus metrics format, which follows a structured approach to time-series data.
For instance, a data point that measures your server’s CPU consumption, the number of requests your service receives, or the average response time of your server are all examples of Prometheus metrics.
Let’s look at a Prometheus metrics example to understand how these metrics work in real-time monitoring. Consider CPU usage and average response time for a web server:
CPU usage:
– 10:00:00 AM: 45% utilization
– 10:00:15 AM: 48% utilization
– 10:00:30 AM: 73% utilization (sudden spike)
Average response time:
– 10:00:00 AM: 85 ms
– 10:00:15 AM: 90 ms
– 10:00:30 AM: 250 ms
Prometheus stores metrics as time-series data in a structured Prometheus metrics format, allowing engineers to query, visualize, and analyze them to identify performance trends.
You can effectively monitor system health and make data-driven decisions by understanding different Prometheus metrics types, such as counters, gauges, histograms, and summaries.
For instance, in the above example, the time-series data can be used to visualize the correlation between increased request rate and the CPU/memory spikes. We see that there was a sudden spike that happened at 10:00:30 AM, so Prometheus can also send alerts for visibility.
Understanding Prometheus Metrics Types and Their Role
Before we dive deeper into each metric type and their role, let’s first understand some key concepts related to Prometheus metrics.
1. Labels
Labels are key-value pairs that give dimension to the metrics like instance, method, service, etc.
For instance, a metric like http_requests_total might include labels such as method="POST", service="checkout", and instance="server-1".
If you wish to query metrics specifically for your checkout service, you can do so using a label selector in PromQL:
http_requests_total{service="checkout"}These queries fetch data from the Prometheus metrics endpoint, which serves the latest metric values collected from various services. The Prometheus metrics endpoint allows tools like Grafana and Middleware to retrieve metrics in real time for visualization and alerting.
2. Metric Name and Value
The name of a metric describes what the metric represents, whereas the value is the actual data point associated with that metric. For instance, a metric used to represent CPU usage is called
cpu_usage_seconds_total, which tells you how many seconds the CPU has been used in total.
For instance, if the cpu_usage_seconds_total metric has a value of 450 for instance="server-2". This means that your server-2’s CPU has been used for 450 seconds since last it was started or reset.
Also, with PromQL, you can query the rate of change for this metric.
rate(cpu_usage_seconds_total{instance="server-2"}[5m])The result of the above query tells you how fast your CPU usage has increased in the last 5 minutes. You can check the same for any specified period. You can use this information to decide if you need to scale up resources.
For example, a value of 0.75 or higher may indicate a significant spike in CPU usage that you may need to address.
3. Prometheus Metric Types
We’ve seen earlier the four core metrics that Prometheus provides, but let’s examine them more thoroughly.
Counters
A counter metric, as the name suggests, is a metric that counts or cumulates the value. It only gets incremented or reset to 0. You can use counter metrics to track the number of requests a service has handled, tasks a job has completed, the number of errors or crashes a system has encountered, etc.
For instance, you could have a counter metric requests_total. When its value changes from 100 to 150, we know there have been 50 new requests since the last measurement.
Using PromQL, we can also get a _rate_ of requests over time as shown below:
rate(requests_total[5m])Gauges
To track values that can fluctuate over time, a gauge metric is used. It can increase in value, or go down/decrease in value. You can use a gauge to measure how much memory is used or the number of active sessions for your users.
For instance, consider a gauge metric called memory_usage_bytes . If it has a value of 2,147,483,648 it means that 2GB of memory has been consumed up to that point.
Histograms
Let’s say you want to understand how quick or slow your application appears to your users. Measuring response time would be helpful here. However, not every user may get the same response time. So it may be more helpful to get a range of response times, say from 20ms to 1000ms.
To get a clearer picture, you might want to see these response times sorted with a count telling you how many requests fall into each category.
| Response Time20ms | Count150 |
| 50ms | 200 |
| 100ms | 400 |
| 500ms | 150 |
Histograms in Prometheus are like organized bucket systems that help you understand how long things take or how big things are.
A histogram metric might look like this (in a simplified text format):
# HELP request_duration_seconds Request duration in seconds
    # TYPE request_duration_seconds histogram
    request_duration_seconds_bucket{le="0.05"} 240
    request_duration_seconds_bucket{le="0.1"} 638
    request_duration_seconds_bucket{le="0.2"} 912
    request_duration_seconds_bucket{le="0.5"} 980
    request_duration_seconds_bucket{le="1"} 995
    request_duration_seconds_bucket{le="+Inf"} 1000
    request_duration_seconds_sum 123
    request_duration_seconds_count 1000
From this data, you can calculate the distribution of request durations. Some useful features of Histograms are statistics like median response time (50th percentile) and 90th percentile (the time below which 90% of your requests are completed) to get a broader sense of how your application is performing.
Summaries
Summaries are similar to histograms but they also give you information like the sum of all the observations and configurable quantiles like the 95th percentile directly, without the need for any buckets.
Let’s say you’re now interested in understanding how long it takes for your web application to process a login request for a user. Using Prometheus, you can set up a summary metric called login_duration_seconds.
 login_duration_seconds{instance="app-server-1",quantile="0.5"} 0.042
    login_duration_seconds{instance="app-server-1",quantile="0.9"} 0.123
    login_duration_seconds{instance="app-server-1",quantile="0.95"} 0.187
    login_duration_seconds_sum{instance="app-server-1"} 75.3
    login_duration_seconds_count{instance="app-server-1"} 1250
You can see from the above summary that the average login time is 0.042 seconds (42ms). This is the median or the 50th percentile.
The trade-off here is that summaries are somewhat more resource-intensive and less flexible compared to histograms when it comes to combining data across multiple instances.
However, they can be incredibly useful if you want immediate, per-instance percentile calculations without having to define buckets as with histograms.
Best Practices for Working with Various Prometheus Metrics
We’ve seen how useful Prometheus metrics can be, but now let’s understand some best practices we can adopt when working with these metrics.
1. Organize Metric Names and Labels Clearly
Ensure that your metrics follow a consistent naming convention. For instance, the metric name node_cpu_usage_seconds_total for CPU usage is self-descriptive in nature.
Organizing metric names and labels clearly will make it easier for anyone to understand what the metric is for. Also, avoid creating labels that can have too many values to keep your metrics database simple and reliable.
2. Choosing the Right Metric Type
Each Prometheus metric type has its own well-defined purpose. Be very strict about using the right metric type.
For a metric with continuously incrementing values, use Counters . For metric values that can go up or down, like current state measurements, use Gauges. If you need on-the-fly quantiles, for instance, use Summaries. To measure the frequency or distribution of metrics across a range of values, use Histograms.
3. Avoid Overusing Histograms
While histograms are powerful, each histogram can generate many time series based on bucket definitions. This can lead to high cardinality and storage overhead. If you don’t need bucket-based distributions, a gauge or counter might suffice.
Whenever you do need to use histograms, make sure you carefully select the buckets and consider using fewer buckets for less critical metrics.
4. Use Clear and Meaningful Labels
If a label can have thousands or millions of values, it’s probably not suitable for Prometheus. So avoid using labels for data that has large cardinality like UserID, email addresses, etc.
5. Keep Alerting Thresholds Realistic
Poorly defined alerts will defeat their purpose. Define sensible thresholds that account for known fluctuations. For instance, setting an alert for CPU usage above 50% might be too sensitive. A reasonable alert threshold might be close to 90% or even 95%.
Also, you should combine multiple metrics for more accurate alerting. For example, CPU usage and memory usage can be combined into a single alert.
Collecting and Visualizing Prometheus Metrics with Middleware
You can integrate Prometheus into your own system. A lot of teams prefer to use external tools for Prometheus custom metrics dashboards and visualizations of their Prometheus metrics. You can use an observability tool like Middleware to create custom visualizations and dashboards for common metrics like CPU, memory, disk I/O, etc.
Prometheus Integration with Middleware
Integrating Prometheus with Middleware is a breeze. You can follow along with this setup guide or refer to the official docs as well.
Login to Middleware and go to the installation page from the left-hand bottom side of the home screen.
Then, go to the Integration Section
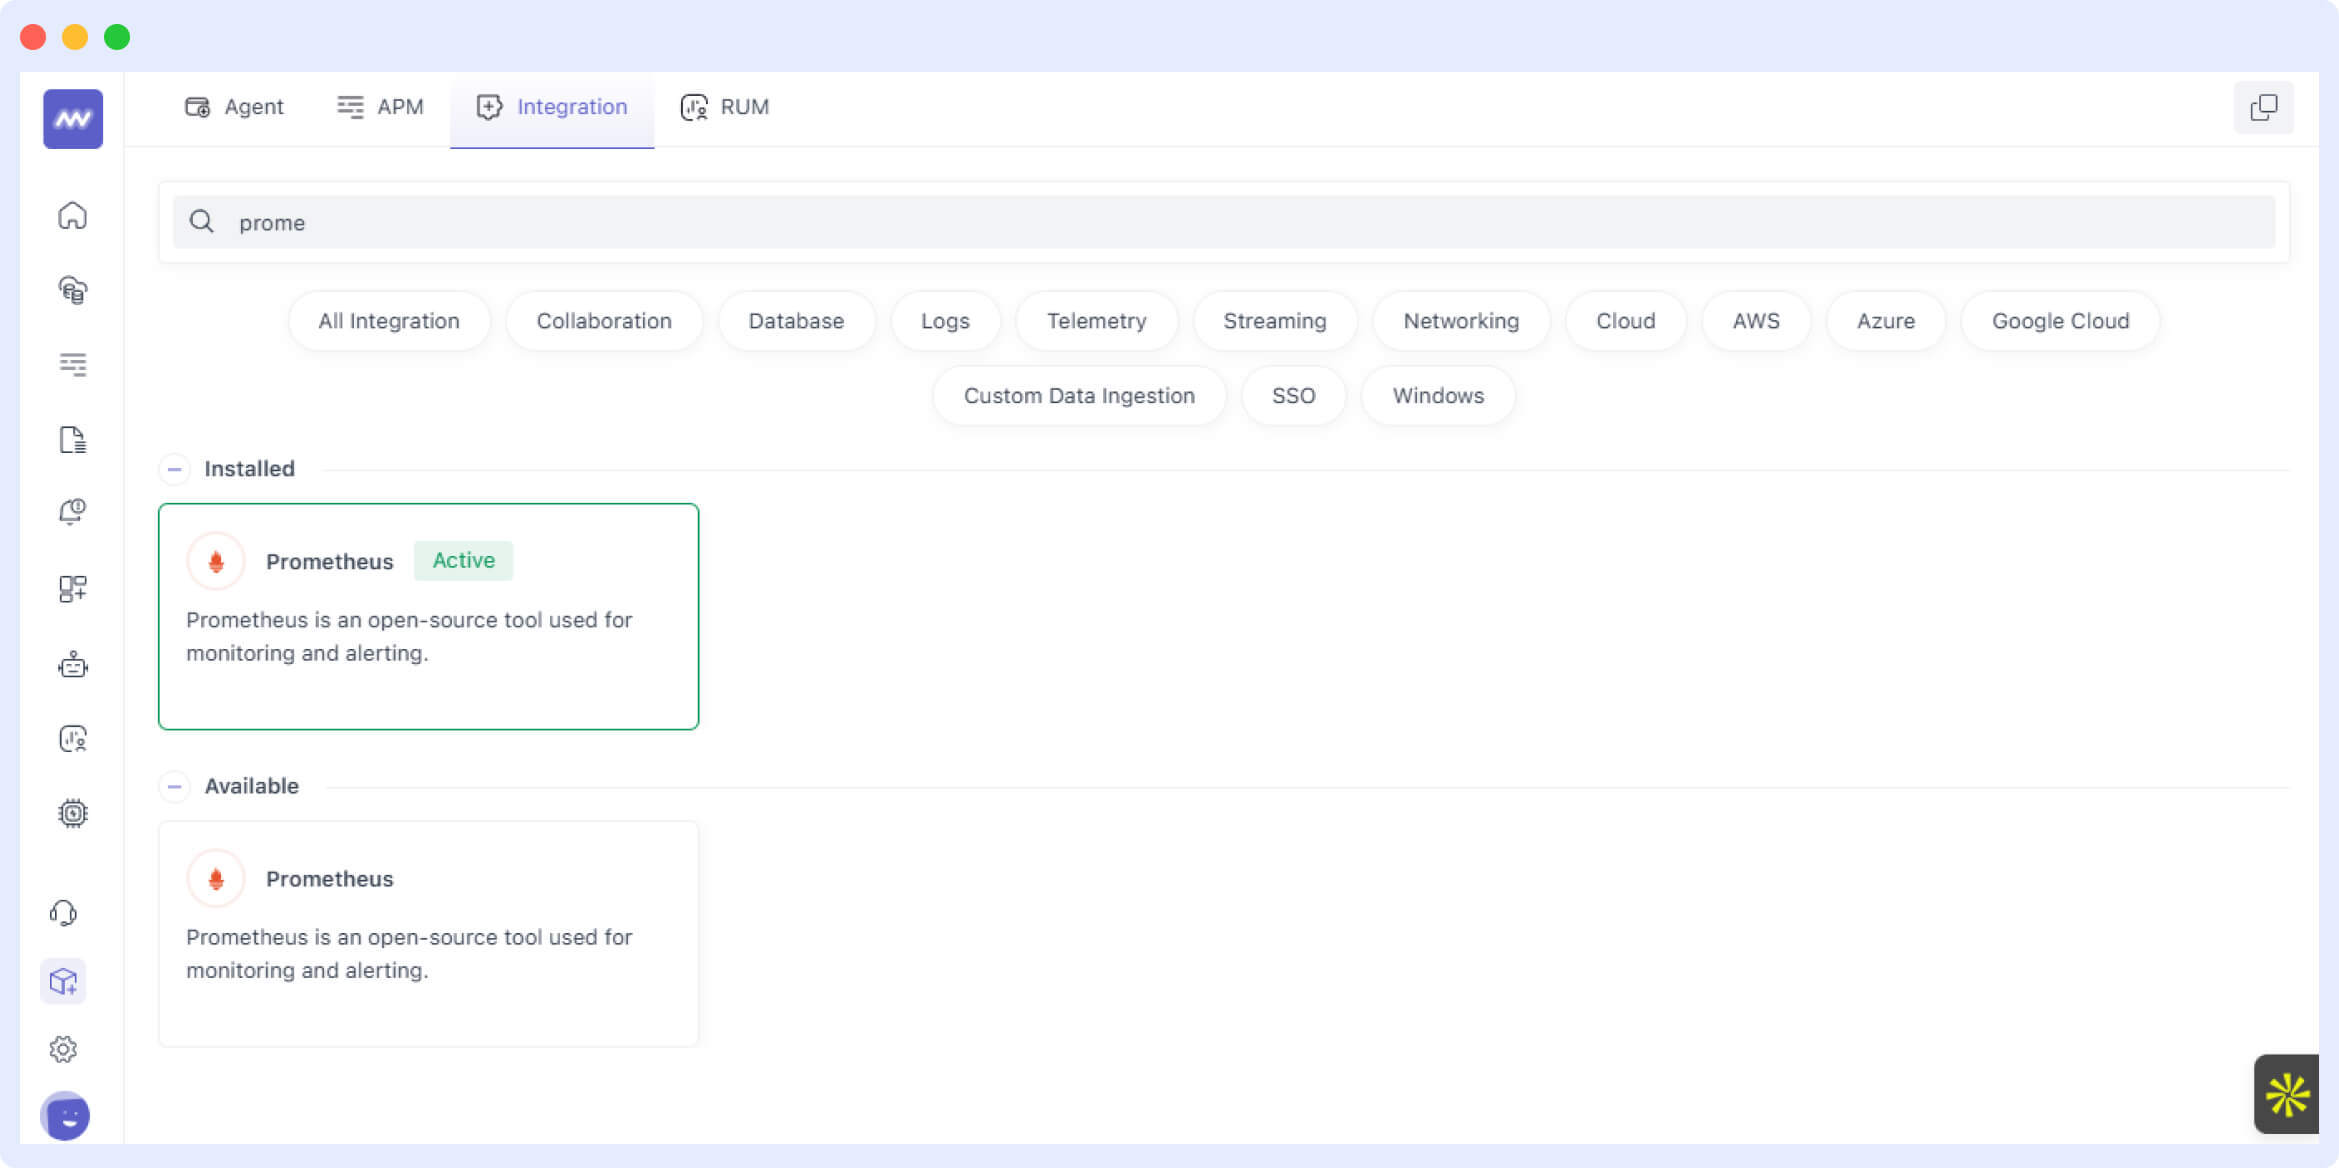
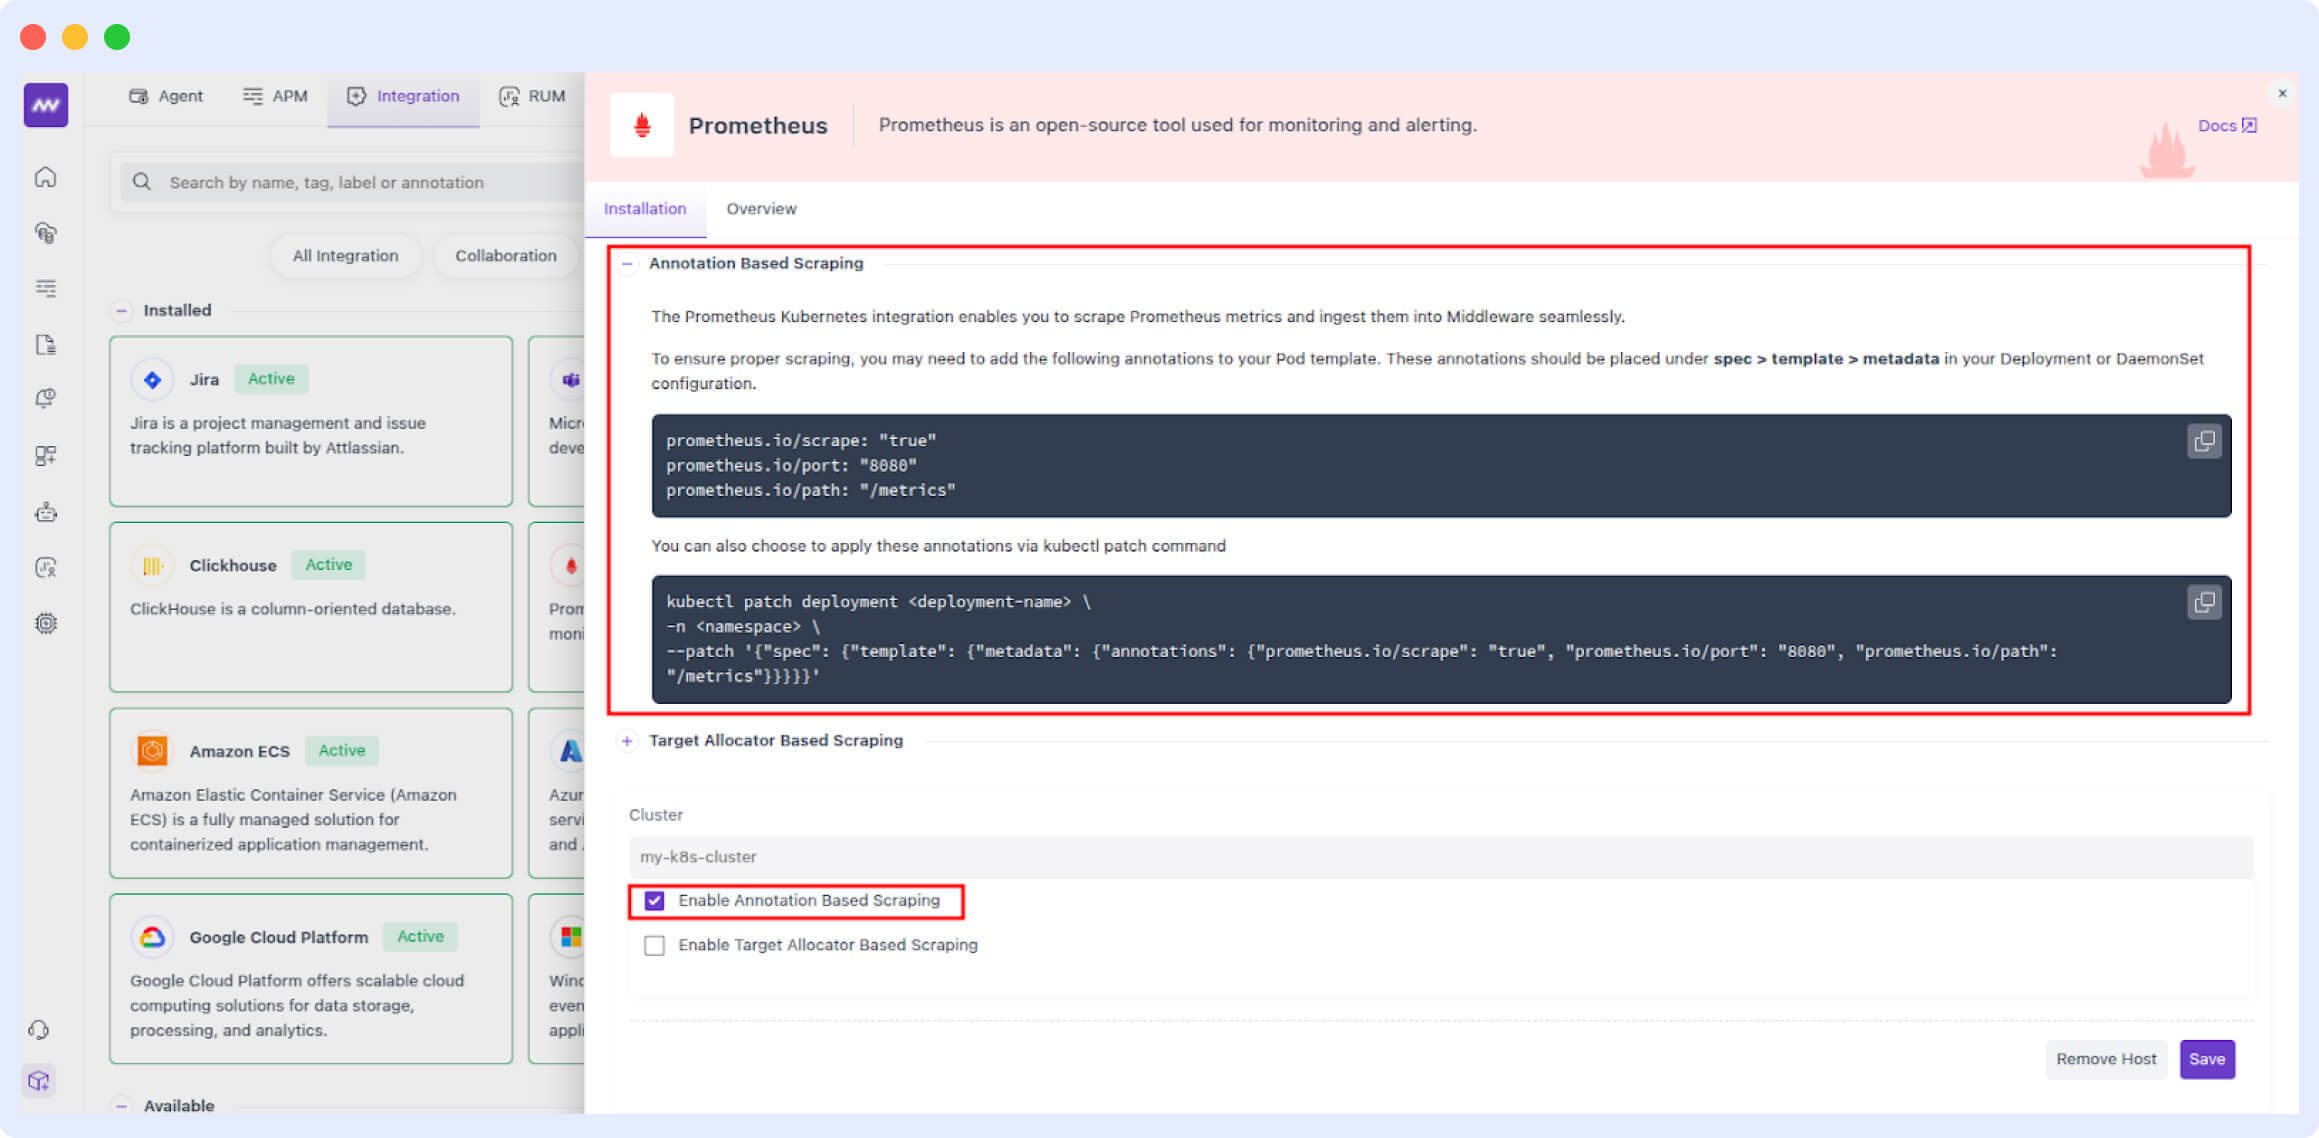
Search for “Prometheus Integration” and click on the Prometheus card from inside the “Available” tab. Here, you can select the host and configure your cluster. You’ll need to add the required Prometheus annotations in your Kubernetes deployment’s metadata as mentioned in the instructions.
Let’s go with “Annotation Based Scraping” for now. Click on the “Save” button.
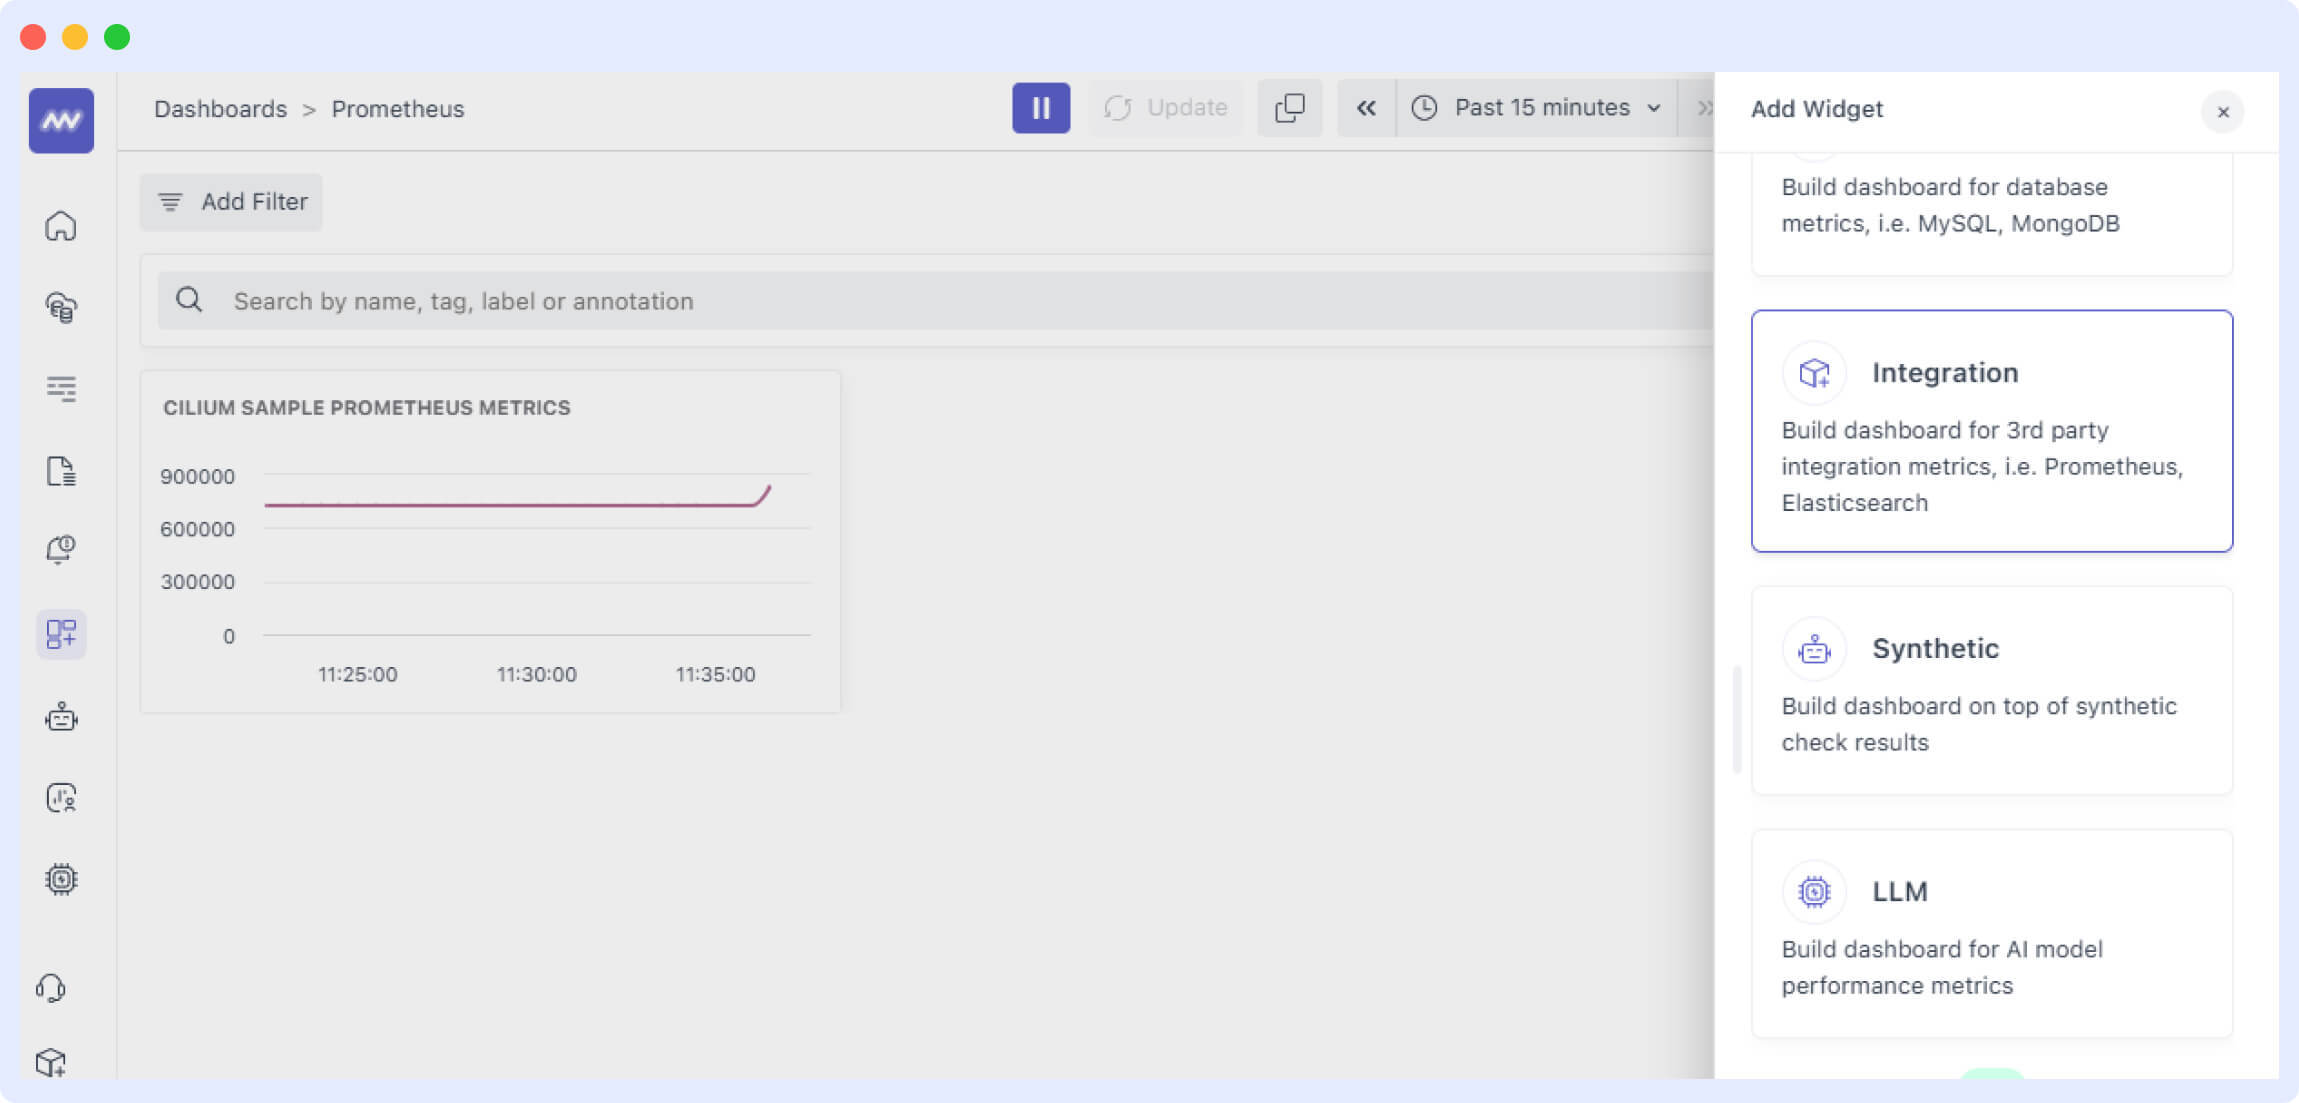
Next, we’ll create a dashboard. You can create a dashboard from scratch or simply add a new widget to any of your custom dashboards.
Add a custom widget using the “Add Widget button”. The Integration Widget can be used to collect data from Prometheus.
Next, we’ll need to mention the details of our widget.
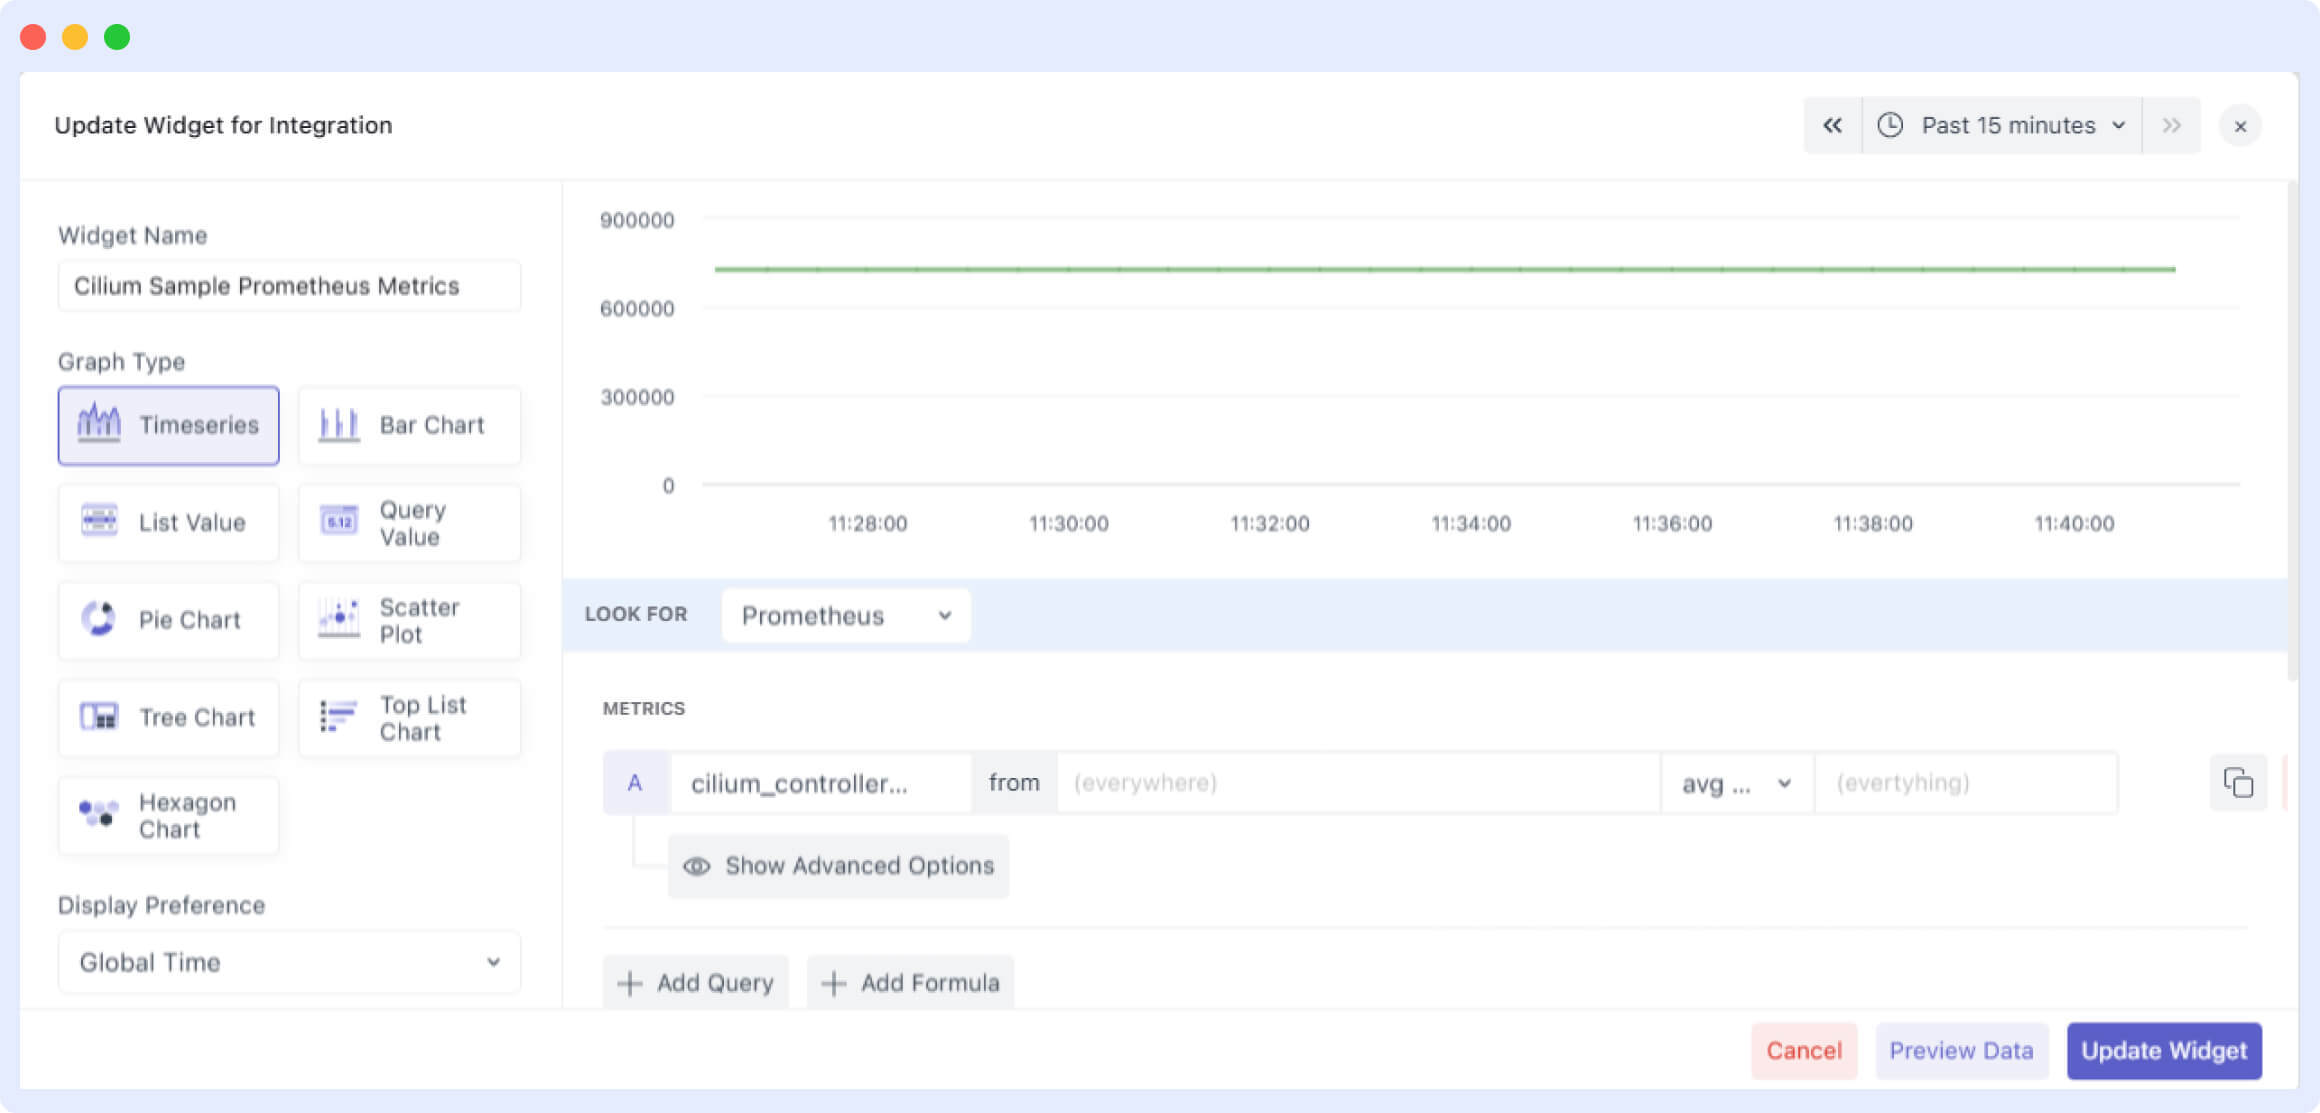
Once you click “Save”, you should see the data in the widget.
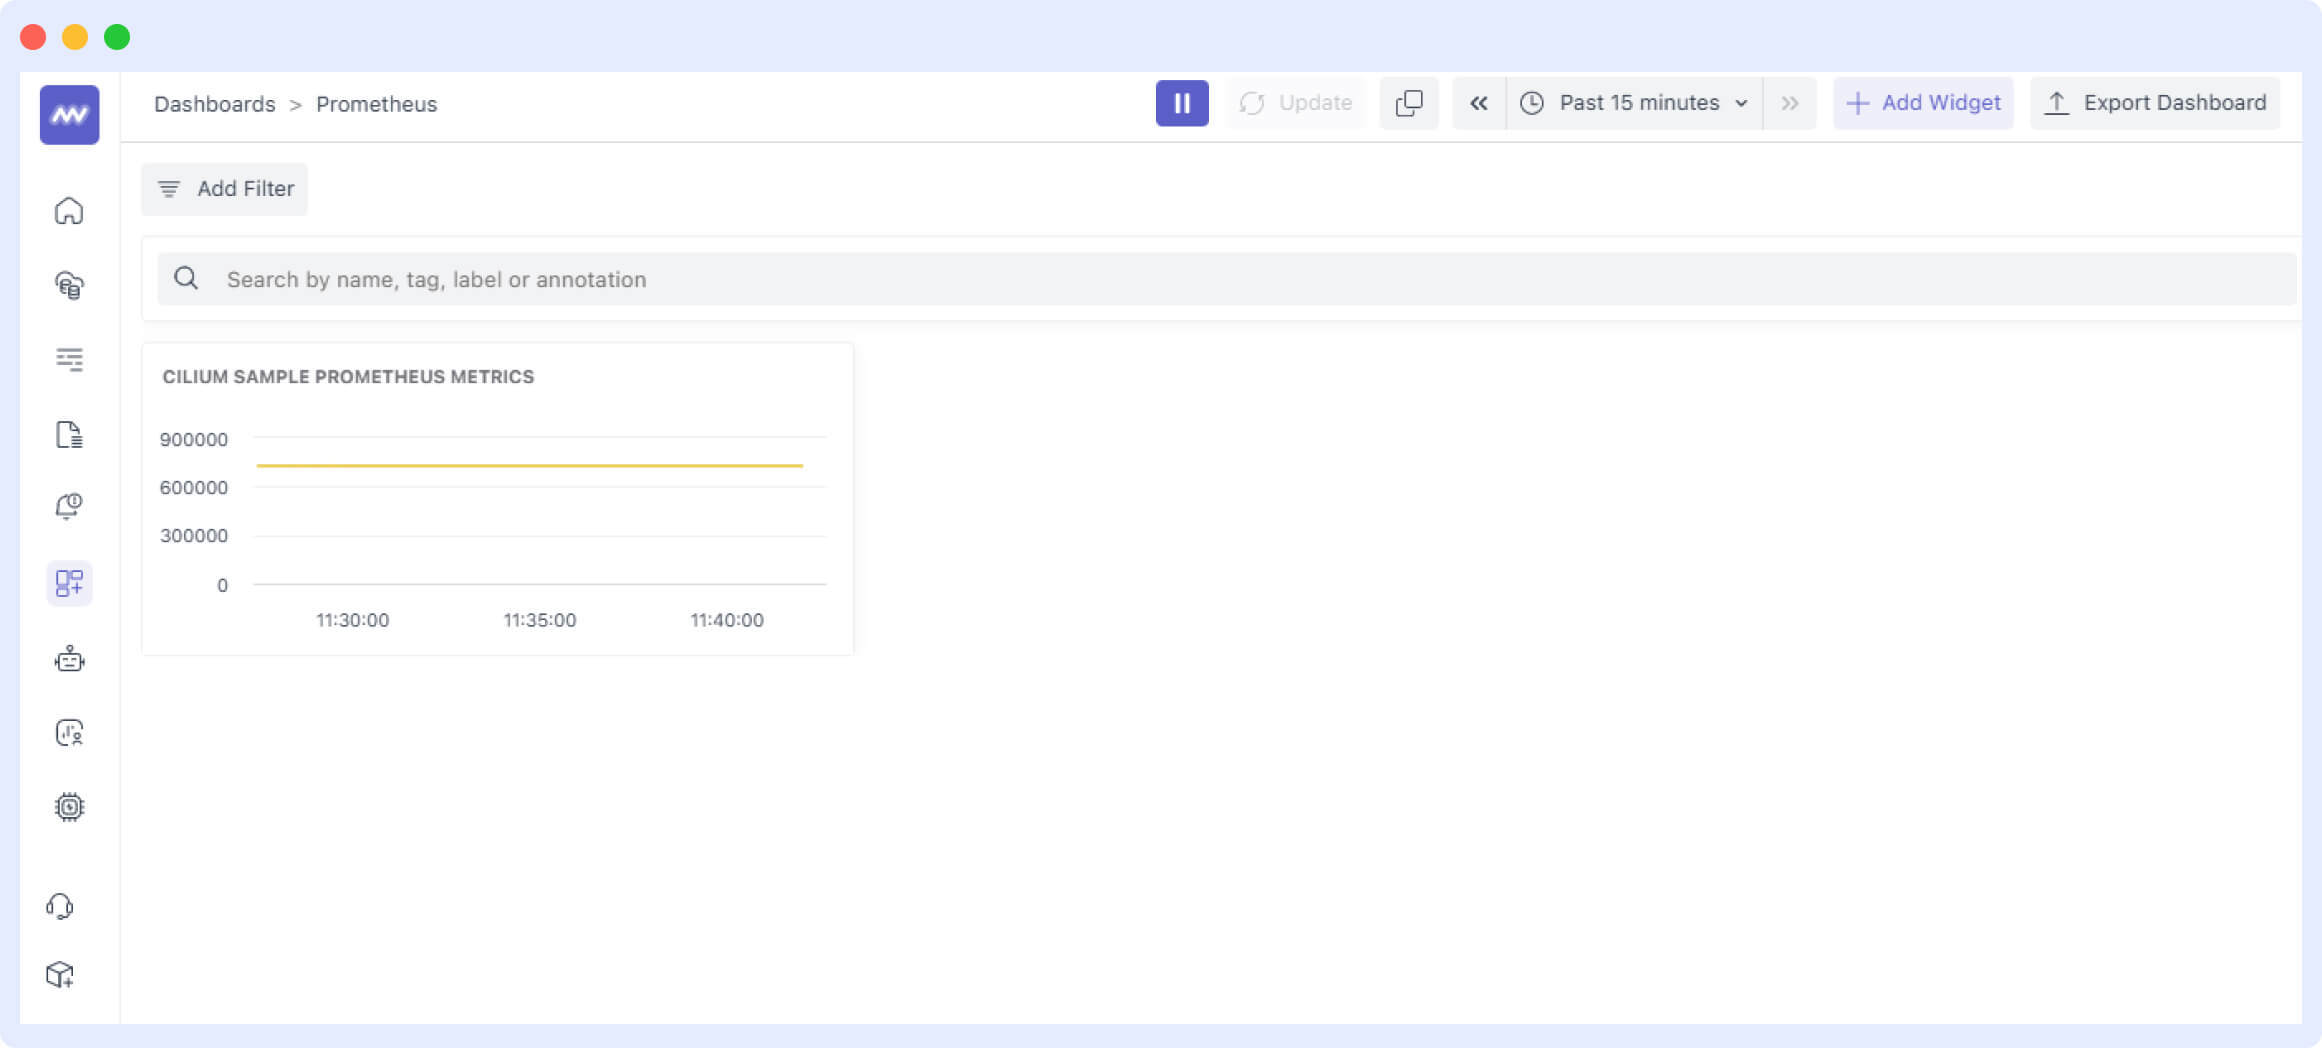
Your metrics from Prometheus will be automatically discovered and rendered here on your Middleware dashboard.


