



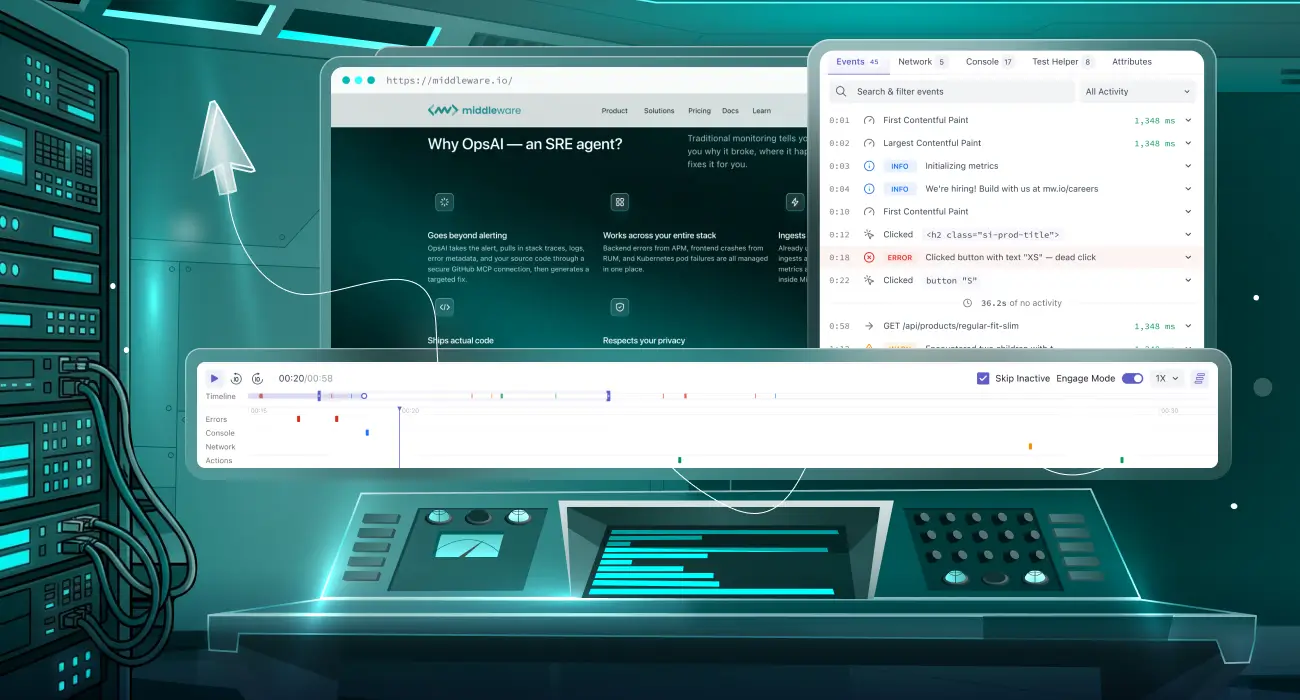
A session replay only gets you halfway to a fix. Watching what a user did is useful. But on its own, it doesn’t tell you which request failed, what error fired, or whether the user was already stuck before things broke.
Without that context, a recording is just a video with no explanation attached. You end up doing the same manual work anyway: checking a separate error tracker, guessing at a network log, and lining up timestamps by hand.
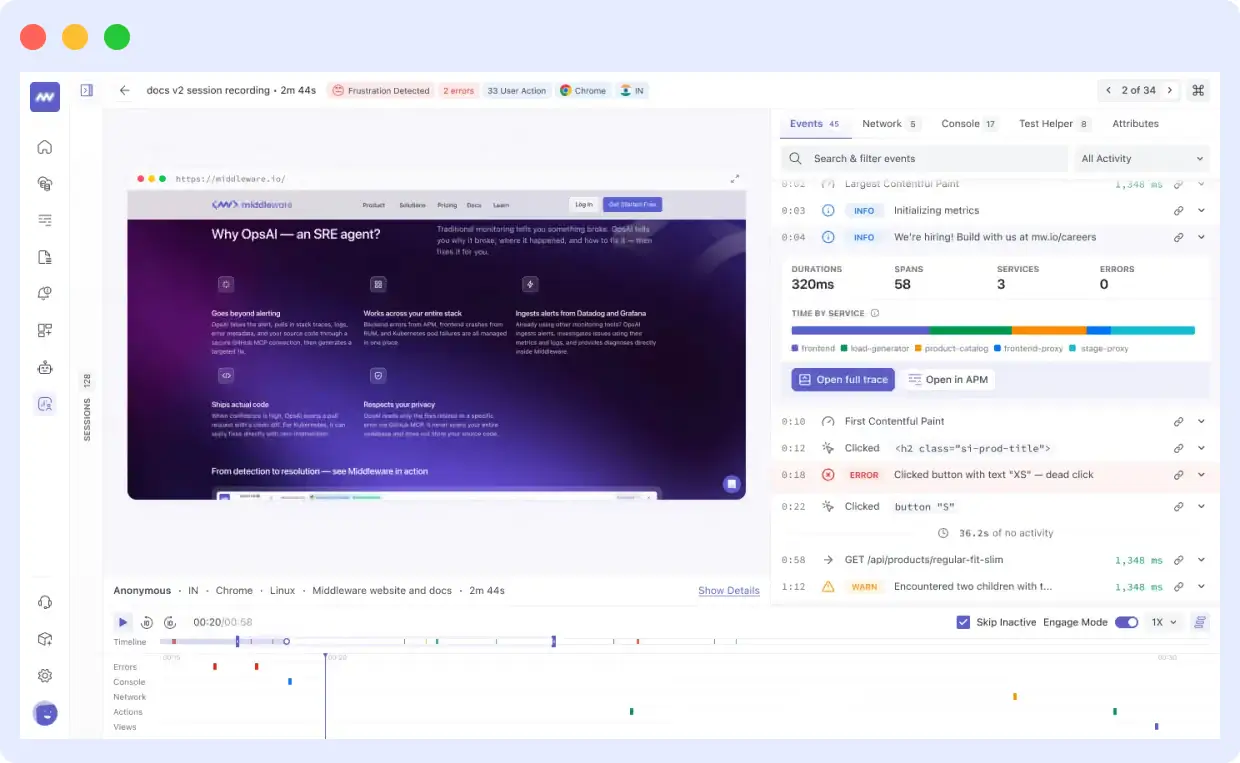
Middleware’s Session Inspector, part of Real User Monitoring, puts it all on one screen instead. The replay, a five-lane timeline, with every trace, error, and network call on the same clock. Whatever moment you’re looking at in one place is the same moment everywhere else.
What is Session Inspector?
Session Inspector is a full-page debugging view in Middleware RUM. It plays back a recorded user session alongside a five-lane timeline (errors, console, network, actions, screen views) and five filterable tabs, all synced to a shared clock, so you can jump straight to the moment something broke instead of scrubbing through a recording.
TL;DR
- Session Inspector is a full-page debugging view for one session in Middleware RUM.
- It combines session replay, a five-lane timeline (errors, console, network, actions, views), and five filterable tabs, all synced to one shared clock.
- Session recording is just the raw capture; Session Inspector is what makes it navigable and searchable.
- You can jump straight to an error, share an exact moment with a link, and turn a session into an automated test.
- Backend traces connect directly to session events when tracing is set up.
The two screens: Session Explorer and Session Inspector
Real User Monitoring splits this work across two screens.
Session Explorer is a list. It shows every recorded session in a time range. You filter and sort it down to the ones worth watching.
Session Inspector is what opens when you click a session in that list. It’s a full page for one session: the replay, a five-lane timeline, and a set of tabs, all sharing one clock.
Whatever filter you had set in the Explorer carries over into the Inspector. The session switcher inside it holds the same group of sessions you were just looking at.
It’s worth being clear on one more thing: the recording itself, also called session replay, is just the raw capture. On its own, it’s a video you’d watch front to back, with no way to jump to the moment something broke. Session Inspector is built on top of that recording.
It adds the five-lane timeline, the filterable tabs, the session switcher, shareable deep links, and correlation with backend traces, all synced to the recording’s own clock, which is what makes it navigable instead of something you just sit and watch.
How Session Inspector works
It helps to know what’s happening behind the scenes. It explains why the Inspector can do things a normal screen recording can’t.
The replay isn’t a video file. When a session starts, the SDK takes one snapshot of the page, then records every change after that as a small diff: a button appearing, text updating, and so on, instead of a stream of video frames. This keeps the file small and makes the replay exact. Scrubbing or running it at 8x speed just replays those diffs faster. Sensitive fields, such as passwords, are hidden on the device before anything is ever uploaded.
At the same time, the SDK tracks other events in the background: page changes, network calls, errors, clicks, console logs, and page speed. Every one of these gets tagged with the same session ID, so they can all be lined back up later even though they were captured separately.
If your backend tracing is enabled, network calls carry that connection as well. That’s what lets a slow click in a session trace all the way through the backend distributed trace to the service that caused it.
All of this lands at an ingest endpoint and gets stored by session ID and timestamp. When you open the Inspector, it pulls that data back apart: it replays the diffs to rebuild the video on one side, and sorts the same events into the timeline’s five lanes on the other. One shared playhead drives both. That’s why clicking a mark on the timeline can jump the video.
You get to a session by opening Session Explorer, Real User Monitoring’s filterable list of every recorded session, and clicking a row. That row opens in the Inspector, and any filters you had set carry over.
Inside Session Inspector: layout, header, and session switcher
The Inspector page has three parts: the replay on the left, a set of tabs on the right, and a five-lane timeline running underneath both. You can drag the divider between the replay and the tabs to resize them, and it remembers where you left it.
The header at the top has a “Back to sessions” link, the session ID, small tags for the app, environment, and session length, and either “N errors” or “no errors.” Next to that are icons for the user, browser, OS, and country. A counter shows you where you are in the list, like “3 of 40,” with buttons to jump to the previous or next session without going back to the list.
The session switcher is a sidebar that stays out of the way until you need it. Collapsed, it’s just a thin strip showing how many sessions are in your current filter. Expand it, and you get a searchable list of every one of those sessions, each showing its user, country, browser, OS, and the number of actions and pages involved. The one you’re watching is highlighted.
The session info panel, just under the replay, shows the user’s name, country, browser, OS, app, and session length at a glance. Click “Show Details” and it breaks that into three groups: session details (ID, start time, length), user details (name, location, environment), and device details (browser, OS, app).
The Session Inspector timeline: five lanes on one clock
This is the part that makes the Inspector more than a video player. Five lanes run side by side on one shared timeline:
| Lane | Shows |
|---|---|
| Errors | Every error that happened |
| Console | Console output, color-coded by level |
| Network | Every request, marked if it failed |
| Actions | Clicks, flagged if they were rage clicks or dead clicks |
| Views | Screens or pages, shown as blocks from when they opened to when they closed |
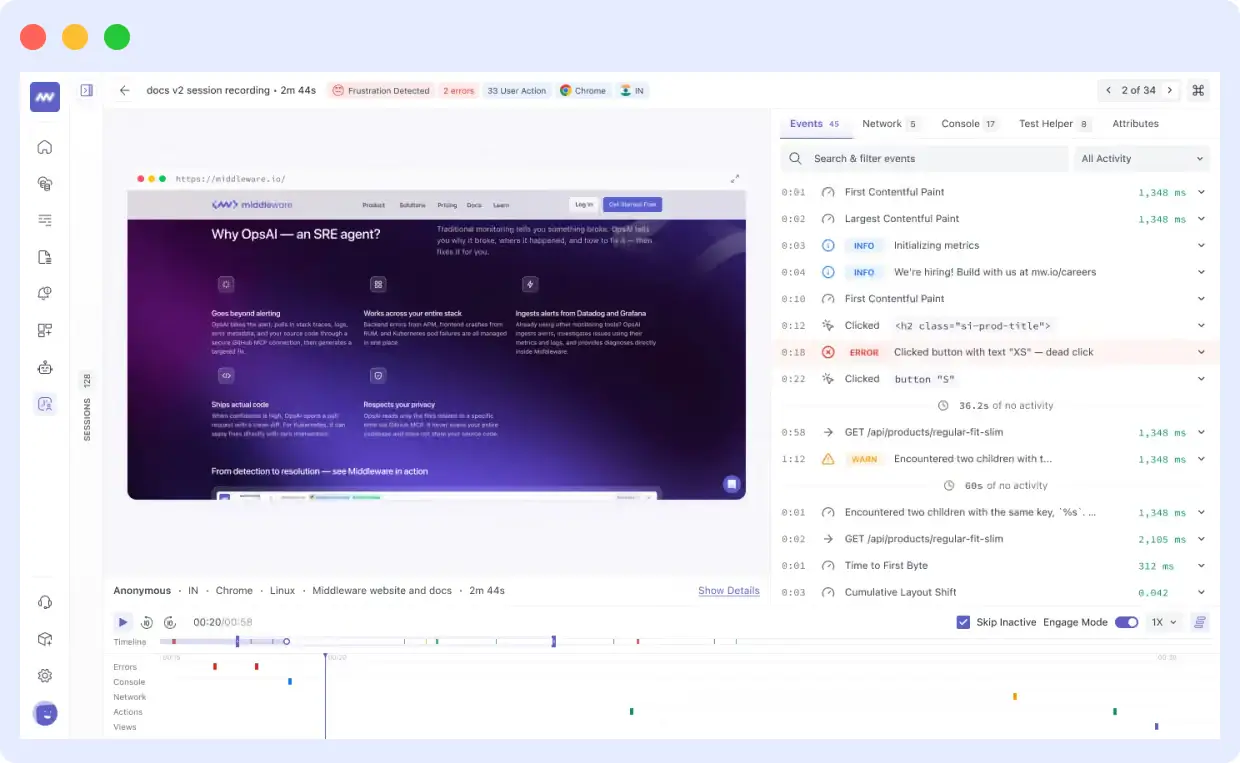
Click any mark on any lane, and the replay jumps to that exact second. Click anywhere on the scrub bar to jump there. Drag across a section to zoom in on it, double-click to zoom back out to the whole session, or scroll to zoom in or out around wherever your cursor is.
Below the timeline sit the playback controls: play and pause (or just hit the space bar), skip back or forward 10 seconds, and a running clock. A “skip inactive” button jumps past quiet stretches, and “engage mode” lets you scroll or hover inside the replay itself. Speed options run from 1x up to 8x, and a toggle hides the timeline lanes if you just want to watch.
The replay window itself only shows the page’s URL and a fullscreen button. Everything else lives on the timeline.
The five Session Inspector tabs: Events, Console, Network, Actions, and Test Helper
Below the replay, five tabs let you dig into any one stream in detail. They all filter onto the same shared clock, so switching between them never loses your place. Each one’s count badge turns red if it contains an error.
Events is the full activity feed: every request, every error wherever it happened, page loads, and everything the page pulled in. Filter it down to just screen changes, just errors, just user activity, just network events, or just Web Vitals, or search it directly. Quiet stretches with no activity show up as their own labeled row, something like “12.4 seconds of no activity,” with a button to skip past it.
Console shows log output at the following levels: log, info, warning, debug, and error. You can filter by level. If a session has no console output at all, it just says so.
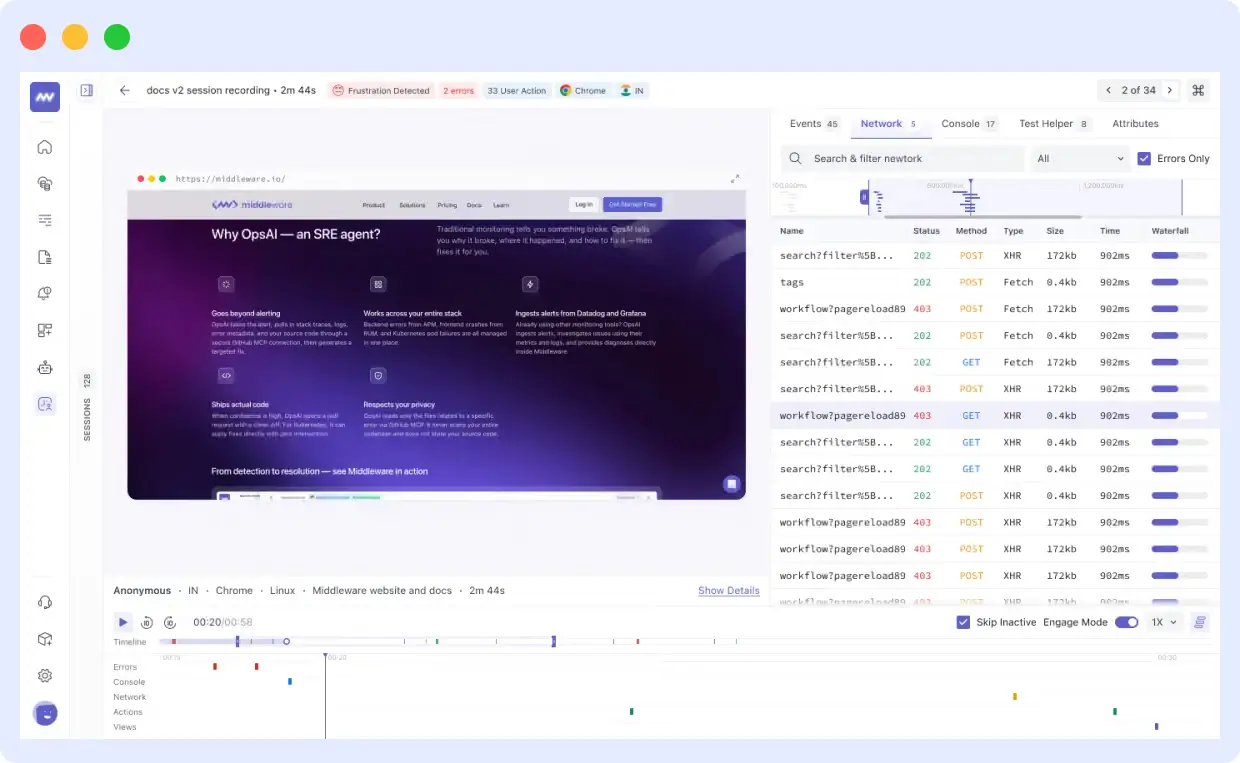
Network lists every request the page made, with its name, status, method, type, size, and time. A bar shows how long each one took compared to the others.
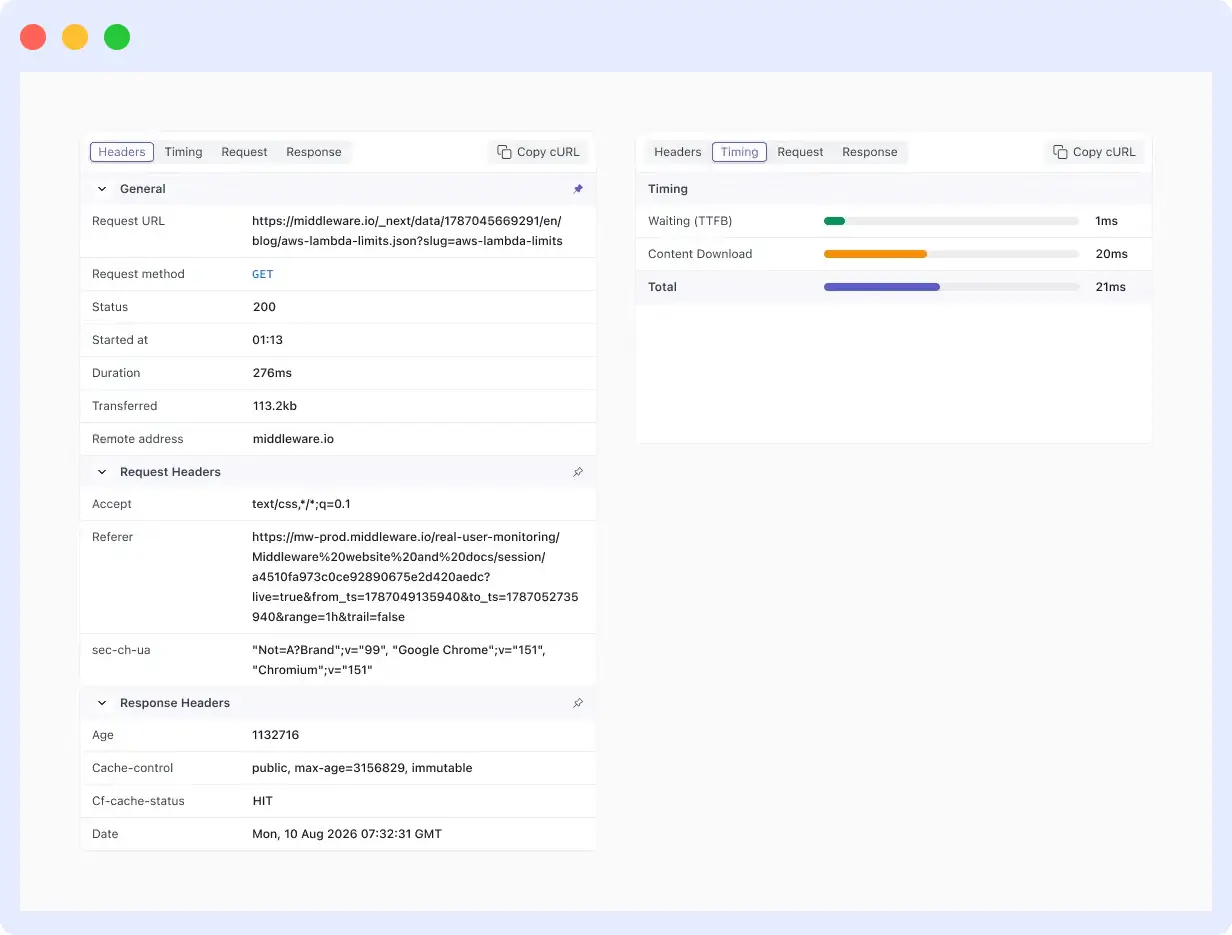
Search it, filter by request type, or check a box to show only failed requests. Click on any request, and the replay jumps to that moment while a detail panel opens with its headers, timing breakdown, and the actual request and response bodies. Timing breaks down into DNS lookup, connection time, wait time, download time, and total.
Actions show exactly what the user clicked, with rage clicks and dead clicks called out clearly. Filter by element, by text, or just show the flagged ones.
Test Helper turns the session’s own recorded clicks into a ready-to-run test, in Playwright, Cypress, Puppeteer, or Selenium. Pick a framework and copy the test. This only works on sessions that have a replay.
Digging into any single event
Rows in Events, Console, and Actions all expand if you click them. What you see depends on the type of row.
An error expands to its full stack trace, with a toggle to switch between the minified and the original, readable versions. That toggle only works if you’ve uploaded source maps for that build; otherwise it falls back to showing what was recorded.
Anything else expands into a small trace card: how long it took, how many parts (spans) it was made of, and which backend services were involved, broken down by how much time each one took. This is the part that connects a slow click on the frontend to the backend service actually responsible for it. If the request never reached your backend, the card just says so.
Click “Open full error” or “Open full trace” on either of these, and a full-detail drawer slides up from the bottom of the page without moving the replay or the timeline.
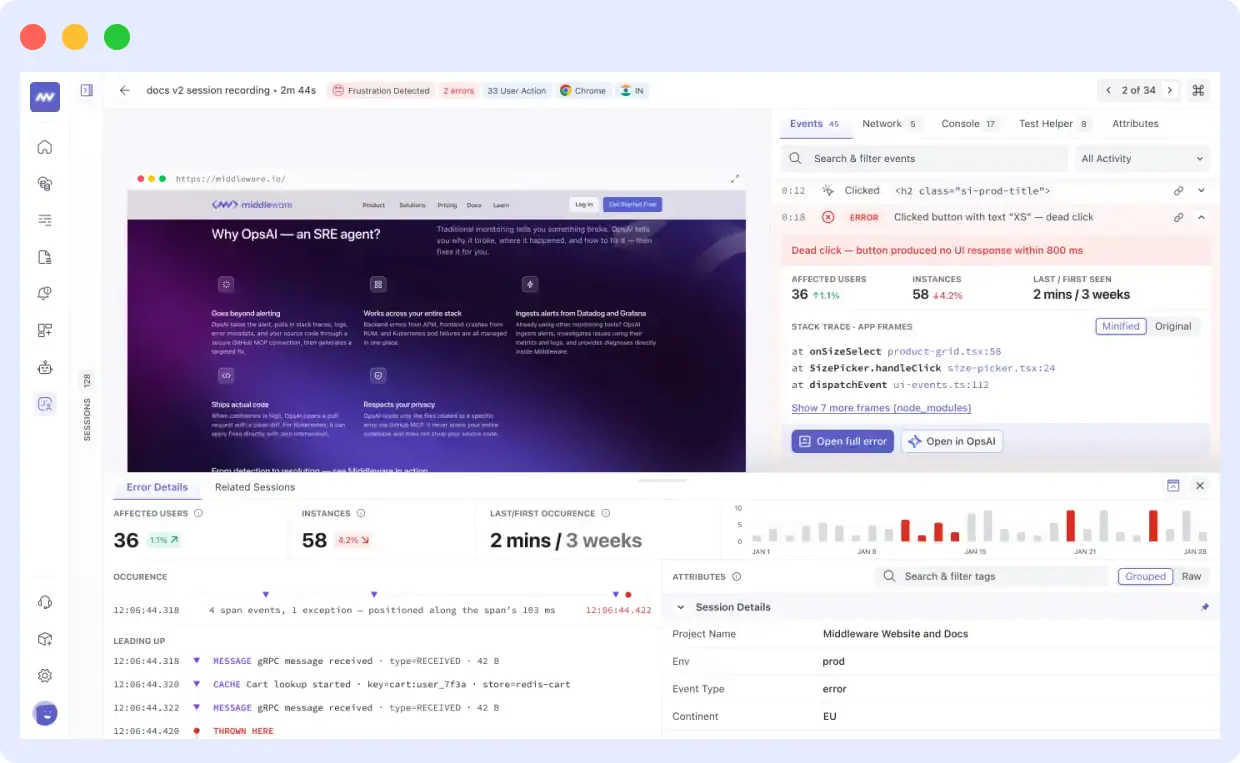
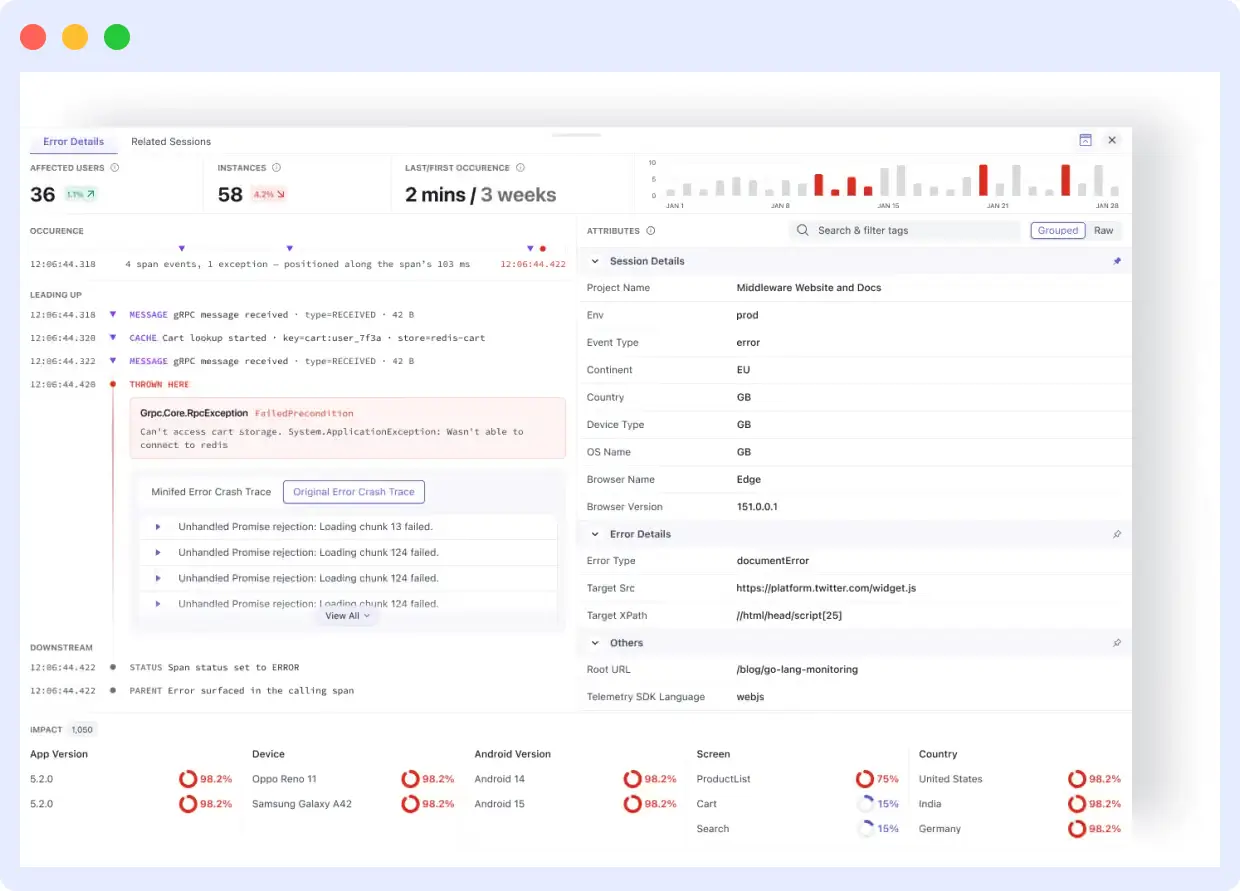
For an error, this drawer shows the full stack trace, how many users were affected, when it was first and last seen, and a breakdown of where it’s hitting hardest, by app version, device, screen, and country. It also lists every other session that hit the exact same error.
For anything else, it opens the same trace view you’d get in Middleware’s APM product, with a waterfall chart, a flame graph, and a service map.
When that trace points to an actual error, Middleware’s OpsAI can take it from there and open a pull request with a fix, instead of just showing you where the problem is.
How to share an exact moment in a session replay
Each Inspector page has its own link, and you can share it as is. Add ?t= followed by a number of milliseconds, and the link opens right at that moment instead of the start of the session. Older links from before this page existed still work and redirect automatically.
One thing to know: sessions can’t run past four hours. That limit applies to the whole page, not just the video.
A real example: tracing a checkout error to its root cause
Say error rates spike right after a release. Filter Session Explorer to the new app version, then sort by error count. The top session shows a customer hitting an “invalid discount code” error three times before giving up on an $85 cart.
Pressing N inside the Inspector jumps straight to the failure. The error’s stack trace resolves cleanly, since source maps were uploaded for this build. Expanding it shows a trace pointing to a failure in the pricing service.
Checking related sessions shows four other customers hit the exact same error in the last hour, so it’s not a one-off. You copy the link, attach the timestamp, and drop it straight into the team’s chat.
That took a few minutes. Before this tool existed, the same bug usually meant a support ticket, a wait for more details, and a slow manual search through separate logs.
If the fix is a code change, Middleware’s OpsAI can take it from here and open a pull request with a fix ready to review.
Fix it faster: OpsAI can turn a session like this into a ready-to-review pull request. See how OpsAI works →
Five ways teams use Session Inspector
Correlating frontend errors with backend traces for faster RCA and error solving: open the session where the error happened, and expand it in the Events tab. The mini trace card shows the backend services involved; open the full trace to see exactly which one failed, using the same Waterfall and Flame Graph views as APM. This connects a frontend error to its root cause and gets it resolved faster, without switching tools.
Investigating a reported bug: filter by the page URL or the user’s email, sort by error count, and open the top session. Press N to jump to the first error, check what else was happening in the Errors lane, then open the error for its full stack trace. Check related sessions to see how widespread it is.
Validating a release: filter to the new app version in production, sort by frustration count, and open the worst session. Check the Actions tab for flagged clicks, and cross-check them against the Network lane for nearby slow or failed requests.
Chasing down flaky network failures: open a handful of recent sessions, and check the Network tab with failures only shown. Read the timing breakdown: a long wait time points at your backend, and a long connection or lookup time points at the network or the client.
Turning a bug into a test: once you’ve found the session that reproduces a bug, open Test Helper, pick a framework, and copy the generated test straight into your test suite.
Troubleshooting Session Inspector
| What you’re seeing | Likely reason |
|---|---|
| No replay shows up | Ad-blockers or a content security policy may be blocking the recording, or the SDK is loading too late |
| Test Helper isn’t available | The session has no replay to generate a test from |
| No sessions show up for a new version | Check that the app version is being set correctly and the build has actually reached users |
| A request just says “failed” | Usually a blocked or cancelled request; check CORS settings and ad-blockers |
| High frustration count but few errors | Look for slow-loading scripts or long tasks in the Events tab, filtered to Web Vitals |
| Stack traces are unreadable | Upload source maps for that build |
Session recording privacy and data security
A replay reconstructs the actual page, so it can show exactly what wasn’t masked. Password fields are masked automatically on the device before anything is uploaded.
Everything else personal details, custom sensitive fields specific to your app needs its own masking rule. That part isn’t automatic, so set it up before you rely on this for real user data.
It’s also worth turning off recording entirely on admin or internal pages and sharing session links only with people who should see them.
For how long sessions are kept and how that data is handled, Middleware’s Data Security page covers the details. Session Recording Privacy covers exactly how to set up masking.
Try it on your own sessions
Session Inspector is live now. Open Real User Monitoring, pick any application, and click into a session. No extra setup is needed if you’re already using the RUM SDK.
FAQs
What is Session Inspector in Middleware RUM?
Session Inspector is a full-page debugging view for a single recorded user session in Middleware Real User Monitoring. It combines session replay, a five-lane timeline (errors, console, network, actions, views), and five filterable tabs, all synced to one shared clock.
How do I find a session that had an error?
Sort the Session Explorer list by Error Count. Sessions with the most errors appear at the top. You can filter further by app version, browser, or a specific page first.
Can I jump straight to an error without watching the whole recording?
Yes. Press N inside Session Inspector to jump to the next error, or click any mark on the errors lane of the timeline.
Can I filter sessions by browser, country, or device?
Yes. Session Explorer filters by environment, app version, browser, OS, user, page, country, city, and device. Filters can be combined.
Does Session Inspector connect frontend errors to backend traces?
Yes, if backend tracing is set up. Expanding an event shows the backend services involved. Opening the full trace shows the same view used in Middleware’s APM product.
Can I turn a session recording into an automated test?
Yes. Test Helper generates a runnable Playwright, Cypress, Puppeteer, or Selenium test from a session’s recorded events, provided the session has a replay.
How long can a session recording last in Middleware RUM?
Up to four hours, or less if the session ends early due to 15 minutes of inactivity.
Is sensitive user data masked automatically in session recordings?
Partially. Password fields are masked automatically on the device before upload. Other sensitive data, like personal details or custom fields specific to your app, needs a masking rule you set up yourself.

