



When a request fails, it rarely fails in one place. It moves through multiple layers: network, application code, and database, with each layer adding its own step to the journey. When something breaks, the hard part is finding exactly which layer, which step, and which downstream call actually caused it, not just that the request failed.
That’s what Trace Explorer is for. It maps the entire request end-to-end, every layer it passed through and every step along the way, so you can see exactly where things went wrong instead of guessing.
Distributed tracing tracks a single request as it moves across services, recording each step as a span. Root cause analysis is the process of using those spans to find which service, query, or line of code actually caused a failure. Trace Explorer is Middleware’s distributed tracing tool for doing both in one place, built on OpenTelemetry.
TL;DR
- Trace Explorer is a side panel opened from any row in APM → Traces, showing one distributed trace across four linked views: Waterfall, Flame Graph, Spans, and Map.
- Selecting a span in any view keeps it selected in every other view, so you never lose context when switching visualizations.
- A trace summary strip surfaces duration, span and service counts, error count, and Time by Service, so you can spot the slowest service before opening a single span.
- Errors, Logs, and Events highlight filters, plus a minimap and search, reduce a trace with thousands of spans down to only the spans that matter.
- The Attributes tab groups all span attributes by prefix (http, db, messaging, and so on), supports filtering, a JSON view, and one-click “filter by value,” and the Events tab pinpoints the exact line where an exception was thrown, along with its full stack.
- Tabs, columns, and view order are all draggable and remembered between sessions, so the panel matches how your team actually debugs.
What is the Trace Explorer
The Trace Explorer is a panel in Middleware APM that displays a distributed trace in full detail. It has four views of the same trace, plus attributes, logs, events, and infrastructure data for any span you select.
To open it, go to APM → Traces and click any row. It opens as a side panel, so your trace list stays exactly where you left it.
Select a span in one view, and it stays selected when you switch views. You never lose your place mid-investigation, which matters a lot more than it sounds when you’re debugging a microservices architecture under pressure.
Prefer video? Watch the full guided tour of the Trace Explorer.
Why Middleware built Trace Explorer
Distributed tracing only helps if you can move from “something is slow” to “this line, in this service, at this timestamp” without losing your place. Before Trace Explorer, that meant separate screens for the trace hierarchy, the timing breakdown, and the raw span list, each with its own selection state.
Trace Explorer keeps the trace, the visualization, and the span details in one panel, so switching from a flame graph to a spans table to check exact durations does not mean having to re-find the span you were just looking at.
What you can do with it
- Follow a single request across every service it touched and see exactly where time was spent.
- Locate the slowest span, the deepest call chain, or the span that raised an error, without scrolling a flat log.
- Reduce a large trace to only the spans carrying errors, logs, or events.
- Review every attribute recorded on a span and turn any value into a filter with one click.
- Trace an exception back to the exact point it was thrown, including the full stack.
See the whole trace at a glance with the summary strip
Before opening any view, the summary strip shows you the shape of the trace: total duration, span and service counts, error count (it turns red the moment it’s non-zero), start and end timestamps down to the millisecond, and Time by Service, how much of the trace each service accounts for.
Time by Service is usually the fastest way to know where to start. If one service owns most of a slow trace’s duration, that’s your first stop, before you’ve opened a single span. In the trace above, it’s immediately clear this is entirely an app-api-v2 problem, so there’s no need to hunt across services.
What are the four Trace Explorer views?
Trace Explorer shows the same distributed trace four different ways, because no single visualization answers every question. Which view should you open first? For most investigations, it’s Waterfall. It shows what called what, in what order, so it answers the first question you actually have: where does this request go, and which step comes right before it breaks.
Once you know that, the next question is usually which step took the longest. That’s Flame Graph’s job: bar width is duration, so the slowest span is the widest bar, no reading a duration column required.
If you’d rather sort than scan, Spans is a flat table. Sort by % Exec or Duration, and every expensive span in the trace lines up at the top, regardless of where it sits in the hierarchy.
Map is the one you’ll reach for least, but it earns its keep on traces that fan out across a dozen services. When Waterfall turns into a wall of nested rows, Map turns the same data into a graph you can actually follow.
| View | Best for | Skip it when |
| Waterfall | Call order, parent-child relationships | You just need the single worst span |
| Flame Graph | Spotting the slowest span visually | You need exact timestamps |
| Spans | Sorting and comparing spans directly | The trace is small enough to scan by eye |
| Map | Traces with wide, complex fan-out | The trace only touches one or two services |
Opening the trace
Back to the 2:35 PM incident. You go to APM → Traces, find the failing row, and select it. Trace Explorer opens as a side panel above the list, so your filters stay exactly where you left them when you close the panel again.
The first thing you see isn’t a view at all; it’s the summary strip.

How it works. Duration is wall-clock time from the first span’s start to the last span’s end. Errors turn red the moment any span in the trace fails, which is exactly what’s happening above. Time by Service breaks down which service owns the most trace time, using the same color key every view below it uses.
When to use it. Before you open anything else. Here, Time by Service already tells you this is entirely an app-api-v2 problem; no need to go hunting across services. That’s thirty seconds of triage before you’ve looked at a single span.
Cutting a large trace down to size
Six spans is easy to read at a glance. Six thousand is not, so Trace Explorer gives you three filters that combine.
Minimap. A compressed view of the whole trace in service colors, so dense or error-heavy regions show up before you zoom in. Drag the window to pan, drag its edges to zoom into a range, scroll to zoom around the pointer, or double-click to reset. Waterfall and Flame Graph both follow whatever the minimap window is showing.
Search. Matches spans by name or service. Matches stay highlighted while everything else dims, so you see the match in context rather than pulled out of the trace.
Highlight filters. The Errors, Logs, and Events chips next to the search box, the same red, blue, and purple pills you’ve seen in every screenshot above, show how many spans carry each signal. Select one to restrict every view to just those spans. Chips combine, so Errors plus Logs shows anything with either.
When to use these. On a trace this small, you don’t need them. On a trace with thousands of spans and a hard SLA to hit, apply Errors first, then search or zoom in from there. That single filter is usually what turns an unreadable trace into a two-minute investigation.
Span details: attributes, events, and the exception trail
Selecting a span, in any of the four views, loads it into the detail tabs below: Info, Events, Infrastructure, Metrics, Logs, Processes, and Errors.
Attributes, grouped by prefix
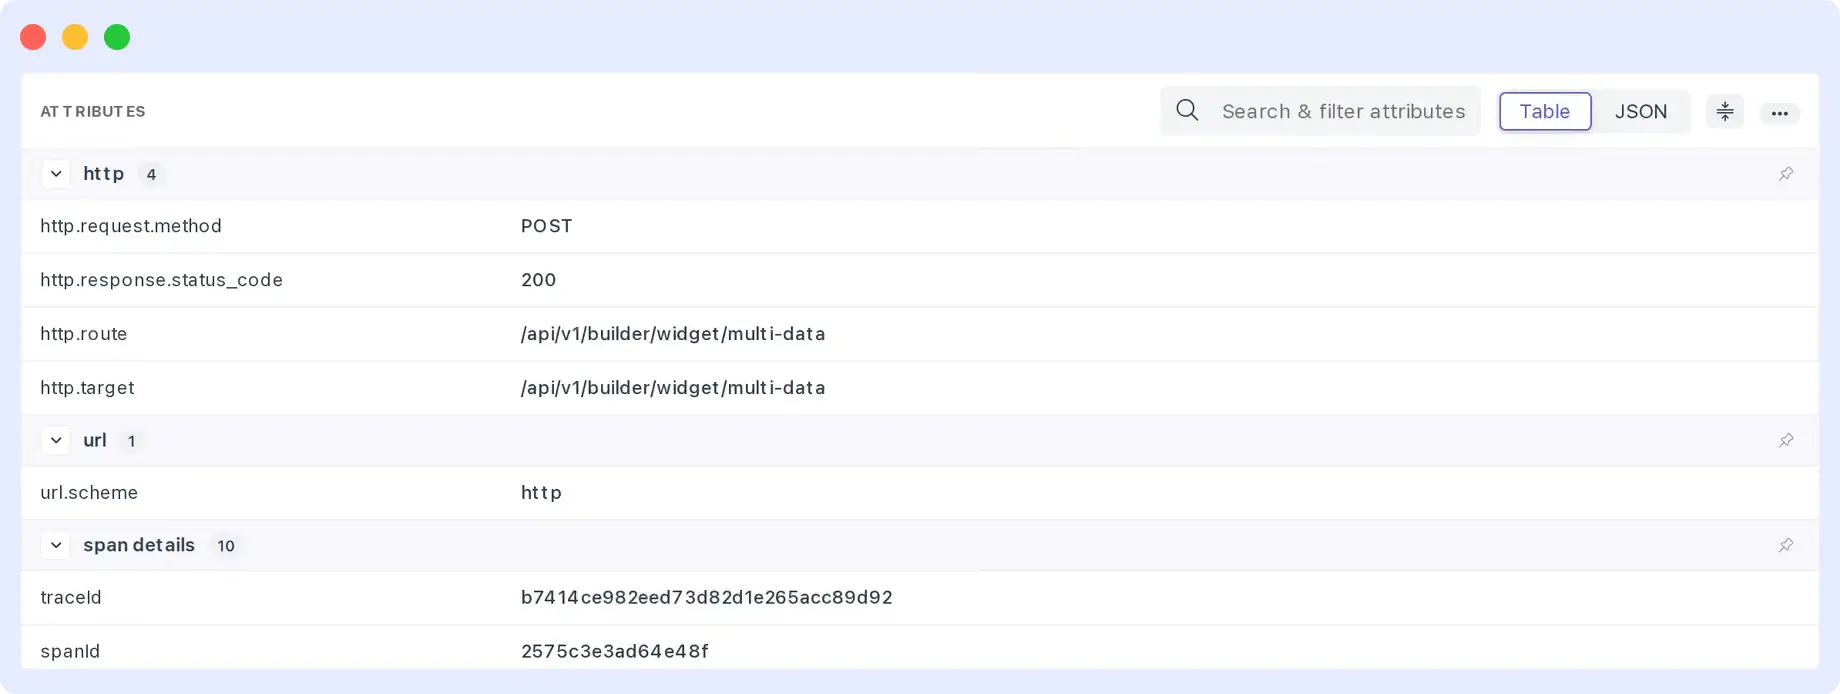
How it works. The Info tab groups all attributes by key prefix, http, url, db, messaging, and so on, with a count next to each group. A span details group is always present, with identity and timing fields: traceId, spanId, parentSpanId, spanName, service.name, kind, statusCode, statusMessage, durationNano, and timestampNs. Groups collapse individually, and pinning one keeps it at the top for every span you check next.
When to use it. Any time Waterfall or Flame Graph has told you which span is the problem, and you need to know why. Here, the http group confirms this was a POST to /api/v1/builder/widget/multi-data that still returned a 200, indicating the failure is internal, not a bad request from the client.
Turn any value into a filter
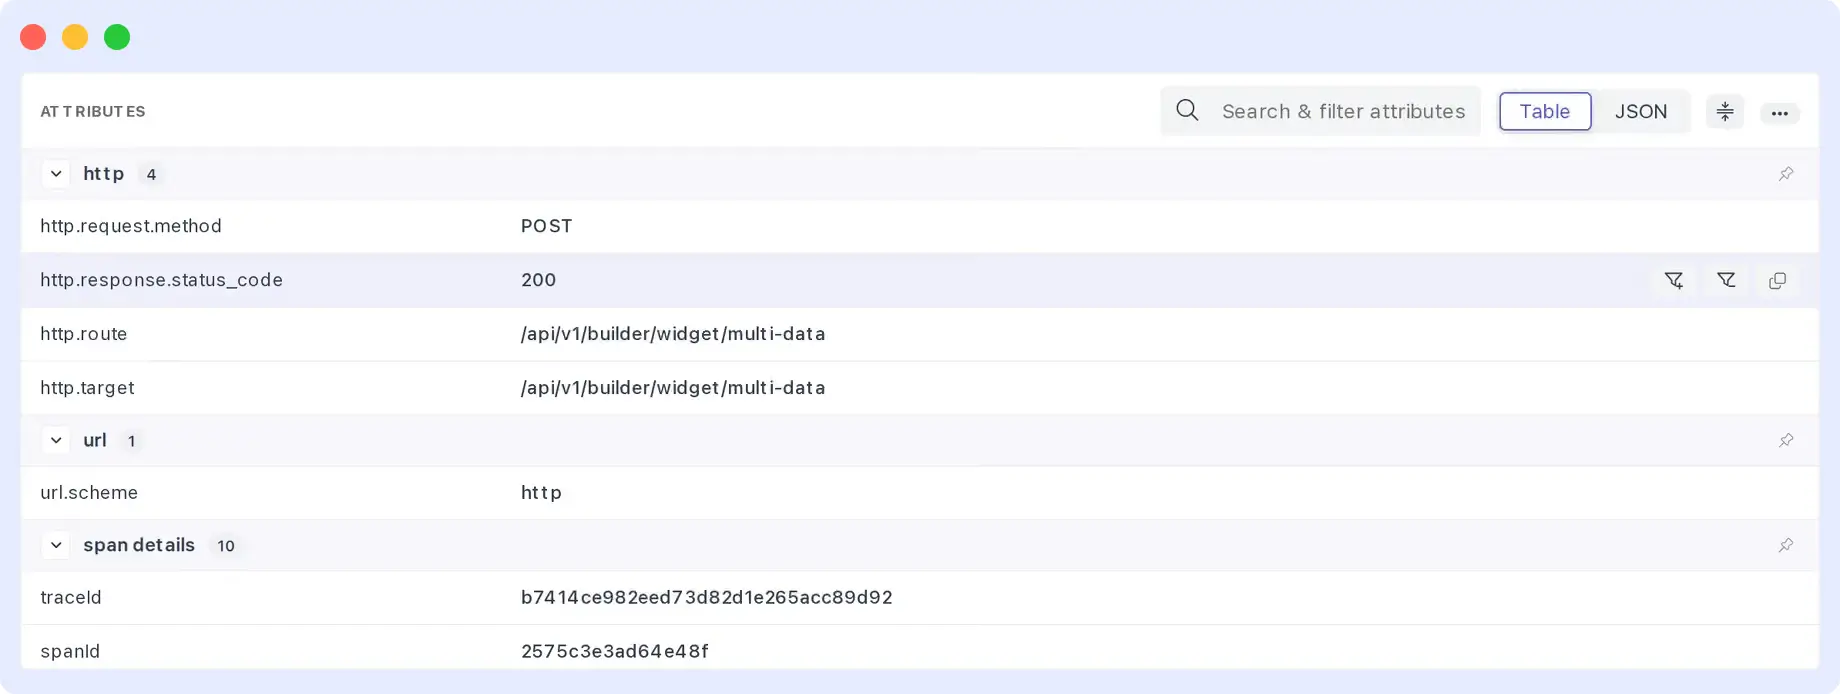
How it works. Hover a row, and three actions appear: Filter by value, Filter out value, Copy value. Long values, SQL statements, JSON payloads, and stack traces get their own formatted block, with syntax highlighting, indentation, and Show more/Show less for anything longer than a few lines.
When to use it. The moment you suspect this isn’t an isolated failure. Filter by that status code or route, and you’ll find out in one click whether other traces share it.
JSON view
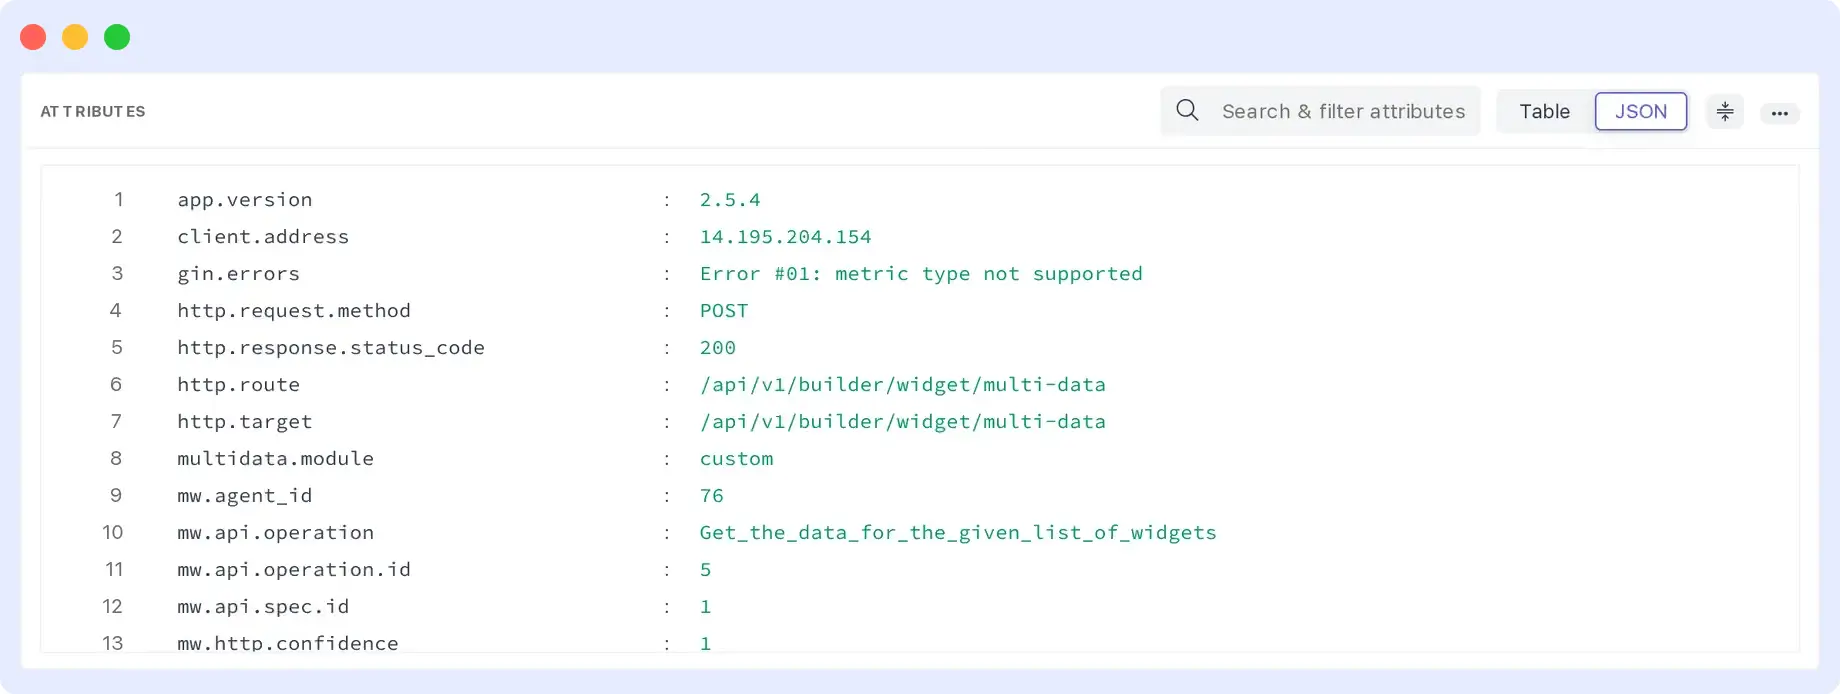
How it works. The Table/JSON toggle swaps the grouped list for a line-numbered JSON document while preserving any active search terms or filters.
When to use it. When you want to copy a full attribute set somewhere else, or when a custom field like gin.errors is easier to read as raw JSON than nested under a nonstandard group.
View settings
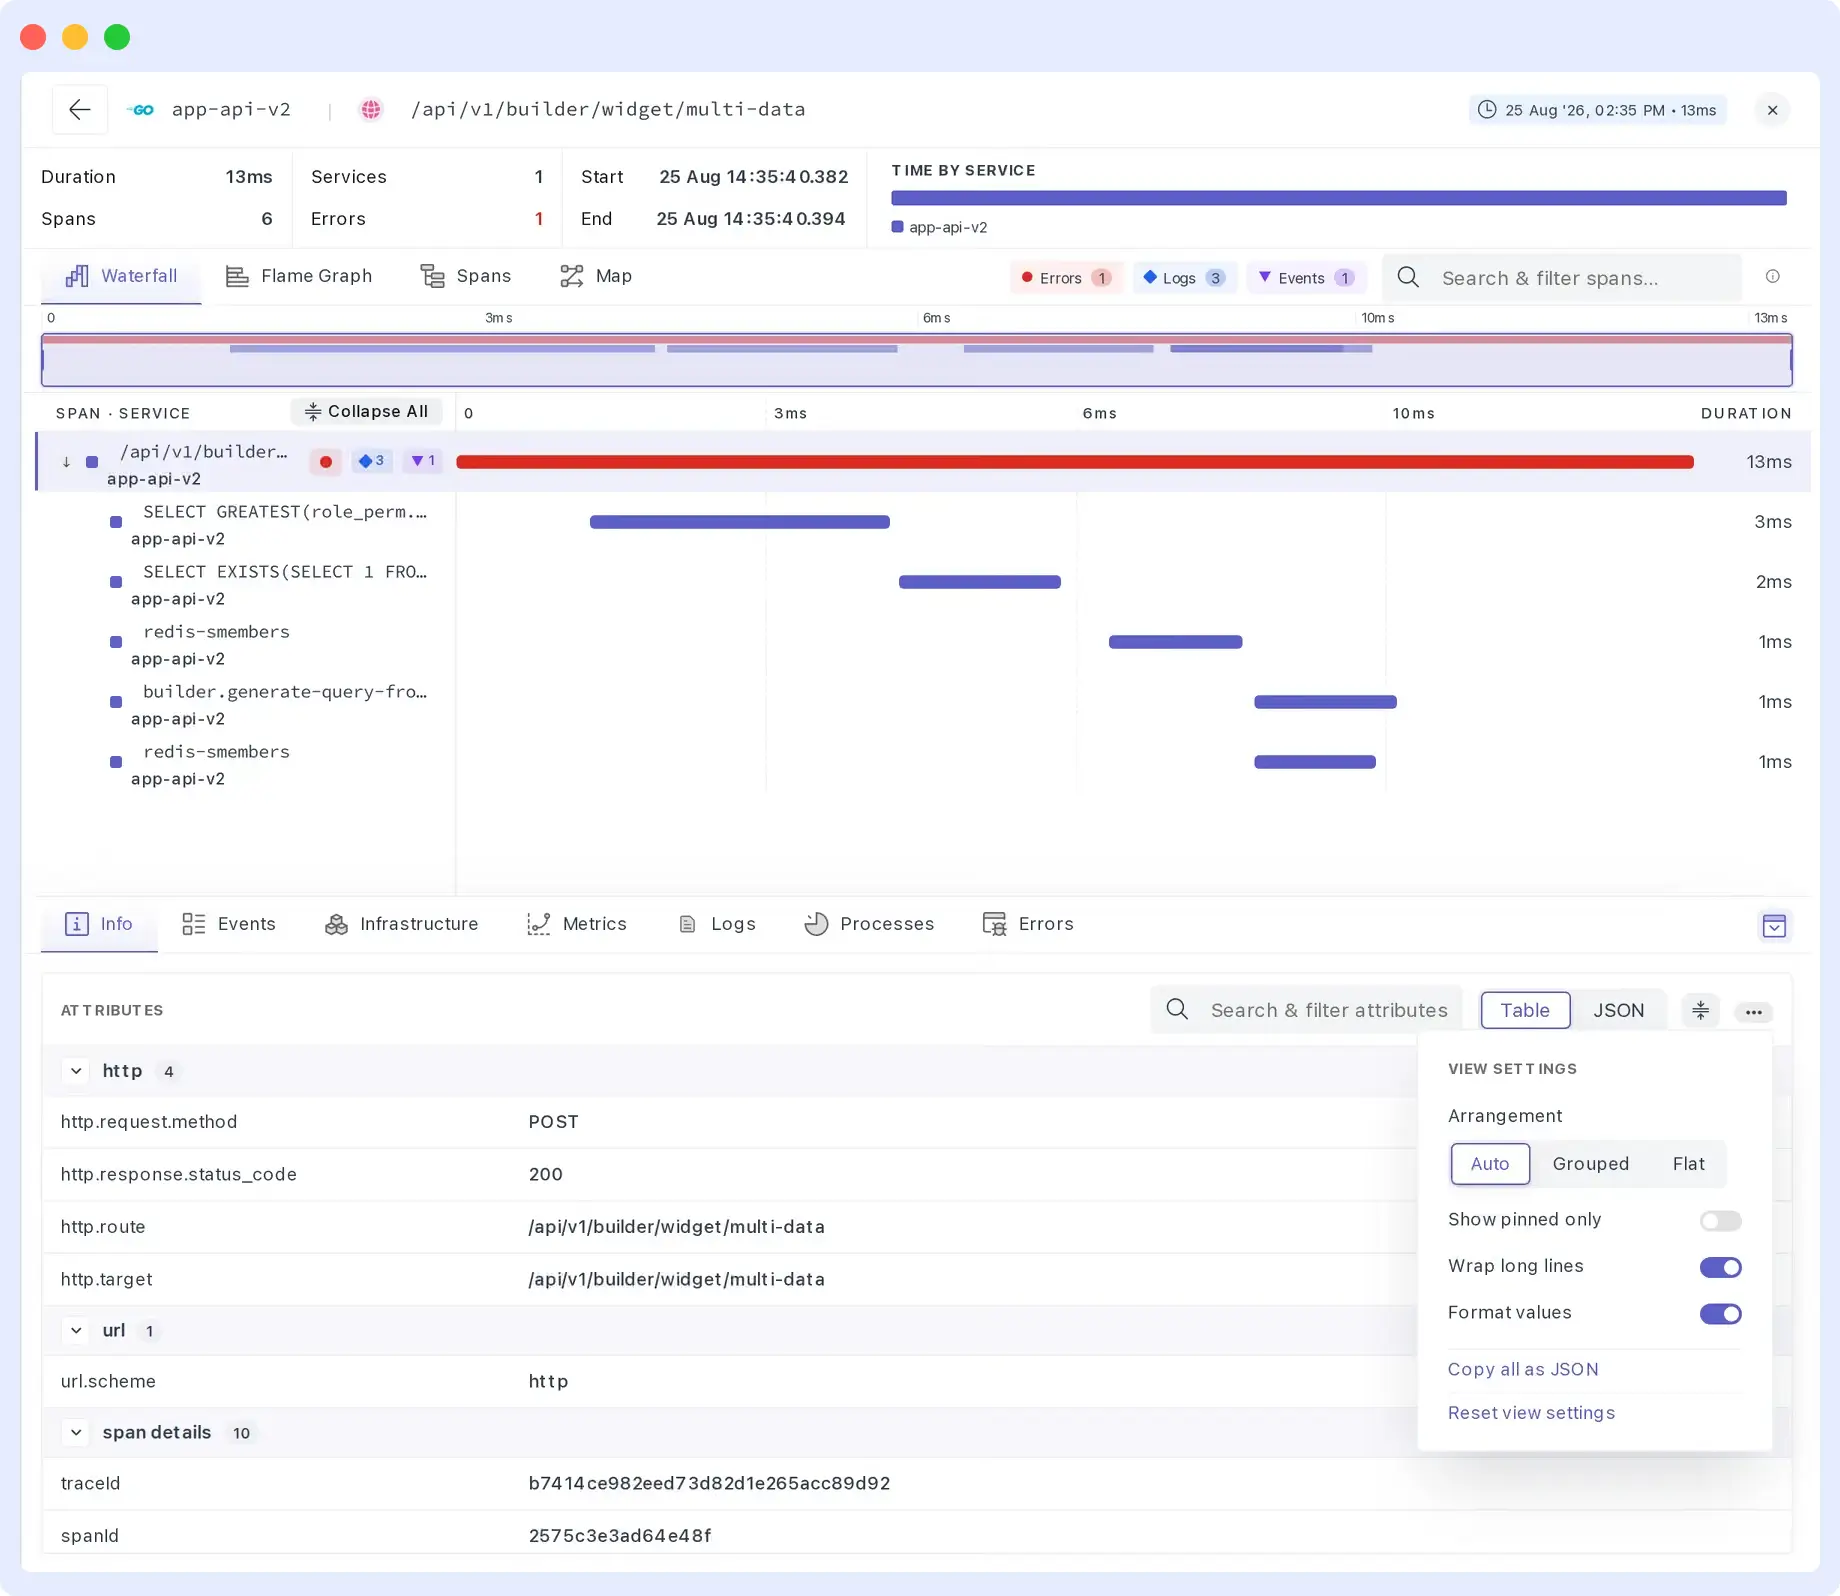
How it works. Auto arrangement orders groups by span type; a database span lists DB first. Groups are ordered alphabetically. Flat drops the group headers entirely and lets you pin individual attributes. Show pinned only, Wrap long lines, and Format values are toggles that persist between sessions.
When to use it. Flat plus pinning is worth setting up once if you check the same two or three fields, like a tenant ID or a feature flag, on every span you investigate. It saves you from re-expanding the same groups every time.
Events and the exception trail
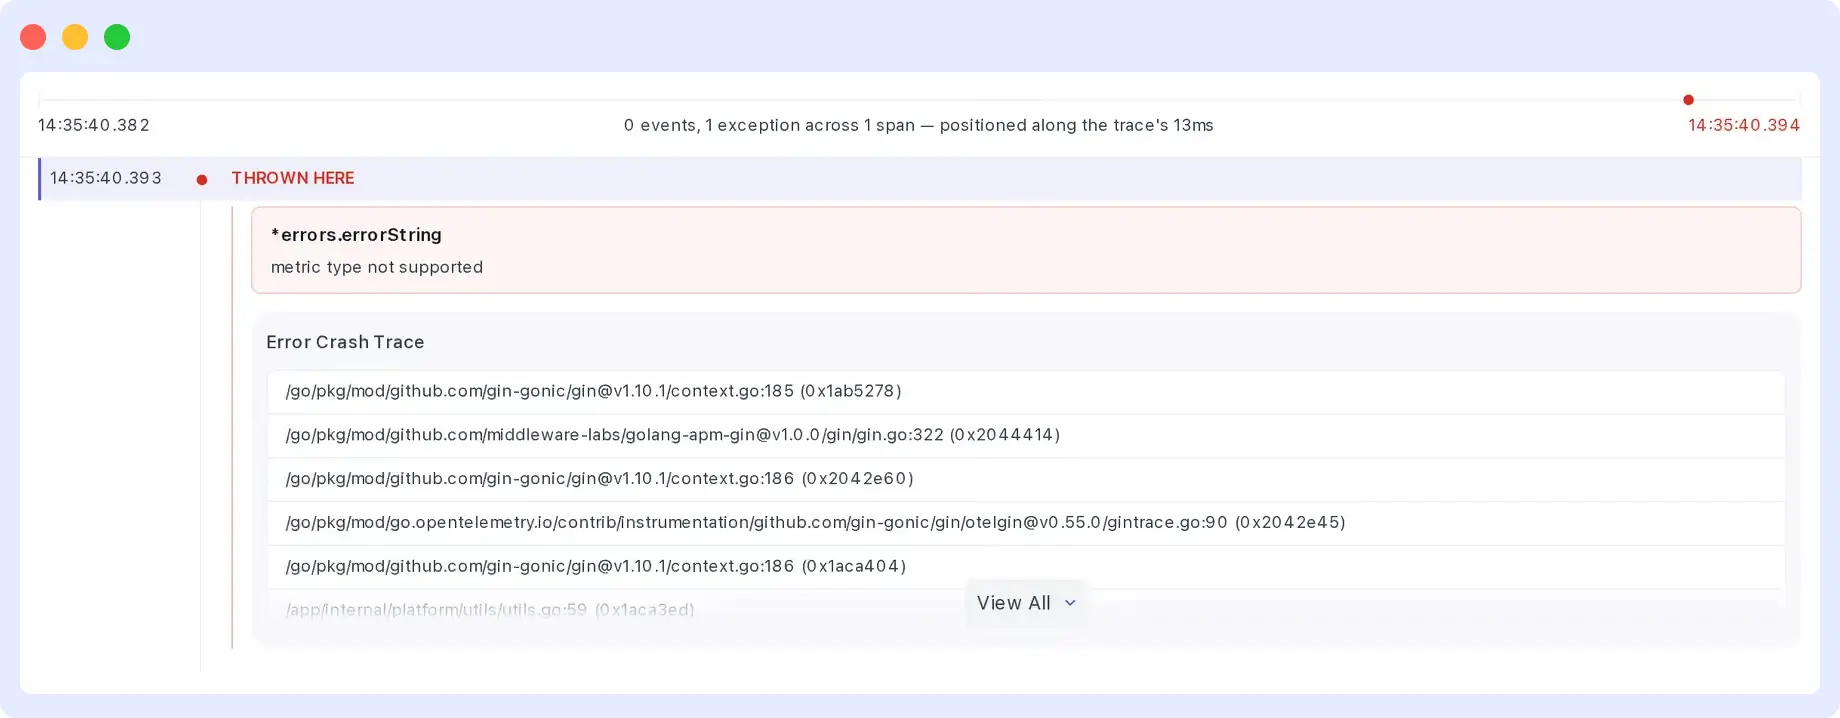
How it works. Events and exceptions are listed in order, with a timeline across the top showing where activity clusters. Events on the selected span are highlighted; events from other spans stay visible too, dimmed and labeled, so you don’t lose the surrounding sequence. When a span throws, the timeline marks it as Thrown here, followed by the exception type, message and full stack.
When to use it. This is where the incident actually resolves. Here it reads *errors.errorString: metric type not supported, with the stack pointing straight into the Gin middleware. That’s the difference between “something failed” and a line of code to open a PR against.
How to debug a failing trace, step by step
Putting the last few sections together, here’s how an incident like this actually plays out end to end:
- Time by Service says it’s entirely app-api-v2.
- The Errors chip is at 1, so filter to it.
- Waterfall shows the shape: one parent request, two SQL queries, two Redis calls, and the parent is the one that errored.
- The Flame Graph confirms that the SQL queries are the slow part.
- Spans, sorted by % Exec, back that up.
- Attributes show a POST that still returned 200, so the failure is internal.
- Events show exactly where it threw, and the stack.
Seven steps, one panel, no re-finding your place between any of them. As a general checklist for any slow or failing request:
- Check Time by Service to find the biggest contributor to the trace’s duration.
- If there are errors, turn on the Errors filter.
- Open Waterfall to see exactly where the failure happened.
- Switch to Spans and sort by % Exec to confirm the costliest operations.
- Select the span and check its attributes: query, route, status code.
- Open Events to read the exception and its stack.
- Turn a key attribute into a filter to see if the same issue shows up elsewhere.
That last step is easy to skip, but it’s often the most useful. Knowing why one request failed is good. Knowing whether it’s a one-off or a recurring pattern is what tells you how urgently to act, whether you’re tracing a single service or a large microservices fleet.
Faster with the keyboard
A few shortcuts speed up navigation once you’re inside a trace:
- Cmd/Ctrl + scroll zooms the timeline in Waterfall and Flame Graph
- Drag pans across either view, or moves the minimap window
- Up/Down arrows move the selection between spans in Waterfall and Spans view
- Drag a column edge resizes it in Spans view; drag a header reorders it
The full shortcut list is available from the info icon at the end of the navigation strip.
Trace Explorer sits inside Middleware’s broader application performance monitoring platform, alongside service maps, continuous profiling, and OpenTelemetry-native ingestion. It correlates with Real User Monitoring sessions when a backend trace originates from the frontend.
Try it on your own traces
Trace Explorer is live now in Middleware APM. Go to APM → Traces, click any row, and it opens right there, no setup beyond the OpenTelemetry instrumentation you already have. Want to go deeper first? Read the Trace Explorer docs for how the Flame Graph, Span List, and span attributes work together, or book a live walkthrough with our team.
FAQs
What is the Trace Explorer in Middleware?
A panel in Middleware APM that shows one distributed trace through four linked views, Waterfall, Flame Graph, Spans, and Map, plus attributes, events, logs, infrastructure, and metrics for whichever span is selected.
How do I open a trace in Middleware?
Go to APM → Traces and select any trace. The panel opens above the trace list without losing your current filters.
Which view should I check first?
Waterfall, for most traces. It shows call order and structure fastest. Switch to Flame Graph to spot the slowest span by eye, or Spans to sort every span by duration or share of execution time.
What is the difference between the Waterfall and Flame Graph views?
Waterfall shows spans as an indented hierarchy against a timeline, good for call order and parent-child relationships. Flame Graph shows the same spans as an icicle chart sized by duration, good for spotting the widest, slowest bars at a glance.
Can I filter a trace to only show errors?
Yes. The Errors highlight filter restricts every view to spans with an error status, and it combines with the Logs and Events filters.
Does Trace Explorer work with OpenTelemetry?
Yes. Middleware is OpenTelemetry-native, so traces sent through OTLP populate Trace Explorer without a schema translation step.
Can I turn a span attribute into a filter?
Yes. Hover any attribute row in the Info tab to see Filter by value and Filter out value, which apply that attribute as a filter and return you to the trace list.
Can I see a span's attributes as raw JSON?
Yes. The Table/JSON toggle above the attribute list switches to a line-numbered JSON document that reflects whatever search terms or filters are already applied.

