In an age where digital expectations continually surge, businesses face the daunting challenge of not only meeting but exceeding user demands. It’s in this high-stakes arena that Application Performance Monitoring (APM) emerges as the linchpin, ensuring optimal application performance and delivering an unmatched user experience.
APM involves monitoring, managing, and optimizing software applications to drive business success.
This guide provides a comprehensive overview of APM, including monitoring importance, functionality, benefits, challenges, key metrics, top tools, best practices, and its relationship with observability.
What is Application Performance Monitoring?
Application performance monitoring is the process of tracking, monitoring and improving the performance and real-time availability of software applications.
It involves tracking various metrics and key performance indicators (KPIs) to gain insights into application performance, detect and diagnose issues, and optimize performance.
- It enables real-time monitoring of applications, capturing telementry data and metrics such as response time, latency, resource usage, and error rates.
- APM tools aid in issue diagnosis and troubleshooting by providing visibility into application components, dependencies, and transactions.
- APM supports performance optimization by identifying bottlenecks, optimizing applications, improving scalability, and enhancing the user experience.
Why is Application Performance Monitoring Important?
Modern businesses heavily rely on applications for daily operations and customer interactions, encompassing websites, mobile apps, backend systems, and cloud-based tools.
Performance issues, such as slow or unresponsive applications, can result in user frustration, customer churn, revenue loss, and brand reputation damage, which can have significant implications for companies.
APM helps organizations proactively identify and address performance bottlenecks, improve user experience, increase efficiency, and ultimately drive business success.
- Proactive Issue Detection: It helps identify performance issues before they impact users, allowing for timely resolution and preventing downtime or slowdowns
- Enhanced User Experience: APM ensures optimal application performance, reducing latency and improving responsiveness for a better user experience.
- Business Impact: It directly affects business outcomes by preventing revenue loss, increasing customer satisfaction, and protecting brand reputation.
- Efficient Troubleshooting: APM provides insights into application components, dependencies, and transactions, accelerating troubleshooting and reducing mean time to resolution (MTTR).
- Resource Optimization: it helps identify inefficiencies and optimize resource allocation, improving scalability and reduced operational costs.
- Improved Compliance and Security: With APM, organizations can meet regulatory requirements and ensure application security by detecting potential vulnerabilities and anomalies.
- Better Decision Making: APM provides valuable insights and data to inform business decisions, such as capacity planning, investment prioritization, and technology roadmapping.
The Core Features or Use Cases of APM
To effectively monitor and manage application performance, APM comprises various features that work together to provide comprehensive insights. These use cases offer visibility into different aspects of an application, enabling organizations to diagnose issues, optimize performance, and ensure a seamless user experience.
In this section, let’s explore the key components that make up APM and understand their roles in monitoring and improving application performance.
Runtime Application Architecture
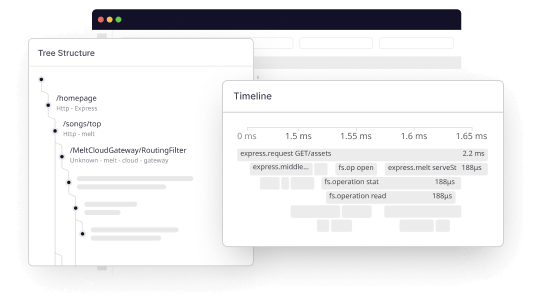
The Runtime Application Architecture component in APM provides a comprehensive understanding of an application’s structure and how its various components interact with each other. It offers visibility into the relationships and dependencies among different elements of the application stack, including servers, databases, APIs, and third-party services
Key features of this component include:
- Dependency mapping for understanding component relationships.
- Visual representations to facilitate performance visualization.
- Impact analysis to assess the effects of changes.
Real User Monitoring (RUM)
RUM in APM focuses on capturing and analyzing user interactions with the application in real-time.
It provides valuable insights into the user experience by measuring factors such as page load times, transaction durations, and overall performance from the end-user’s perspective.
Synthetic Monitoring
Synthetic Monitoring is a component of APM that involves creating simulated user interactions with an application. These interactions replicate real user behavior and are used proactively to test and monitor the application’s performance. By simulating various transactions and scenarios, organizations can assess the application’s responsiveness, availability, and functionality.
Agentless monitoring
Agentless Monitoring in APM gathers performance data without the need for installing agents or modifying application code. It offers a non-intrusive method to collect metrics and monitor the application’s performance and health.
Business Transactions
Business transactions are a crucial component of APM that focuses on monitoring and tracking critical activities within an application that directly impact business operations.
A business transaction represents a sequence of steps or interactions that occur during a specific business process, such as online purchases, form submissions, or user registrations.
- Gain insights into the flow and execution of transactions across application components.
- Trace the path of a transaction through different layers of the application for efficient troubleshooting.
- Collect and analyze transaction-related metrics like response time and error rates for performance optimization.
Component Monitoring
Component monitoring is a fundamental aspect of APM that focuses on tracking the individual components and services comprising an application.
It involves monitoring the performance, health, and availability of each component to identify issues or bottlenecks that may affect overall application performance.
- Alerting and notifications are essential for prompt issue resolution.
- Performance analytics provide insights into resource utilization and response times.
- Dependency mapping helps understand component dependencies and their impact.
Analytics and Reporting
Analytics and reporting aim to analyze performance data and create informative reports. They offer organizations valuable insights for optimizing application performance, making informed decisions, and fostering continuous improvement.
- Data analysis helps identify patterns and trends.
- Visualization of performance data is achieved through charts and dashboards.
- Customized reports can be tailored to specific requirements.
- Trend analysis tracks performance changes over time.
How Does Middleware APM Work?
Middleware’s APM dashboard is a powerful tool that provides real-time insights into your application’s performance. It helps you identify and resolve issues before they affect end users.
Middleware allows you to select a specific time period for viewing your application’s performance data. This feature is essential because it enables you to analyze performance trends over different periods, such as minutes, hours, days, weeks, or months.
Pre-monitoring step: Agent installation
Before you can start monitoring, you’ll need to install the language-specific APM agent corresponding to your application. Middleware offers and supports APM agents for Node.js, Go, Python, Java, and PHP. You can find installation instructions here.
APM Dashboard
Once the agent is stalled, you will begin to see data in your dashboard. Middleware’s APM dashboard provides real-time insights into the application’s usage patterns, response times, and success and error rates, enabling you to quickly and efficiently identify and resolve issues.
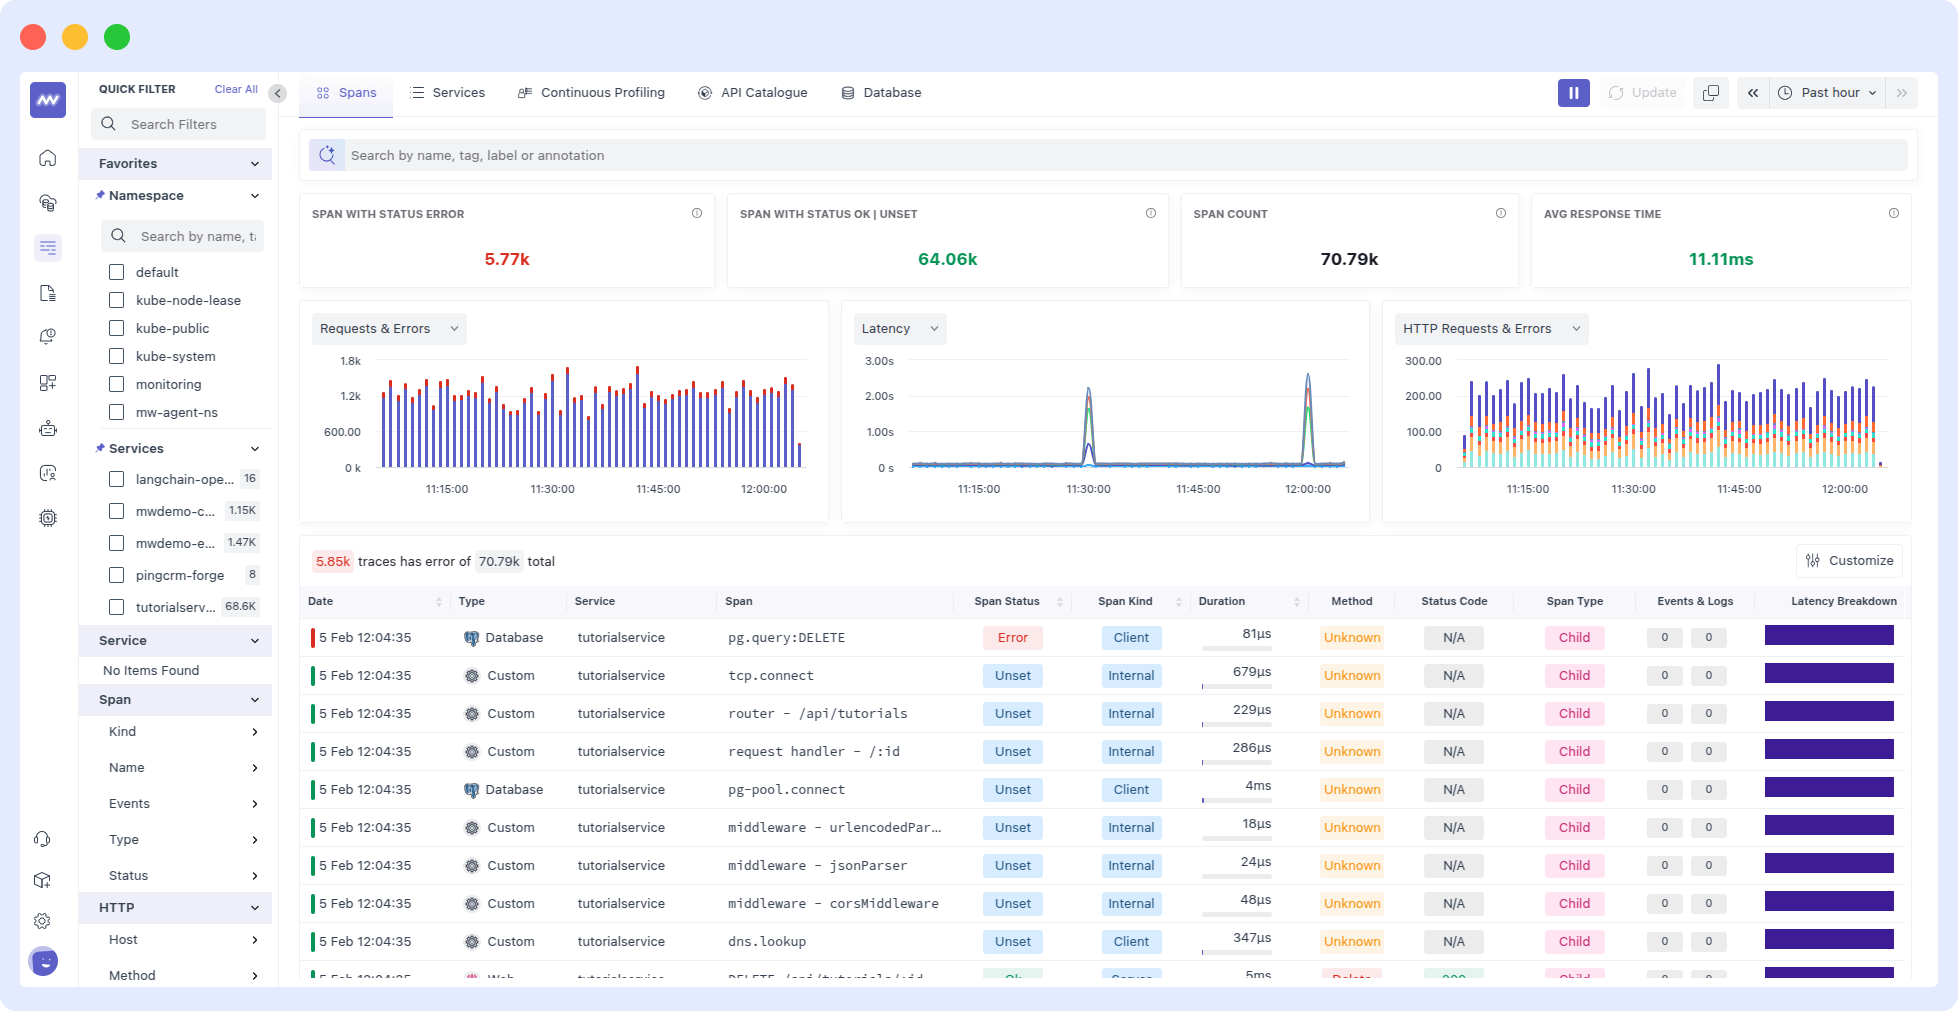
Trace list
The Traces graph displays the number of hits your application receives over a selected time range.
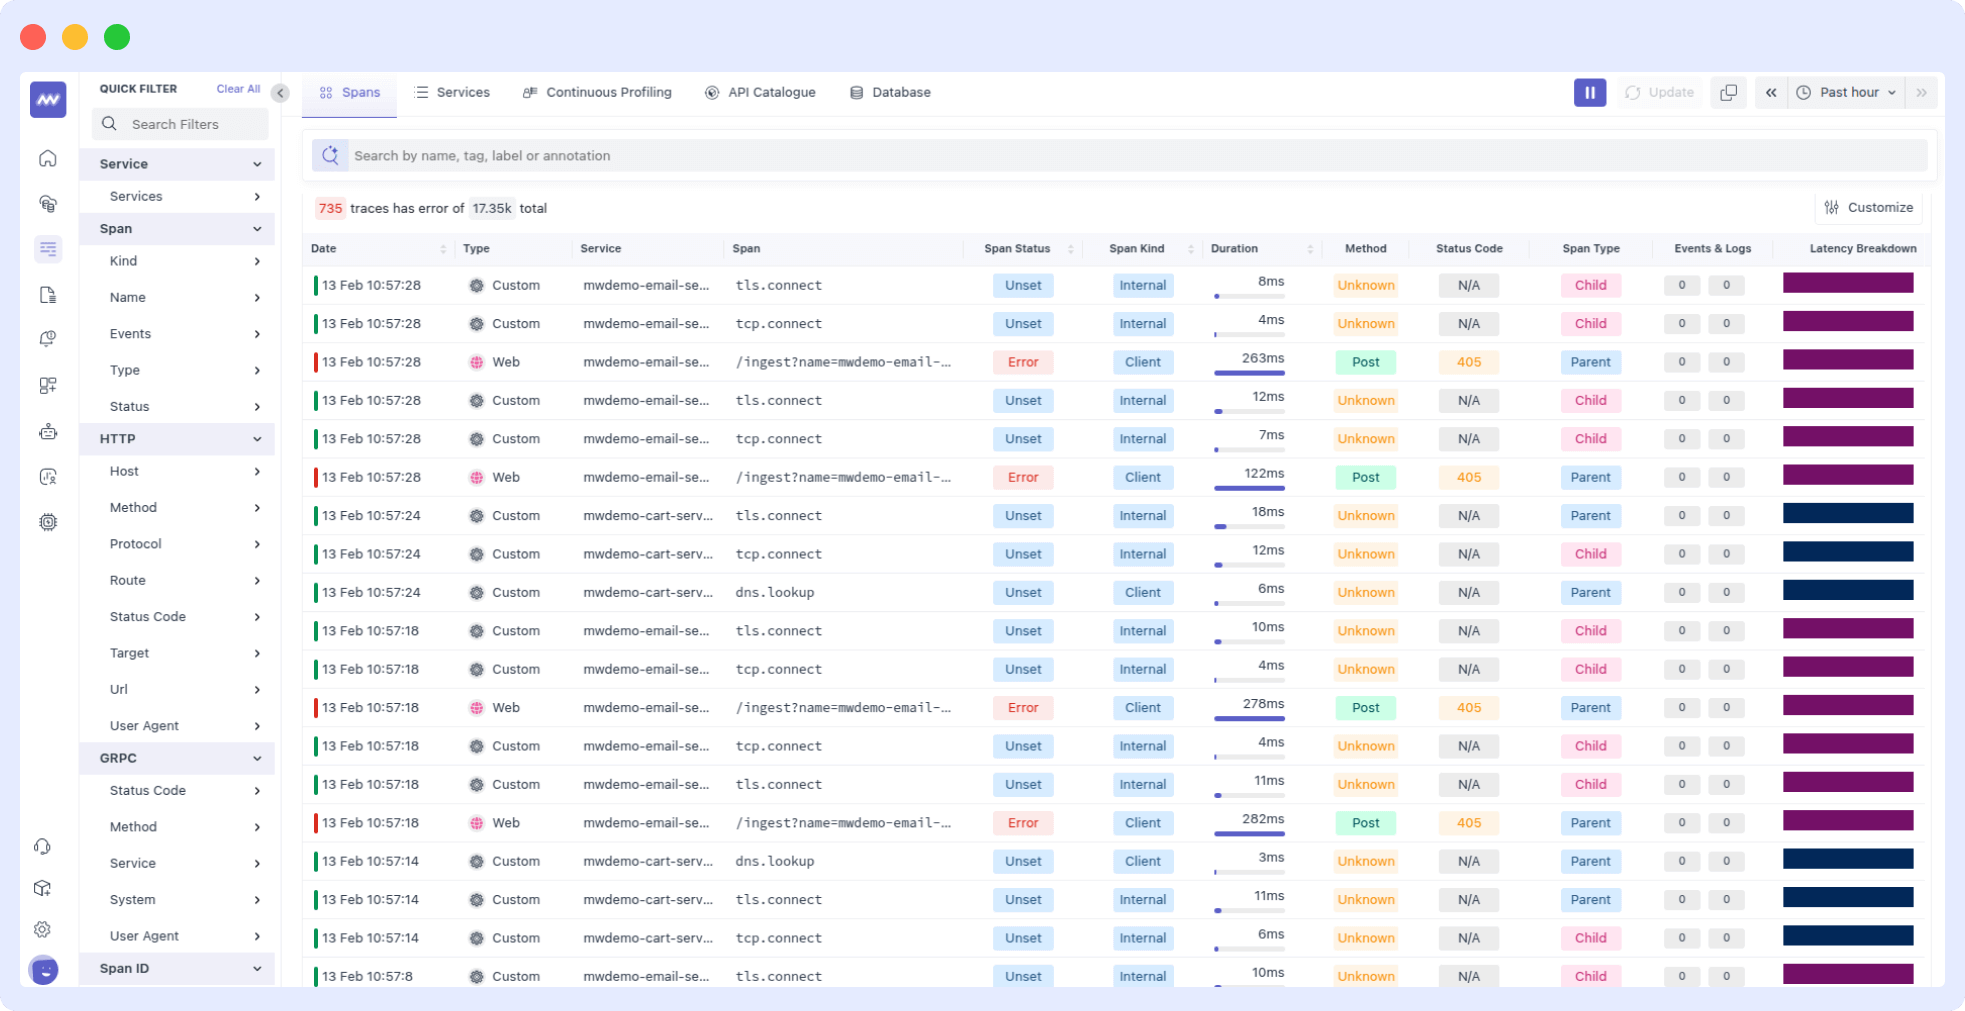
This graph helps identify peak usage periods, track changes in usage patterns, and monitor your application’s load.
Error Traces
The Errors graph displays the number of error hits in the selected time range vs. error hits. It is a graphical representation of failed transactions in your application.
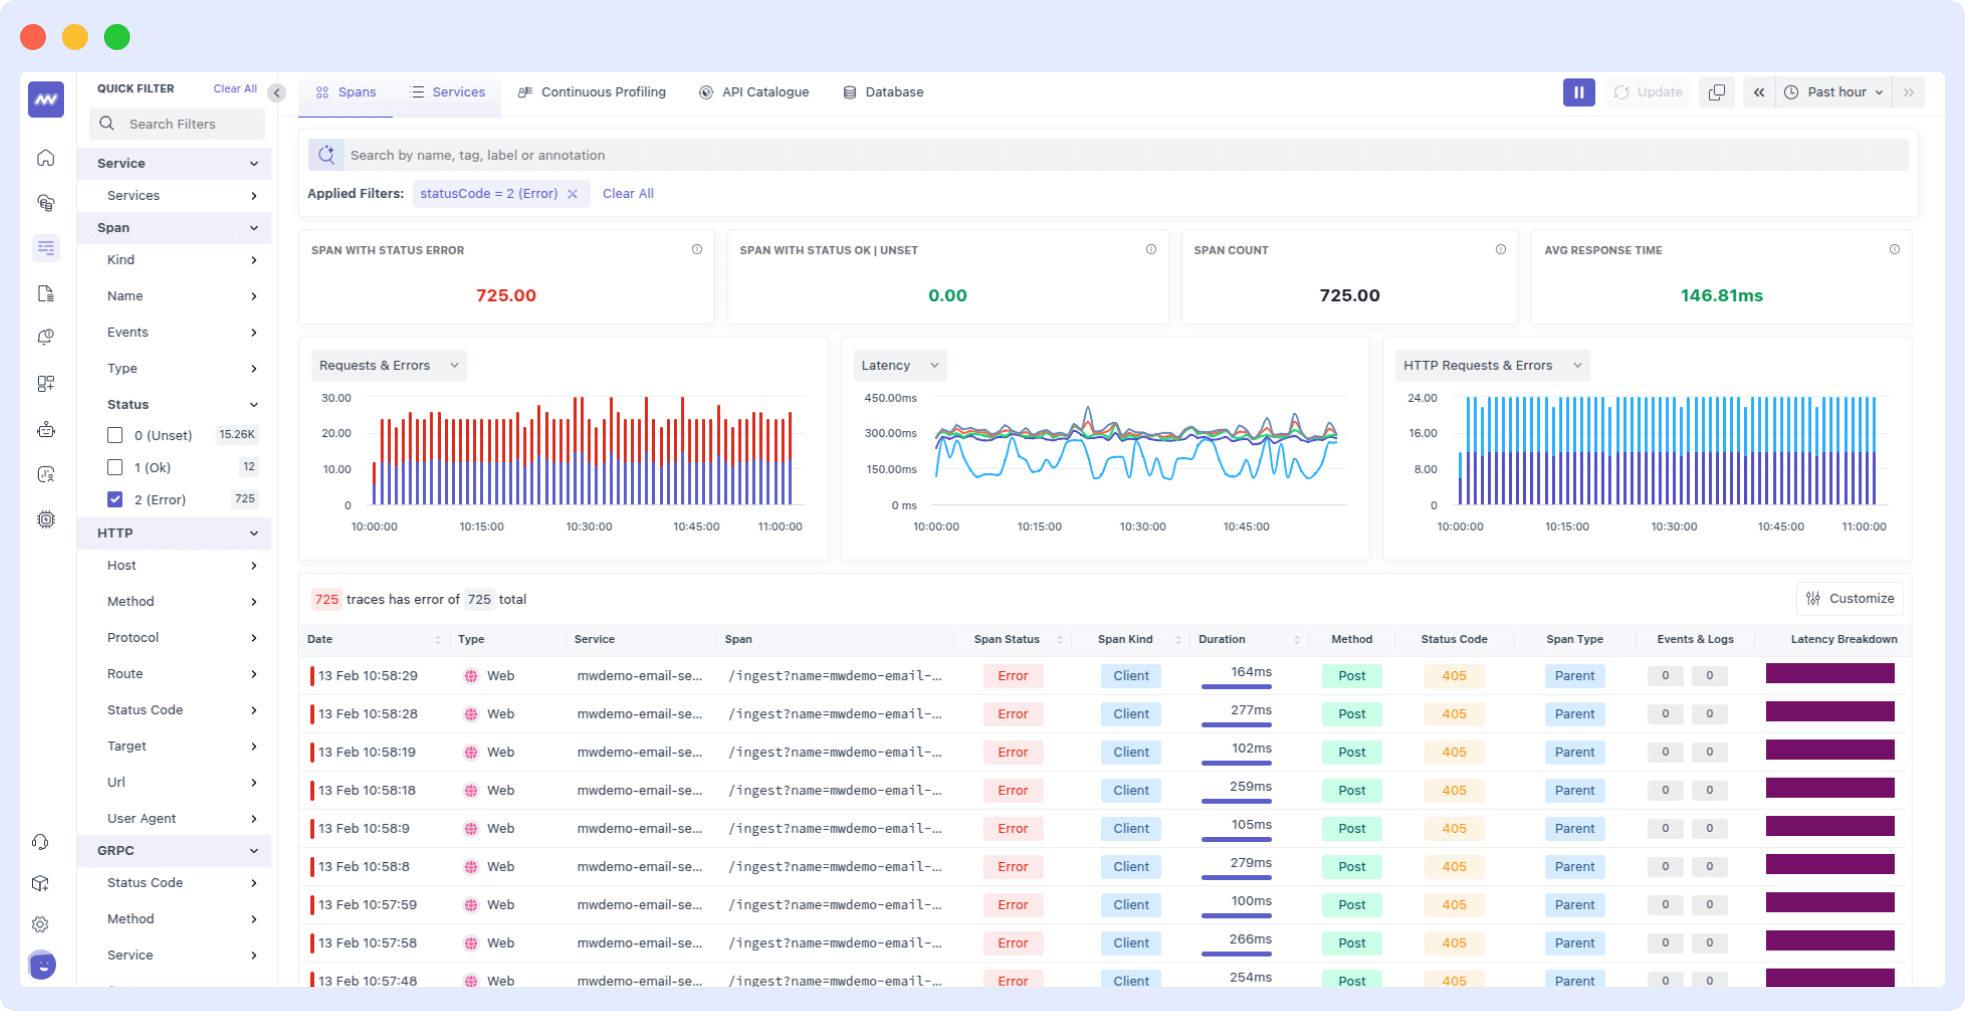
This graph allows you to monitor your application’s health and detect changes in the error rate. It helps track performance and identify potential issues that could impact user experience.
Real-time insights
Middleware’s APM provides real-time insights into your application’s performance, enabling you to identify and resolve issues quickly. With this, developers can monitor application performance, track user behavior, identify performance bottlenecks, and optimize application performance.
They can also view real-time data on their application’s response times, throughput, and error rates, analyze how users are interacting with the application, pinpoint areas of your application that are causing performance issues, and use real-time data to optimize your application’s performance.
Alerting and notification
Developers can set up real-time alerts and notifications on Middleware’s APM for specific events or thresholds. This helps stay on top of issues if and when they arise. They can set custom thresholds for key metrics, such as response times or error rates, and receive alerts when those thresholds are exceeded.
Middleware also offers real-time notifications via email, SMS, or other notification channels, integrates with incident management tools to streamline incident response and resolution, and allows developers to customize alerting rules based on specific conditions, such as changes in user behavior or application performance.
Challenges associated with APM
While APM offers numerous benefits, its implementation can present certain challenges.
Let’s explore some common challenges and potential solutions:
Selecting the Right Metrics to Monitor
Organizations often grapple with the selection of relevant performance metrics among the vast array available. Determining which metrics align with business goals and accurately reflect application performance can be challenging.
Solution
To address the challenge of selecting the appropriate metrics for monitoring, organizations should follow a systematic approach.
This involves aligning chosen metrics with specific business goals, considering the unique characteristics of their applications, and collaborating with stakeholders to identify key performance indicators (KPIs) that offer meaningful insights.
Here are some key APM metrics that you need to look at…
- Response time: The duration an application takes to respond to a user’s action.
- Error rate: The occurrence frequency of errors within the application.
- Request rate: The volume of requests an application receives per unit of time.
- Application availability (uptime): The total operational time during which the application is accessible.
- CPU usage: The amount of processing power consumed by the application.
- Latency: Latency is the delay in data transmission between a source and destination, measuring the time taken for a user’s request to reach the server and return a response.
- Application performance index (Apdex) score: A measurement of the app’s performance relative to predefined “normal” performance standards.
- Service level agreement (SLA) score: A metric defining the expected service quality, calculated using response time, error rate, uptime, and request volume over a specific period.
Leveraging industry best practices and consulting with APM experts can also aid in informed decision-making.
Choosing the Correct APM Tool
Selecting and utilizing the right APM tool tailored to an organization’s needs and infrastructure is crucial. Without the proper tool, organizations may struggle to gain accurate and comprehensive insights into application performance.
To overcome this challenge, organizations should conduct thorough research and evaluation of various APM tools available in the market.
Consider factors such as specific application requirements, scalability, ease of implementation and use, supported platforms, and integration capabilities.
Regularly reviewing and reassessing the chosen APM tool’s effectiveness and exploring new options can help ensure effective application monitoring and optimization.
Lack of Clear Goals
A common challenge during APM implementation is the absence of clear goals and objectives. Without well-defined strategies and objectives, organizations find it challenging to measure success and make informed decisions based on collected data.
We’d recommend organizations begin by establishing clear and measurable objectives for their APM initiatives.
This involves aligning APM goals with overall business objectives, such as improving application performance, enhancing user experiences, or increasing operational efficiency.
Setting specific and realistic goals allows organizations to focus their efforts and track progress effectively.
Top 3 APM Tools and Vendors
There are several excellent tools and vendors available in the market. In this section, we will discuss three top APM tools and vendors known for their robust features, reliability, and industry reputation.
Middleware
Middleware is a monitoring platform that specializes in complex, multi-tiered applications. It tracks the performance of web pages and APIs at various network levels, and you can easily deploy and scale with any environment like Docker, Kubernetes, and more.
- Visualize application performance and uptime data alongside key business metrics to find issues faster.
- Use a detailed time graph to find which step or endpoint has performance issues.
- View a breakdown of network timing data and response time by location for faster root cause analysis.
- View and drill down service maps with performance metrics, such as request rate, error rate, and latency.
- Predefined integrations with leading tech stacks (Java, Go, Python, Node, Cloudflare Worker).
Datadog
Datadog offers Synthetic Monitoring, which enables users to create code-free tests that simulate user transactions on applications and monitor key network endpoints across different layers of systems.
- Stay ahead of issues by proactively monitoring your endpoints through API tests.
- Easily capture critical transactions without writing any code using our fully hosted web recorder.
- Ensure secure monitoring of any environment by using your own private locations.
New Relic
New Relic is a cloud-based observability platform that offers real-time monitoring of software applications, infrastructure, and customer experiences.
- Detects low-performing entities such as URLs, APIs, and services proactively.
- Collaborate to resolve issues automatically generated from affected tests.
Leverage alerts and AI to seamlessly transition from synthetic checks to automatically generated tickets within AIOps.
Application Performance Monitoring Best Practices
As technology continues to evolve, it is essential for organizations to stay up-to-date with the latest practices to achieve success.
Here are some key APM best practices to consider in 2026:
Define Clear Objectives
Clearly define your goals and objectives for APM implementation. Identify the specific metrics and performance indicators that align with your business objectives and user expectations.
Monitor the Entire Application Stack
Monitor and trace application performance across the entire stack, including servers, databases, APIs, and third-party services. This holistic approach provides a comprehensive view of application performance and helps identify bottlenecks or dependencies impacting overall performance.
Implement Real-Time Monitoring
Use real-time monitoring to capture performance data and metrics continuously. Real-time monitoring allows for immediate detection and resolution of performance issues, reducing potential downtime and user impact.
Proactive Performance Testing
Conduct regular performance testing and load testing to identify performance bottlenecks and potential scalability issues proactively. Test applications under various conditions to ensure they can handle expected user loads and perform optimally.
Collaborate Across Teams
Foster collaboration between development, operations, and IT teams to effectively manage application performance. Encourage open communication, shared responsibilities, and cross-team knowledge sharing to address performance issues promptly.
Leverage Automation and AI
Utilize automation and AI capabilities offered by APM tools to streamline monitoring processes, identify anomalies, and gain actionable insights. Automation can help reduce manual efforts and enable faster problem resolution.
Continuously Optimize Performance
Regularly analyze performance data, identify trends, and take proactive steps to optimize application performance. Continuously monitor and fine-tune the application infrastructure, configurations, and code to improve overall performance.
Stay Updated with Industry Trends
Keep abreast of emerging technologies, industry trends, and best practices in APM. Attend conferences, participate in forums, and engage with industry experts to stay informed and leverage the latest advancements in APM.
By following these best practices, organizations can enhance their APM strategy, improve application performance, and deliver exceptional user experiences in the dynamic and competitive digital landscape of 2026.
APM vs. Observability
APM and observability are two closely related concepts in the field of application monitoring. While they share some similarities, they also have distinct characteristics. In this section, we will explore the differences between APM and observability.
| APM | Observability |
| Focuses on monitoring and managing the performance and availability of applications. | Emphasizes a broader approach to understanding system behavior and performance. |
| Provides specific metrics and insights into application performance, including response time, error rates, and resource usage. | Offers a more holistic view of the system, capturing data from various components and layers, including infrastructure, application code, and dependencies. |
| Helps in identifying and diagnosing application performance issues, optimizing application performance, and improving user experience. | Enables deep visibility into complex systems, making it easier to understand and troubleshoot issues, even in highly distributed and dynamic environments. |
| Primarily used by development and operations teams to monitor and manage application performance. | Widely used by various stakeholders, including developers, operations, and business teams, for a comprehensive understanding of system behavior and performance. |
| Generally relies on pre-defined metrics and instrumentation within the application. | Leverages flexible data collection methods, such as logs, metrics, and traces, to provide a more flexible and adaptable monitoring approach. |
APM primarily focuses on monitoring and optimizing application performance, while observability provides a broader understanding of system behavior and performance. It is a subset of observability, offering specific metrics and insights into application performance.
Application performance monitoring is a critical practice for ensuring optimal performance, availability, and user experience of software applications.
By using APM tools and techniques, organizations can monitor and track various performance metrics, diagnose issues, optimize performance, and improve collaboration among teams.
Take the next step. Try Middleware for free.