
APIs have significantly changed the way modern software applications are developed. They allow communication and transfer of information between different systems. As many organizations now adopt the API-first design, developers, DevOps, and Product teams need to understand how APIs work.
Measuring these APIs’ performance is an important thing to consider because it helps assess their dependability. We’ll go over some crucial API metrics in this post that will enable you to monitor your API’s usability, performance, and functionality.
What are API Metrics?
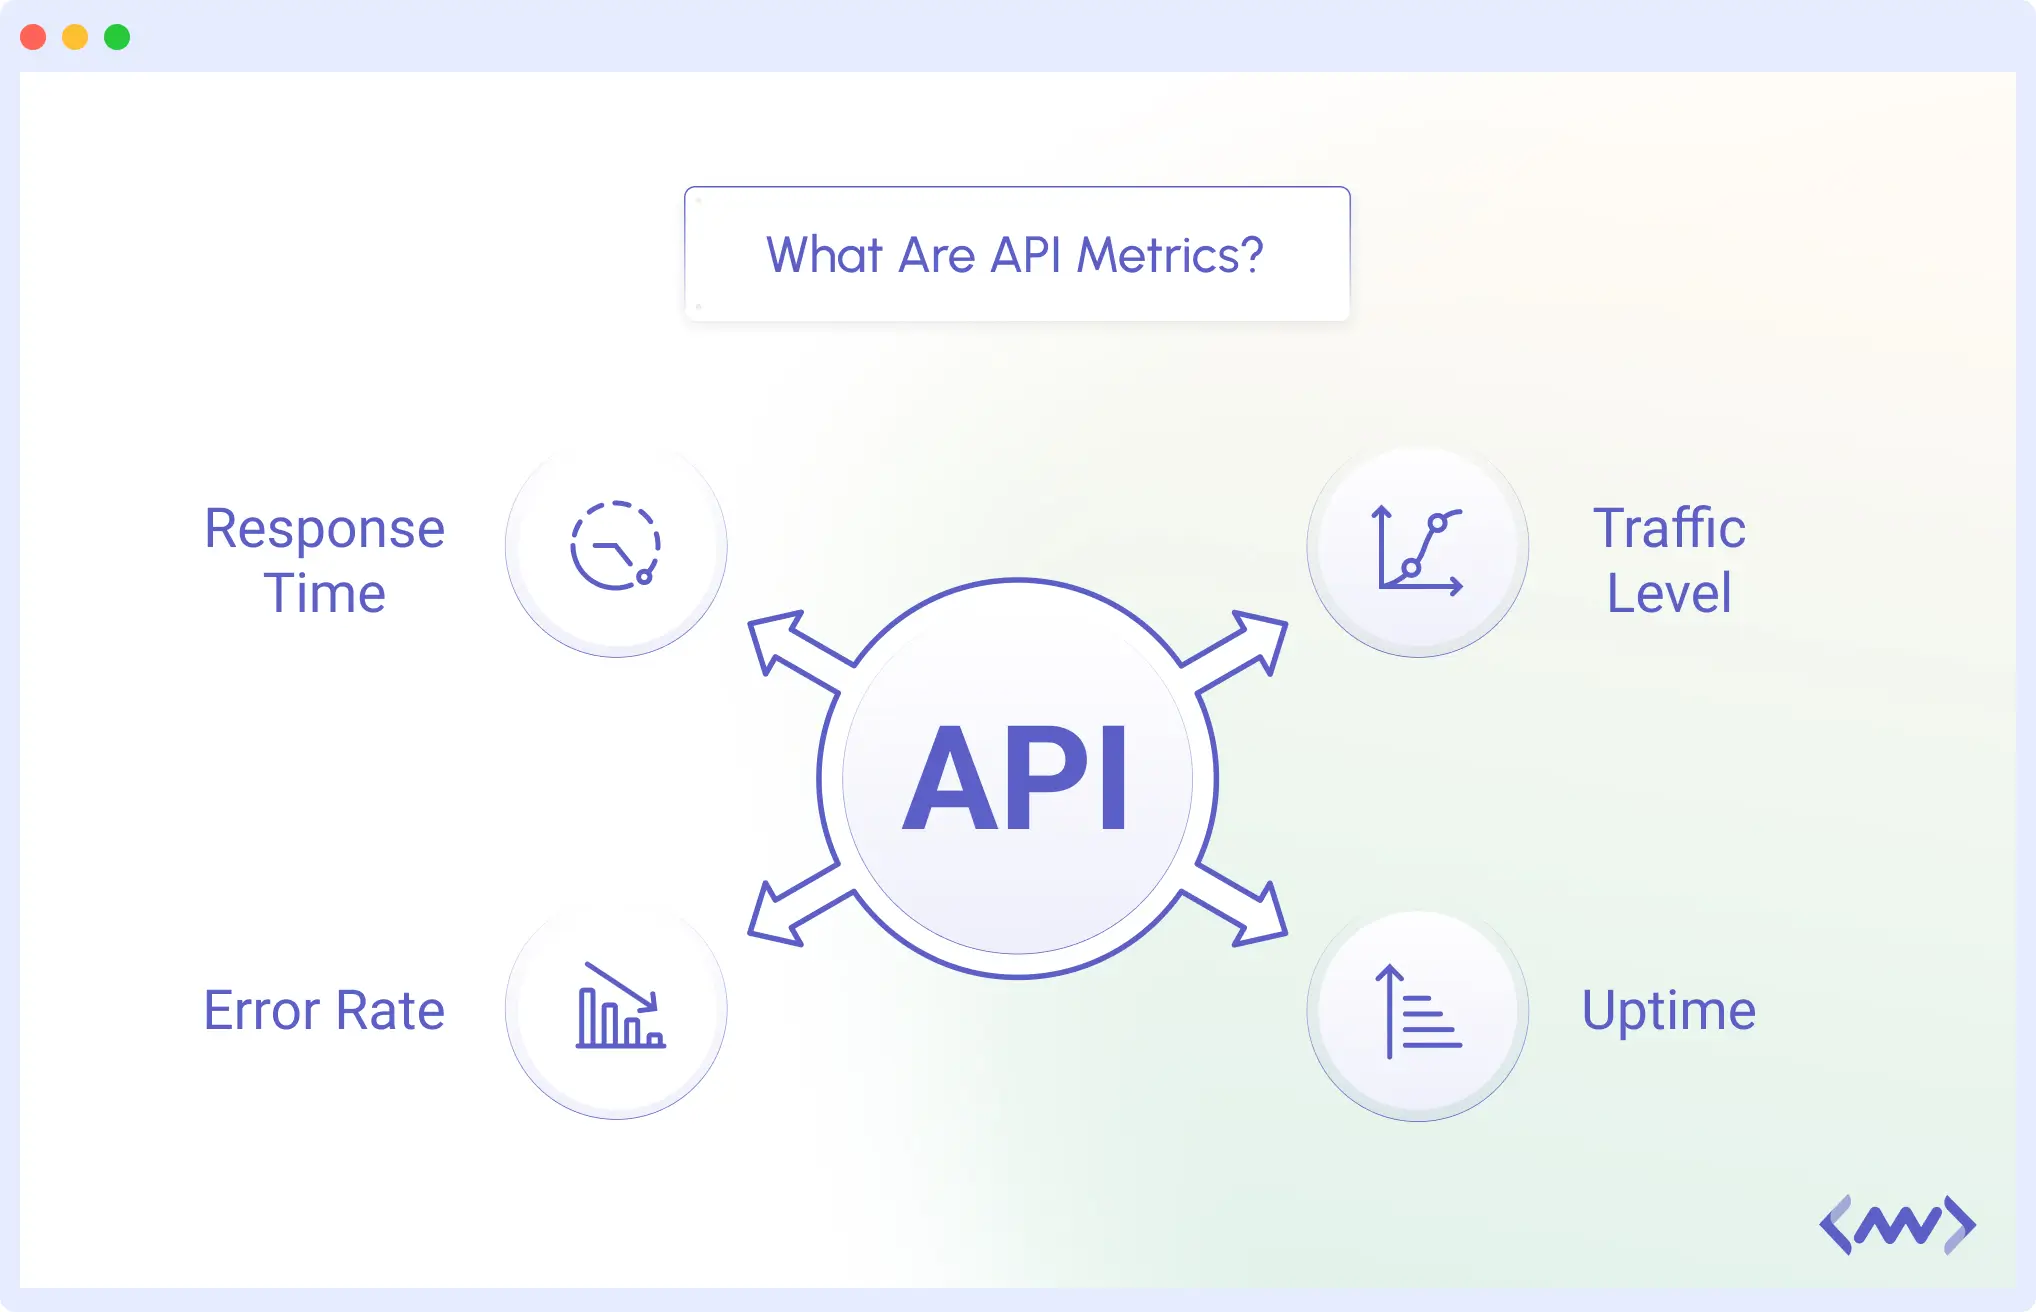
API metrics are quantifiable indicators enabling you to monitor the performance of your API. They indicate how stable and quick your API is under request processing. These metrics give you a clear picture of items like response time, traffic level, error rate, and uptime, so you can rapidly find issues and enhance the performance of your API.
You have to always monitor these metrics to keep your API current. Here are a few justifications for why tracking API metrics is crucial:
- Enhance the user experience: Users can become very irritated with APIs that are slow or constantly throwing errors. You can make sure that your APIs react promptly and error-free by regularly monitoring their performance metrics.
- Improve security: Unauthorized users may attempt to access your API without your knowledge. Monitoring will enable you to identify these risks early and take appropriate action. Use Infrastructure Monitoring to track traffic patterns, detect abnormal spikes, and monitor unauthorized or suspicious access attempts across your stack.
- Understand Usage patterns: Metrics display the number of users interacting with your API as well as the endpoint that they most frequently use. The product team will use this to determine when to add new features or scale.
Essential API Metrics to Monitor
It is good for you to know the API metrics you need to monitor. This section covers some categories of API metrics, with the key things you should be monitoring.
1. Performance Metrics
Performance metrics measure how fast and efficiently your API can respond to requests. They show how the API behaves under different loads, how quickly it can send data, and how much data it can transfer. These metrics improve speed and user experience.
- Latency/Response Time: Latency is the time your API takes to respond after a request from someone. Your latency is, say, 200 milliseconds if that is how long it takes to receive a response. The lower the number, the faster your API feels. To proactively track and optimize API latency, consider using Synthetic Monitoring, it simulates user interactions across your endpoints and helps you identify delays before they impact real users.
- Throughput/Request Rate: Your API’s throughput is the number of requests it can handle within a given time period, such as per second or minute. A high number indicates your API can handle a lot of traffic.
- Time to First Byte (TTFB): TTFB, or time to first byte, is the interval between when a request is sent and when the first byte of the response is received. It indicates how quickly your server begins transmitting data. A high TTFB could indicate a slow, busy server or one experiencing network delays.
- Time to First Hello World: API product teams mostly rely on this metric to measure how fast a developer can sign up and make their first successful API call.
2. Reliability & Availability Metrics
Reliability metrics let you monitor your API’s dependability. They indicate how frequently users must retry because of issues and whether your API is always accessible. These metrics enable one to assess whether your API can be relied upon to function as intended.
- API Uptime: This indicates how frequently your API is available and functioning as expected. Should uptime fall, users could experience errors or failed connections. Keeping track of this guarantees your API is always accessible when needed.
- Retry Rate: This indicates the frequency with which users attempt the same request again. Users frequently make the same request again because something didn’t work the first time.
- Total API calls: This is the total quantity of requests that your API has received over a period of time. With this, you can track how much your API is being used. If the number of requests is high, you should think about how to scale to handle the extra load.
3. Infrastructure Metrics
Infrastructure metrics show how well the systems running your API are performing. They help you monitor the servers, memory, and CPU resources that power your API.
- Memory Usage: This indicates how much RAM your API server is consuming. High memory consumption might cause your system to slow down or perhaps crash.
- CPU Usage: This indicates how much processing power your API is using. High CPU use might indicate that your API is overloaded or badly optimized. Keeping track of this prevents downtime.
4. Security Metrics
Security metrics help you monitor who’s trying to access your API and whether they’re allowed to. They can alert you when someone’s using the wrong login info or trying to reach parts of your system they shouldn’t.
- Authentication Failure: This is when someone tries to access your API but can’t verify who they are, maybe because of an incorrect token or API key. Keeping track of these can help you spot odd behavior and block anything suspicious early.
- Authorization Failure: This occurs when someone logged in attempts to access administrative capabilities as a normal user.
5. Error Metrics
Error metrics let you know how frequently issues occur and when your API is having problems. By monitoring these metrics, you can identify bugs and address issues before they worsen.
- Failure Rate: This indicates the percentage of unsuccessful API requests to all requests. For instance, the failure rate is 10% if 10 out of 100 requests are unsuccessful. A high failure rate can indicate a connection problem or a code error.
- Errors Per Minute: This shows how many errors occur every minute. If the number suddenly increases, something probably just broke, and you’ll want to look into it fast.
- Total Error Count: This is just the total number of failed requests over time. It gives you a sense of how often things have been going wrong overall.
6. Usage Metrics
Usage statistics let you know who is using your API and how. They provide you with knowledge of user behavior and how your API adoption is expanding.
- API Usage Growth: This indicator illustrates the gradual rise in API calls. It lets you know if more systems or users are beginning to use your API. A bug or inadequate documentation may cause the usage to fall.
- API Retention: This metric quantifies the number of developers who stick with your API after their initial attempt. If the retention is high, that means developers are finding value and coming back to use your API.
API Metrics Each Team Should Monitor
Different teams care about different aspects of an API. Assigning the right metrics to the right team helps everyone stay focused and improves how the API is built and managed.
1. Development Team
The development team should monitor Performance, Error, and Security Metrics. These metrics help them catch bugs, improve speed, and secure the API during development.
2. Product Team
The product team can focus on the usage metrics. These metrics help them understand user behavior, identify which features are being used, and spot patterns that show when users stop using the API.
Using Frontend Monitoring can provide valuable data on user interactions and feature utilization.
3. DevOps Team
The DevOps team should monitor Infrastructure and Reliability Metrics. These help them ensure uptime, scale infrastructure, and avoid system crashes.
Why API Metrics Matter in Your API Strategy
Business objectives and engineering goals are connected by API metrics. They display the performance of your API, user behavior, and potential trouble spots. Without these metrics, teams are unable to make informed decisions regarding security, performance, usage, and dependability. You can make better decisions that result in higher uptime, quicker responses, safer APIs, and more satisfied users by monitoring the appropriate metrics.
A solid API strategy isn’t just about building and releasing; it’s about continuous improvement. API metrics make that possible. They help developers fix performance issues, product teams understand user behavior, and business leaders see real value from the API.
API Monitoring Best Practices
Monitoring your APIs involves more than just making sure they are accessible online; it also involves monitoring how well they operate, identifying odd issues, and resolving them before they impact your users.
Here are some best practices:
- Track important metrics like how fast the API responds, the error rate, and the data throughput.
- Include security checks and usage patterns in your monitoring plans to prevent unauthorized access or misuse.
- Set clear Service Level Agreements (SLAs) and alert limits so you know when something goes wrong so you can act quickly.
You can read a comprehensive guide that covers all the essentials of API monitoring to gain more knowledge about it.
How Middleware Helps with Visualizing API Metrics
Middleware is a tool that helps developers by making it easier to monitor systems, applications, and APIs. It gives access to all the important metrics without having to deal with the complicated setup of traditional monitoring tools.
These metrics can be viewed on user-friendly, real-time dashboards. You can set alerts to notify you if there are unusual activities or if performance drops. In addition to basic metrics, Middleware also tracks logs and traces. This approach allows you to dig deep and find the exact cause of any problems.
Want to compare the best solutions? Read our guide to the top API monitoring tools in 2025 to see how Middleware stacks up against other platforms.
Key Features that Support API Metrics
Monitoring API performance becomes easier with Middleware. It makes it possible for teams to track latency, error rates, request volume, and endpoint performance.
Here’s what helps make this possible:
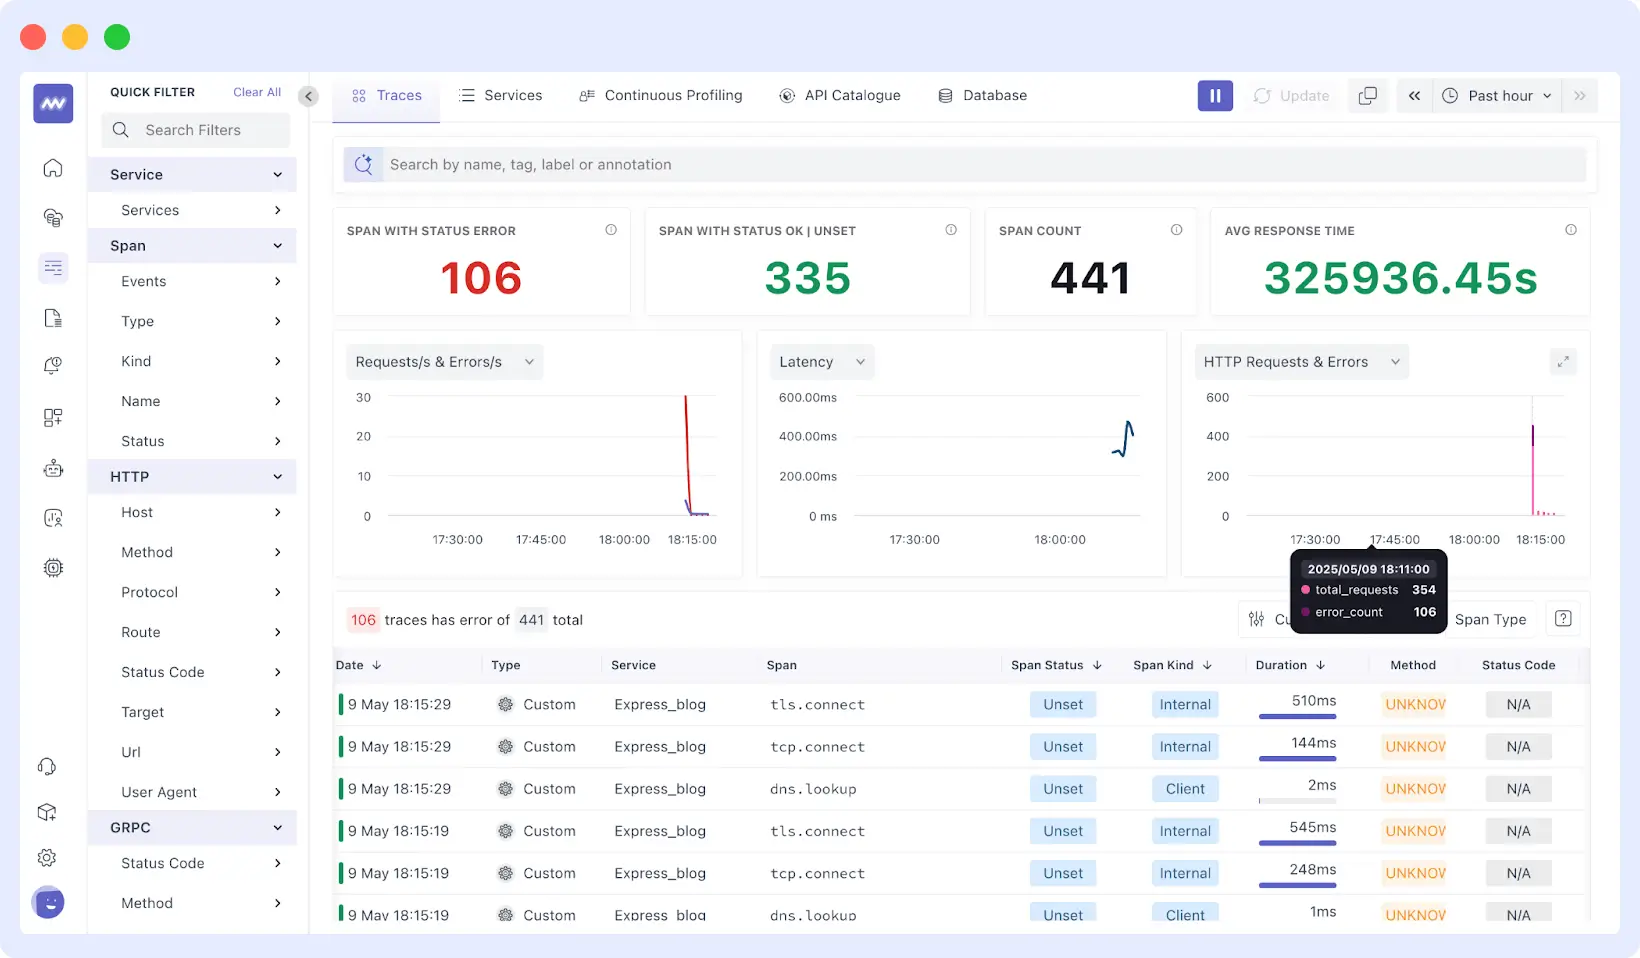
- Real-time Dashboard: Middleware’s dashboard enables you to see traffic trends, an increase in latency, and error rate. With this, developers team can quickly react instead of waiting for the problem to become big.
- Endpoint-Level Insights: It breaks down performance based on individual endpoints to identify areas with slow responses.
- Integrated Traces and Logs: You can understand what’s happening in the background by connecting API metrics with backend traces and logs. Unlike Datadog, trace setup in Middleware is simpler.
- Kubernetes and Cloud Native Support: You can track APIs in containers or clusters. Middleware automatically detects services and makes it easier to monitor dynamic infrastructure compared to tools that need extra configuration.
Ready to get started with powerful API monitoring? Sign up for a free Middleware account and explore all features.
Case Study: How Generation Exports Improved Observability with Middleware
Generation Esports, an EdTech company serving over 20,000 users and 5,000 schools, needed a better way to monitor their growing infrastructure. They encountered difficulties with Datadog, their current observability tool, as their Kubernetes-based systems grew. It was challenging to promptly troubleshoot problems and maintain performance due to the platform’s complexity, high cost, and unreliable alerting.
After switching to Middleware, they saw clear operational improvements:
- Their observability cost dropped by 75%.
- They resolved issues 75% faster.
- They optimized resources by 50%
- They cut down on manual monitoring tasks by 75%.
The switch not only helped reduce costs but also gave their team better visibility into API and infrastructure performance. Middleware’s real-time alerts and reliable Kubernetes monitoring enabled the team to detect and fix issues faster.
Unlike their encounter with Datadog, Middleware also provided proactive customer support and periodic check-ins, enabling them to fine-tune their configuration as they expand.
Conclusion
You should monitor API performance if your app or service relies on them. Tracking metrics like response time, error rate, and request volume helps you to better grasp performance and get ahead of problems before your users do.
Using the right tools, your team can avoid issues, maintain operations, and enhance the experience for every API consumer. Middleware makes it easy to visualize and act on your API metrics with real-time dashboards and integrated traces.
Start your free trial today and experience seamless API observability.
FAQs
What are API Metrics?
API metrics are information about your API’s performance, such as its speed, dependability, errors, and usage.
What Tools can help with API Metrics Visualization?
Through dashboards, graphs, and alerts, tools such as Middleware, Postman, and Prometheus helps to visualize of API metrics.
What are the most important API metrics to monitor?
Some key ones include how fast your API responds (latency), how often it runs into errors, how many requests it gets, how reliable it is (uptime), and how much traffic it can handle (throughput).
How do API Metrics Impact User Experience?
Slow or error-prone APIs can frustrate users. Monitoring metrics helps you catch issues early and keep things running smoothly.
What Tools are Recommended for Tracking API Metrics?
Middleware is a great choice for full-stack observability. Others include Datadog, New Relic, and OpenTelemetry.


