
Businesses rely heavily on Application Programming Interfaces (APIs) to connect various systems and deliver experiences to users. However, ensuring the reliability and performance of these APIs poses a significant challenge.
API monitoring solutions emerge as crucial tools to tackle this challenge, offering real-time insights into API health and performance, thus empowering businesses to deliver consistent and reliable services to their users.
Understanding the basics of API monitoring
API monitoring is the practice of continuously observing and analyzing Application Programming Interfaces (APIs) to ensure their reliability, availability, and performance. It involves tracking metrics like uptime, error rates, and response times to identify potential issues promptly.
By providing real-time insights into API health, monitoring tools enable organizations to maintain functionality and enhance the overall user experience.
Why is API monitoring important?
Monitoring APIs is crucial for several reasons:
- Reliability: APIs serve as the backbone of modern digital services, and any downtime or performance issues can disrupt operations and harm user experience. Monitoring ensures that APIs remain available and reliable, minimizing service disruptions.
- Performance Optimization: Tracking key metrics such as response times and error rates helps identify bottlenecks and inefficiencies in API performance. This information enables organizations to optimize their APIs for better responsiveness and scalability.
- Proactive Issue Detection: API monitoring allows organizations to detect and address issues before they escalate, minimizing the impact on users and preventing potential revenue loss or reputation damage.
- Security: Monitoring APIs helps identify suspicious activities or potential security breaches, allowing organizations to take timely action to protect sensitive data and ensure compliance with security standards.
Best ways to monitor your APIs
There are various approaches to monitor APIs, each tailored to address specific needs and use cases within an organization’s infrastructure. Depending on the objectives and requirements, businesses can leverage different monitoring techniques to ensure the reliability, performance, and security of their APIs. Here, we explore three key methods.
1. Synthetic monitoring
Synthetic monitoring involves simulating user interactions with APIs using pre-scripted scenarios or scripts. These synthetic transactions mimic real user behavior, allowing organizations to proactively test API performance in controlled environments.
Synthetic monitoring is beneficial for conducting regular performance tests, especially during off-peak hours, to assess API reliability and responsiveness. It’s also useful for monitoring APIs that are critical for business operations and need constant validation.
Some synthetic monitoring tools offer features like geographic testing (simulating user transactions from different locations), scripted workflows to mimic complex user journeys, and scheduled tests for continuous monitoring.
2. Real user monitoring (RUM)
Real User Monitoring (RUM) captures and analyzes data on how actual users interact with APIs in live production environments. It provides insights into user experience, including response times, error rates, and user behavior.
RUM is valuable for understanding how users experience APIs in real-world scenarios. It helps identify performance issues, such as slow response times or high error rates, and prioritize optimizations based on actual user impact.
RUM tools often offer session replay capabilities to visualize user interactions, segmentation to analyze performance across different user segments or geographical regions, and alerting mechanisms to notify administrators of performance anomalies in real-time.
Learn more about RUM.
3. Application performance monitoring (APM)
APM solutions provide comprehensive visibility into the performance of APIs and the underlying infrastructure. They monitor various metrics such as response times, CPU and memory usage, and transaction traces to identify performance bottlenecks and troubleshoot issues.
APM is essential for monitoring complex API ecosystems with multiple dependencies and microservices. It’s particularly useful for identifying performance bottlenecks, diagnosing root causes of issues, and optimizing API performance for enhanced reliability and efficiency.
APM tools often include features such as distributed tracing to map transactions across multiple services, anomaly detection to identify unusual patterns or deviations in API performance, and integrations with logging and alerting systems for comprehensive monitoring and troubleshooting.
Key API metrics to monitor
Availability or uptime
Availability or uptime is a critical API metric that reflects the reliability and accessibility of an API to users. It signifies the portion of time during which the API is operational and can successfully respond to requests. Monitoring availability is essential to ensure uninterrupted service delivery, as any downtime or unavailability can disrupt business operations and lead to dissatisfied users.
By tracking availability, organizations can proactively identify and address issues that affect API performance, minimizing service disruptions and maintaining a good user experience.
Measuring availability is straightforward, typically expressed as a percentage calculated over a specified monitoring period. The formula involves dividing the total uptime (time when the API is operational) by the total monitoring time and multiplying by 100.
Error rate
Error rate is a fundamental metric in API monitoring that quantifies the frequency of errors encountered during API interactions. It represents the percentage of API requests that result in errors or failures, typically indicated by HTTP status codes such as 4xx (client errors) or 5xx (server errors). Understanding error rates is crucial for assessing the stability and reliability of an API and ensuring a better user experience.
Monitoring error rates provides valuable insights into the health and performance of an API, allowing organizations to promptly identify and address issues that may impact user satisfaction and business operations. High error rates can indicate various problems, such as misconfigured APIs, inadequate error handling, or overloaded servers, which need immediate attention to prevent service disruptions and mitigate negative impacts on users.
The error rate is calculated by dividing the number of failed requests (e.g., those resulting in 4xx or 5xx responses) by the total number of requests and multiplying by 100 to obtain a percentage.
CPU and memory usage
These metrics provide detailed insights into the utilization of computational resources by the API server or underlying infrastructure. CPU usage measures the percentage of the processor’s capacity utilized by the API to execute tasks and process requests.
High CPU usage may indicate resource contention, inefficient code execution, or spikes in demand, potentially leading to performance degradation and slower response times.
Similarly, memory usage reflects the amount of system memory consumed by the API processes and data structures. Monitoring memory usage helps detect memory leaks, inefficient memory management, or excessive memory consumption, which can degrade performance and lead to system instability.
Effectively monitoring CPU and memory usage is crucial for optimizing resource allocation, preventing performance bottlenecks, and ensuring the smooth and reliable operation of the API. By tracking these metrics over time and setting thresholds for acceptable usage levels, organizations can proactively identify and address resource constraints, scale infrastructure as needed, and maintain optimal API performance and responsiveness.
API consumption
API consumption metrics offer a granular view of how clients or applications interact with an API, providing insights into usage patterns, traffic trends, and resource utilization. These metrics encompass various aspects of API usage, including:
- Total Request Counts: Total request counts track the number of API requests made within a specific time period. Monitoring request counts helps gauge overall API usage and identify peak usage times or trends over time.
- Data Transfer Volumes: Data transfer volumes measure the amount of data transferred between clients and the API server. This metric indicates the volume of data exchanged and helps assess the impact of API usage on network bandwidth and infrastructure resources.
- Request Rates: Request rates quantify the frequency of API requests, typically measured as requests per second or requests per minute. Monitoring request rates allows organizations to detect sudden spikes or fluctuations in demand and adjust resource allocation accordingly to maintain optimal performance.
- Usage Patterns: Usage patterns analyze how different clients or endpoints interact with the API, including the frequency and types of requests made. Understanding usage patterns helps identify popular endpoints, monitor API usage across different client applications, and prioritize optimizations based on user needs and preferences.
By monitoring API consumption metrics, organizations can gain actionable insights into user behavior, optimize resource allocation, and ensure the scalability and reliability of their API infrastructure.
Response time or latency
Response time or API latency refers to the duration it takes for an API server to process a request from a client and send back a response. It measures the time elapsed between when a request is sent and when the corresponding response is received.
Monitoring response time or latency is crucial for assessing API performance, as it directly impacts user experience and satisfaction. Longer response times can lead to delays in application functionality, reduced responsiveness, and potentially dissatisfied users.
This metric is typically measured in milliseconds (ms) and can be analyzed at various levels, including average response time, percentiles (such as the 95th percentile), and maximum response time. Understanding response time distributions helps identify performance outliers and ensures that the majority of requests are processed within acceptable time limits.
Choosing the best API monitoring tool
There are numerous API monitoring tools available in the market, each offering its own set of features and capabilities. From scalability to ease of use, each factor plays a crucial role in selecting the right monitoring solution for your organization. Here are a few of the best API monitoring tools:
- Intuitiveness: Choose a tool with an intuitive interface to simplify navigation and operations, reducing the learning curve and ensuring efficient utilization.
- Run Options: Look for flexibility in run options, allowing tests to be executed on-demand, at scheduled intervals, or in response to specific events to align with dynamic operational needs.
- Sequencing and Assertions: Ensure the tool supports effective sequencing and assertions for accurate testing of complex workflows, enabling thorough monitoring and issue identification.
- Alerts: Opt for a tool with robust alerting capabilities, customizable to predefined thresholds and accessible through various channels, for proactive issue resolution and minimizing downtime.
Top 3 API monitoring tools
Middleware
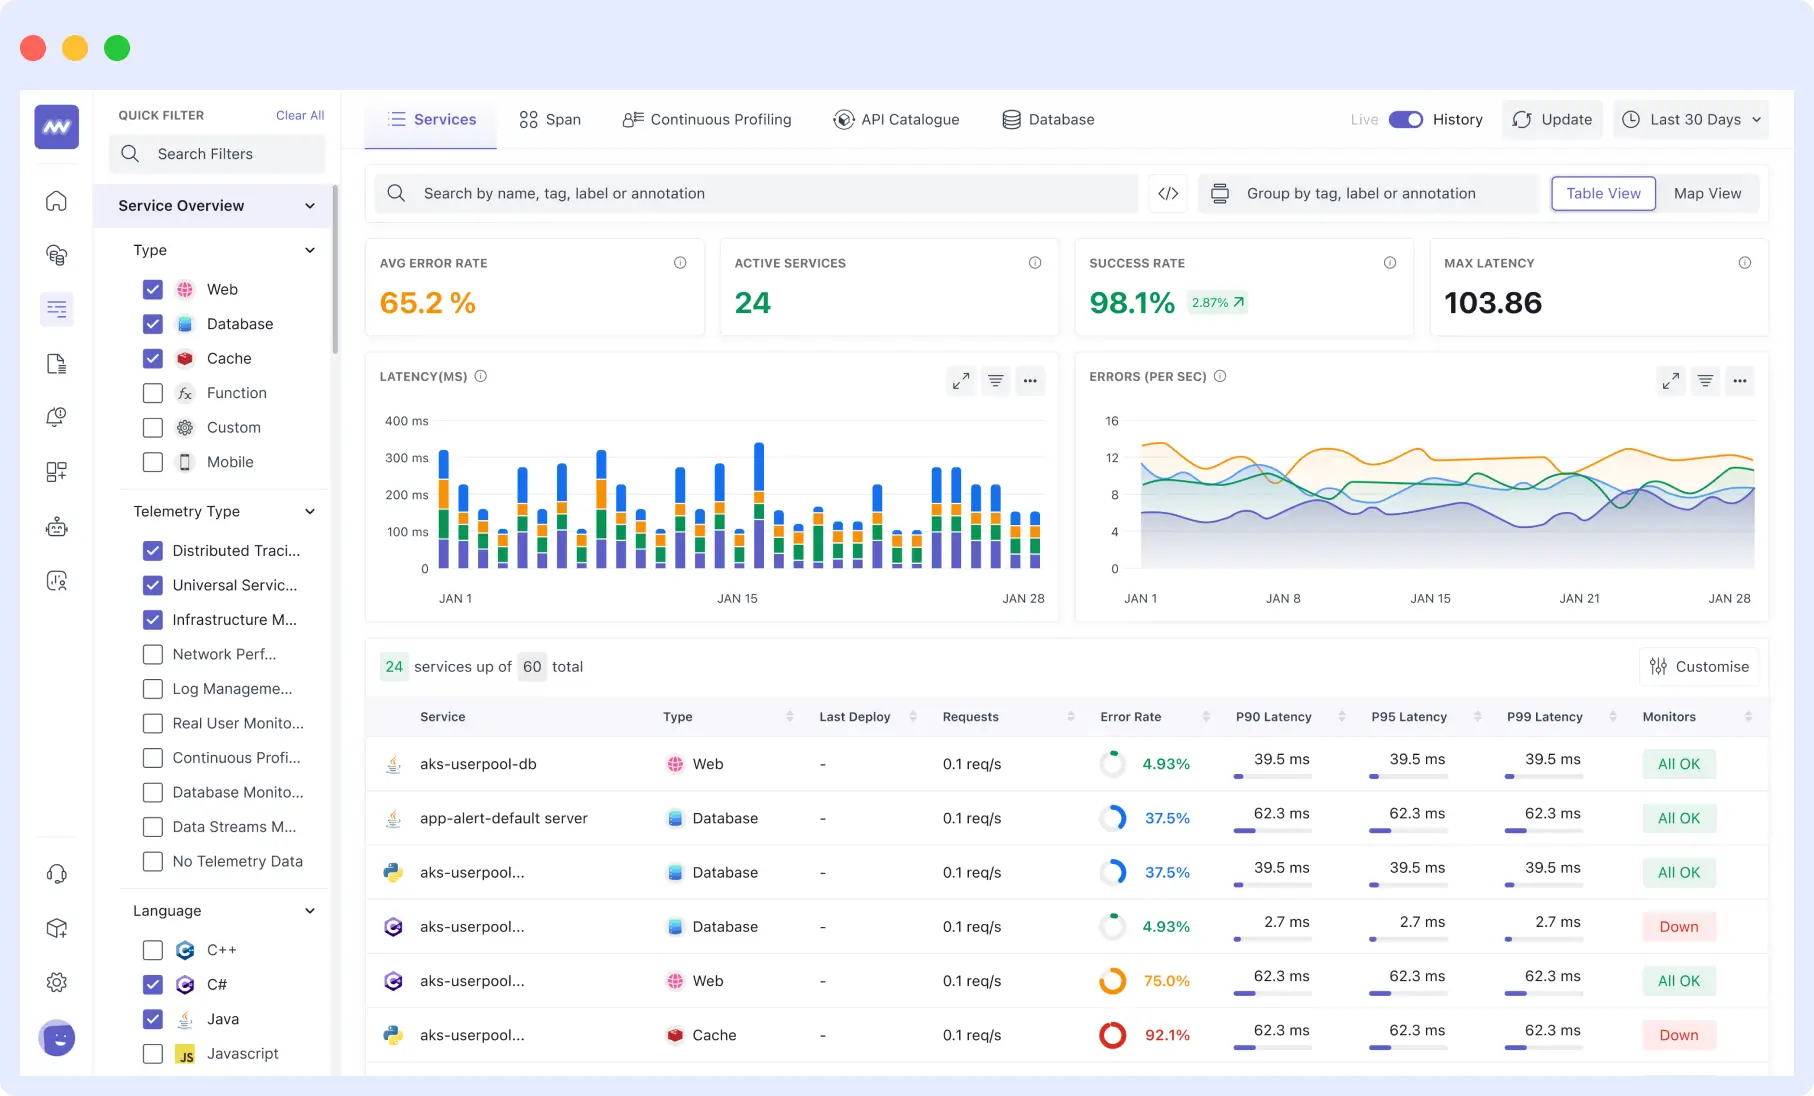
Middleware is a leading API monitoring solution, empowering developers with real-time troubleshooting capabilities for API-related issues. Serving as a unified observability platform, it facilitates prompt problem identification and thorough root cause analysis. Additionally, Middleware offers synthetic monitoring, allowing users to automatically monitor single and multi-step APIs with ease.
Key features
- Uptime and performance tracking: Middleware provides comprehensive tracking of API performance across various network levels (HTTP, SSL, DNS, etc.), allowing users to monitor response times and network timing data for faster analysis.
- Service monitoring: Monitoring metrics like request counts, error rates, and latency is essential for service and application performance, and Middleware simplifies this process with its intuitive interface.
- Instant root cause analysis and error trace: Middleware’s error tracking explorer offers insights into identified issues, error counts, and frequency over time, facilitating quick identification of root causes behind any errors.
- Alerts: Users can set up smart alerts based on response time and response code criteria. Middleware notifies users via preferred channels like Slack, Microsoft Teams, or email, ensuring timely responses to potential issues. Additionally, users can receive alerts on API performance parameters such as response time and response code, and correlate the observability data to view related logs and errors that occurred during the same time window.
Pros
- Supports both cloud and on-premise solutions.
- Offers a straightforward installation process.
- Provides 24/7 support via email, chat, and call.
- Offers a unified view for faster issue identification and root cause analysis.
- Compliant with GDPR, CCPA, and SOC 2 standards.
Cons
- Limited integrations compared to other API monitoring tools.
Pricing
Middleware offers a transparent and flexible pricing structure, starting with a Free Forever Developer Account for exploring monitoring capabilities without immediate financial commitment.
Splunk
Splunk is a robust and versatile platform designed for analyzing and visualizing machine-generated data across various sources within an organization. It offers powerful capabilities for monitoring, troubleshooting, and gaining insights from vast datasets, including log files, event streams, metrics, and more.
Splunk’s intuitive interface and advanced analytics tools make it a popular choice for organizations seeking to harness the value of their data for operational intelligence, security, and business analytics purposes.
Key features
- Track and Report Uptime and Performance: Easily measure and report uptime and performance metrics, allowing for confident scaling and reliable service delivery.
- Improved User Journeys: Optimize page speed and functionality for enhanced user experiences, with automated performance testing integrated into development pipelines.
- Automated Performance: Streamline development processes by automatically evaluating builds based on performance budgets, ensuring consistent high-quality deployments.
Pros
- Provides visualizations for understanding user experiences.
- Offers scalability features for growing needs.
Cons
- For those unfamiliar with command line interfaces, navigating Splunk may be difficult at first.
- Non-technical users may struggle to navigate and interpret logs, especially when encountering errors from the query builder.
Pricing
Splunk offers three distinct pricing plans:
- Workload Pricing: Aligns costs with the types of workloads running on the Splunk Platform. This makes it economical to ingest more data that are less frequently searched.
- Ingest Pricing: Pay based on the amount of data ingested into the Splunk Platform. It provides a simple and predictable approach for running additional searches and expanding use cases.
- Entity Pricing: Offers a predictable plan based on the number of hosts using Splunk observability products. This organizations with specific host-based monitoring needs to control costs.
Dynatrace
Dynatrace offers cutting-edge API monitoring solutions, delivering real-time insights into performance and availability. With its advanced capabilities, Dynatrace ensures user experiences by proactively identifying and optimizing API interactions.
Key features
- Pre- and Post-execution scripting: Allows custom JavaScript code to run before and after HTTP requests. Subsequently, it enables sophisticated API monitoring scenarios, such as complex authentication, inter-request logic, and custom response parsing.
- Multi-request HTTP monitors: Supports the creation of synthetic monitors that can handle multiple requests in a single test. This is useful for monitoring the performance of complex API interactions.
- Comprehensive dashboards: Includes customizable dashboards that provide a holistic view of API health and performance metrics.
Pros
- Easy to implement with its cloud hosting and intuitive interface.
- Provides accurate reports pinpointing problem locations.
Cons
- Occasionally generates false alarms, leading to unnecessary troubleshooting.
- Pricing can be high, limiting the ability to monitor all servers.
Pricing
With a Dynatrace Platform Subscription, you can access the entire platform with straightforward hourly pricing that scales with your needs.
Final thoughts
To wrap up, API monitoring plays a crucial role in ensuring the reliability, performance, and security of modern digital services. By utilizing various monitoring techniques and key metrics, organizations can gain valuable insights into API health and proactively address issues.
As next steps, consider evaluating your current API monitoring strategy and exploring the top API monitoring tools like Middleware. Start a trial with one of these tools to experience their capabilities firsthand and enhance your API monitoring efforts.
With the right tool, you can optimize API performance, enhance user experience, and ensure smooth digital operations.
Click here get start with Middleware.


