




Application dependency mapping is the process of identifying and visualizing how the services, infrastructure, and external systems that make up an application depend on one another. It shows which components a request touches, in what order, and where a failure in one component can affect others. Teams use it for incident investigation, change impact analysis and cloud migration planning.
A dependency map is only useful if it’s built from what the system is actually doing, not a diagram someone drew months ago. A pod that autoscaled away an hour ago or a service mesh route that changed this morning won’t show up on a whiteboard, but both show up in traces, metrics, and logs.
Key takeaways
- A dependency map is only as reliable as the telemetry behind it; static architecture diagrams go out of date the moment a pod reschedules or a service mesh route changes.
- A useful map is dynamic, not static: it’s continuously derived from live telemetry rather than written once and left to go stale.
- Distributed traces, metrics, logs, and RUM each surface a different piece of a dependency problem, and none of them is sufficient on its own.
- A dependency relationship narrows an investigation, it doesn’t confirm root cause; correlation between a dependency and an incident still needs to be tested against other explanations.
- Asynchronous dependencies (queues, event streams) and third-party APIs are the two categories most teams miss, because neither shows up in a synchronous trace path by default.
- Building a usable map starts with instrumenting the services behind a handful of critical user journeys, not with trying to map the entire system at once.
What is application dependency mapping?
In a monolithic application, most dependencies live in the codebase, so a developer can trace them by reading the source code. That approach breaks down in a distributed system built from dozens or hundreds of services: the dependencies live in how the system runs, not in any single repository.
A single checkout request might pass through a frontend, an API gateway, an authentication service, a payment provider, a database, a cache, and a message queue. Each hop is a potential point of failure or slowdown, and none of it is visible from reading one service’s code.
Some teams call this service dependency mapping or microservices dependency mapping when the focus narrows to service-to-service calls specifically. Both are a subset of the broader practice covered in this guide.
The practical value shows up in three recurring situations: diagnosing an incident faster by knowing what’s connected to what, assessing the blast radius of a planned change before it ships, and understanding the true shape of a system before migrating it to new infrastructure.
Which dependencies matter in modern applications?
A complete picture of dependencies covers more than service-to-service calls. Most of what follows falls into three broad groups: application dependencies (how services call each other and what code depends on), infrastructure dependencies (what a service runs on), and network dependencies (how traffic actually reaches a service).
The categories below break those groups down further into the specific things that most often go untracked until they cause an incident.
- Runtime service-to-service dependencies: Services call each other directly, and distributed tracing usually makes these calls visible.
- Infrastructure dependencies: A service runs on nodes, containers, pods, and clusters, and infrastructure monitoring tracks how those resources are provisioned and scaled.
- Data dependencies: A service reads from and writes to databases, data warehouses, and caches.
- Network and API dependencies: A request passes through DNS resolution, load balancers, API gateways, and service mesh routing.
- Configuration dependencies: Feature flags, environment variables, and shared configuration stores can change service behavior without any code change.
- Identity and access dependencies: Authentication and authorization services gate access to other dependencies.
- Third-party SaaS dependencies: Payment processors, email providers, and other external APIs sit outside the team’s control.
- Asynchronous dependencies: Message queues, event streams, and pub/sub systems connect a service to downstream consumers without a direct call.
Asynchronous dependencies deserve particular attention because they’re the easiest category to miss. A service that publishes an event has no direct call to the consumers of that event, so tools that only trace synchronous request paths can miss the relationship entirely.
How dependency discovery actually works
Application dependency discovery is the process that produces the map in the first place. Teams don’t type dependency maps in by hand. The map gets built by one of three discovery methods, and most production setups end up combining more than one.
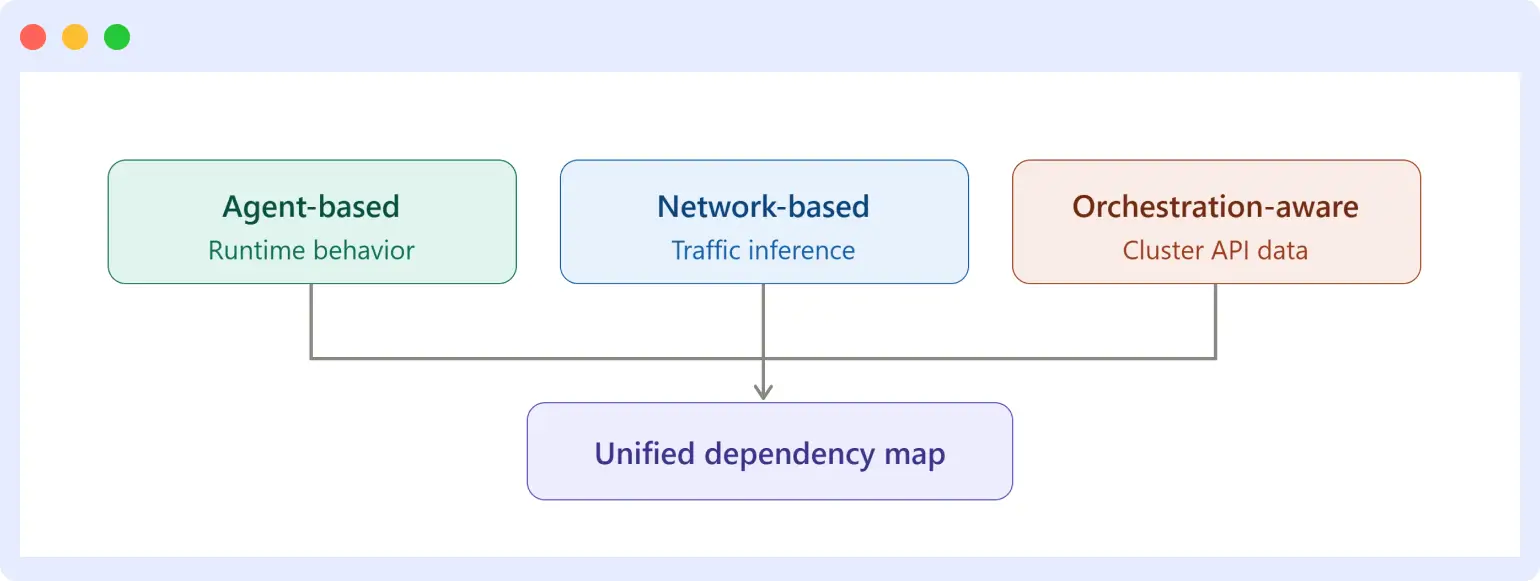
Agent-based discovery runs a lightweight collector on each host, container, or process, seeing runtime behavior directly: which process opened which connection, which library made which call.
It’s the most accurate method, but coverage is the tradeoff: anything not running the agent or instrumentation is invisible to the map.
Network-based (agentless) discovery infers relationships by watching traffic between hosts and services, without installing anything on the workloads themselves. It’s faster to roll out across an environment and doesn’t touch application code.
The tradeoff: it can only see that two things are talking, not why, and it tends to miss dependencies that don’t show up as direct network calls, such as shared configuration or asynchronous event consumers.
Orchestration-aware discovery reads directly from platforms like Kubernetes, pulling service, deployment, and networking objects from the cluster API. This is the basis of a Kubernetes service map and of application topology mapping more broadly.
It tracks infrastructure-level dependencies, such as which pods back which service, accurately and in near real time. What it doesn’t show is how requests actually flow through application code, since that’s the platform’s view, not the application’s.
In practice, most teams end up layering these: orchestration-aware discovery for the infrastructure layer, agent-based tracing for application-level request paths, and agentless network monitoring to catch dependencies that instrumentation missed.
Why static diagrams are not enough
Architecture diagrams are useful for communicating intent, but they describe the system a team designed, not necessarily the system running in production right now. In a cloud-native environment, the gap between the two widens quickly.
Kubernetes workloads scale up and down based on load, so the set of pods serving a given service at any moment is constantly changing. According to Kubernetes documentation, pods are ephemeral by design and are not expected to persist across rescheduling events, which means any diagram naming specific instances is out of date almost immediately.
Autoscaling groups, serverless functions, and service mesh routing rules add further movement. A serverless function’s dependency on a database might exist only during specific invocation paths. A service mesh can reroute traffic between versions of a service without any change to a diagram.
Third-party APIs evolve independently of the team’s own release cycle too, so even dependencies outside the cluster can change without an internal change record. A static diagram captures a moment in time; a live dependency view has to be rebuilt continuously to stay accurate.
How observability creates a live dependency view
Observability data, specifically traces, metrics, logs, and real user monitoring, is what turns a one-time diagram into a continuously updated dependency map.
An observability dependency map earns that name specifically because it’s derived from this telemetry rather than from documentation. Each signal contributes something different.
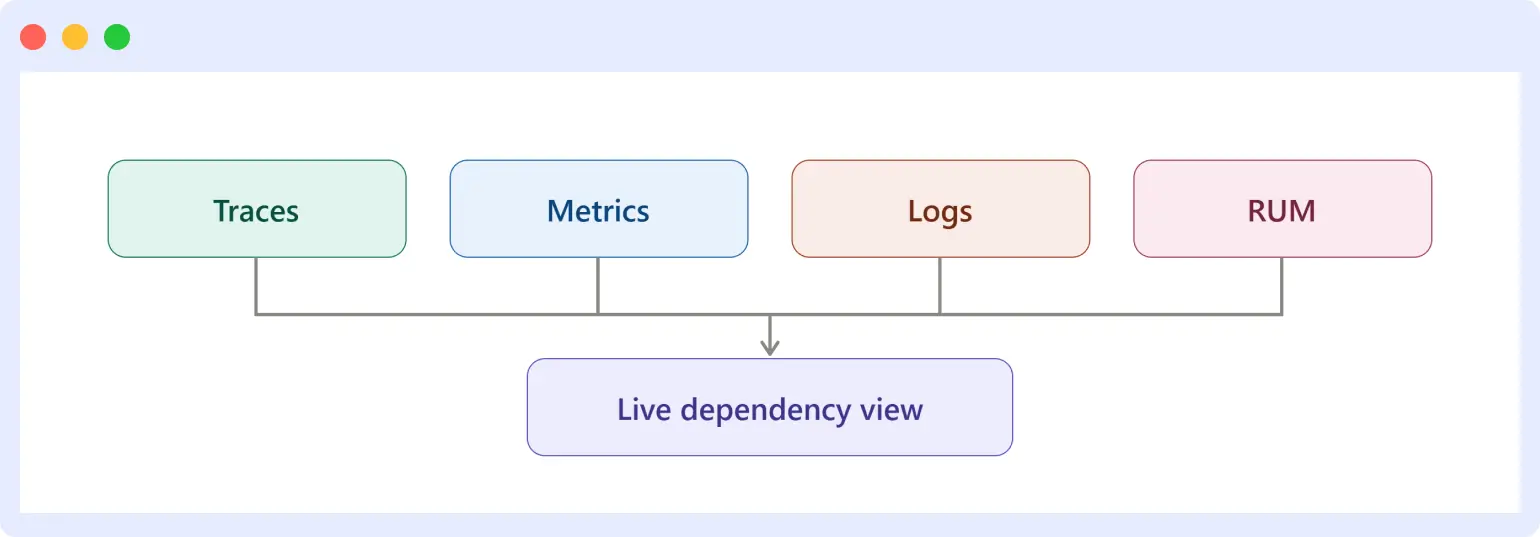
Distributed traces reveal the actual path a request takes across services, including the order of calls and how long each step takes. Most people mean this when they say “distributed tracing service map”: a view built entirely from spans, showing service-to-service calls but not the infrastructure or data underneath them.
OpenTelemetry defines the trace and span model used to capture this data. It’s the vendor-neutral instrumentation standard most teams now use. Middleware’s distributed tracing is built on this same model.
Metrics surface the symptoms of a dependency problem: elevated latency, resource saturation, reduced throughput, or a rising error rate on a specific service or endpoint. Metrics rarely explain why a dependency is unhealthy, but they’re usually the first signal that something in the dependency chain needs attention.
Logs add the detailed context traces and metrics can’t carry, such as an exact error message, a stack trace, or a specific failed query. Logs are most useful once tracing and metrics have narrowed the investigation to a specific service or component. Middleware’s log monitoring correlates these logs with the traces and metrics discussed above.
Real user monitoring (RUM) connects backend dependency problems to what a user actually experienced, closing the loop between an internal dependency failure and its user-facing impact. This works by tagging both the browser session and the backend trace with a shared trace ID, so a slow session can be pivoted directly to the backend trace it triggered.
Middleware’s real user monitoring captures this frontend layer alongside the backend signals above, using this same trace ID correlation.
None of these signals is sufficient alone. Traces show the path. Metrics show where something looks unhealthy along that path. Logs explain the specific failure. RUM confirms whether users were affected. Used together, they let a team rebuild an accurate, current dependency map instead of relying on a diagram that was accurate on the day it was drawn.
Worked example: investigating a slow checkout flow
Consider a checkout flow with this dependency chain: browser (RUM) → frontend → API gateway → authentication service → checkout service → payment provider → PostgreSQL → Redis → message queue.
- Users report slow checkout. Customer support flags a spike in complaints about checkout taking too long.
- RUM confirms the user-facing impact. Real user monitoring data shows a measurable increase in page load and interaction time specifically on the checkout page, ruling out an isolated report and confirming a real, broad issue.
- APM traces show elevated checkout latency. Distributed traces for checkout requests show that most of the added time sits inside the checkout service’s span, not in the frontend or API gateway.
- Dependency context narrows the investigation. Because the dependency map shows the checkout service calls the payment provider, PostgreSQL, and Redis, the investigation now has three concrete candidates instead of an entire request path to search.
- Metrics and logs help test possible causes. Metrics show elevated query latency on PostgreSQL during the same window, and logs from the checkout service show repeated slow-query warnings tied to a specific table. That combination points toward the database as the likely contributor.
- A dependency relationship is evidence, not proof. The dependency map narrowed the search; it didn’t confirm the cause. The elevated latency still needs to line up with the timing of the slowdown, and alternatives like a recent deploy or a payment provider outage need to be ruled out first.
How to implement application dependency mapping
Implementation follows a repeatable sequence, from identifying critical services through continuous validation. These nine steps cover that sequence.
- Identify critical user journeys and business services. Start with the flows that matter most to the business (checkout, login, search) rather than trying to map everything at once.
- Create naming, ownership, and tagging standards. A dependency map is only useful if every service, database, and queue in it is consistently named and has a clear owner.
Even before telemetry is fully in place, writing dependencies down in a shared, versioned format keeps teams aligned:
service: checkout-service
owner: payments-team
depends_on:
  - service: payment-provider
    type: third-party-api
  - service: postgresql-orders
    type: database
  - service: order-events-queue
    type: async
This kind of file is a starting point, not the end state. It documents intent; the telemetry from the next steps is what confirms whether it’s still accurate.
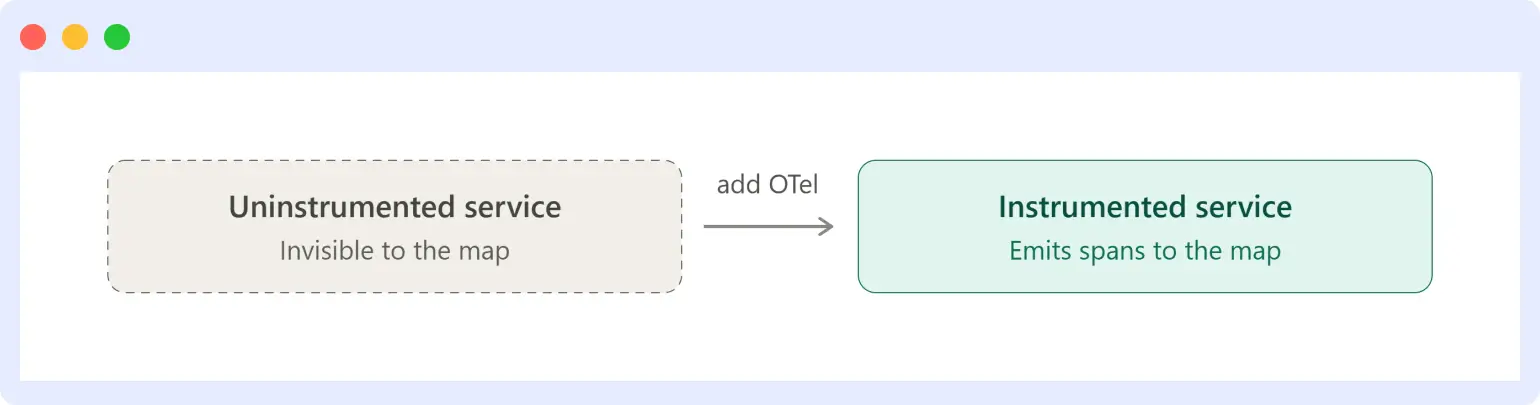
- Instrument priority services with OpenTelemetry. Add tracing, metrics, and log instrumentation to the services in those critical journeys first.
- Collect traces, metrics, logs, and RUM signals. Route this telemetry to a place where it can be correlated, not just stored separately per signal type.
- Discover internal and external dependencies. Use trace data to surface both the services a team owns and the third-party APIs, queues, and data stores those services call.
- Validate maps against production traffic and architecture knowledge. Compare what the telemetry shows against what engineers who own the system already know, and reconcile the differences.
- Include dependency checks in release and change workflows. Before a change ships, check what the map says will be affected downstream.
- Review and update dependency information continuously. Treat the map as a living artifact tied to telemetry, not a document reviewed once a quarter.
- Alert on dependency health and business impact, not only component availability. A dependency can be “up” and still be degrading the user journeys that depend on it; alerting should reflect that.
Instrumenting a service for tracing is usually a few lines, not a rewrite. A Python service, for example, can be auto-instrumented with the OpenTelemetry SDK without touching application code:
# Install the OpenTelemetry auto-instrumentation package
pip install opentelemetry-distro opentelemetry-exporter-otlp
opentelemetry-bootstrap -a install

# Run the service with auto-instrumentation enabled
opentelemetry-instrument
  --traces_exporter otlp
  --service_name checkout-service
  python app.py
This is what step 3 above looks like in practice: the service now emits spans for its inbound requests and outbound calls, which is the raw data a dependency map is built from. In Kubernetes, auto-instrumentation can cover a whole cluster at once, without editing deployment manifests service by service.
Common dependency-mapping blind spots
Most dependency-mapping failures come from a handful of recurring mistakes, not from picking the wrong tool. These are the ones to watch for.
- One-time documentation. A map built once during an architecture review goes stale as soon as the system changes.
- Missing third-party dependencies. External APIs are easy to leave out because they’re outside the team’s own tracing.
- Ignoring asynchronous systems. Queues and event streams don’t show up in synchronous trace paths unless they’re explicitly instrumented.
- Poor service naming. Inconsistent or duplicate names across environments make it hard to trust the map or search it during an incident.
- Sampling gaps. Aggressive trace sampling can drop the exact requests that would have revealed a rare but important dependency path.
- Treating correlation as causation. A dependency being present at the time of an incident is a lead, not a confirmed cause.
- Ignoring service ownership. A map without clear ownership slows down incident response because responders don’t know who to page.
- Collecting too much telemetry without prioritization. Instrumenting everything at once, without prioritizing critical journeys, produces noise that makes the map harder to use, not easier.
How Middleware supports dependency-aware observability
Middleware is a full-stack observability platform that provides visibility across infrastructure, application performance monitoring (APM), and real user monitoring (RUM). Bringing these signal types into one place can help teams investigate issues across the full application stack instead of switching between separate tools during an incident.
In practice, getting from zero to a dependency view involves three steps: signing up, instrumenting services, and viewing the resulting map.
1. Sign up. Middleware offers a 14-day free trial with no credit card required. Signup provides an API key, which authenticates the telemetry your services send.
2. Instrument your services with OpenTelemetry. Because Middleware is OpenTelemetry-native, the same instrumentation shown earlier in this guide applies directly; you just point the exporter at Middleware’s endpoint and pass the API key as an authorization header:
export OTEL_EXPORTER_OTLP_ENDPOINT=https://<your-account-id>.middleware.io:443
export OTEL_EXPORTER_OTLP_HEADERS="authorization=<your-api-key>"

opentelemetry-instrument
  --traces_exporter otlp
  --metrics_exporter otlp
  --logs_exporter otlp
  --service_name checkout-service
  python app.py
3. View the dependency map. Once services are sending traces, Middleware’s Service Maps show the resulting dependency graph. Services appear in Table View by default. Switching to Map View shows each instrumented service as a node, with connecting lines representing service-to-service communication.
The map is built from distributed traces, so it reflects what services are actually calling each other, not a manually maintained diagram.
RUM correlation. If frontend sessions are part of the picture, as in the checkout example earlier, Middleware’s RUM agent tags both the browser session and the backend trace with a shared trace ID. A session showing slow checkout can be pivoted directly to the backend trace it triggered.
Controlling telemetry volume. On high-traffic services, tracing every request adds unnecessary volume. Tail-based sampling can be configured to keep full traces for errors and slow requests while sampling routine traffic at a lower rate. This directly addresses the sampling-gap blind spot described earlier.
Middleware’s AI SRE Agent helps teams investigate and resolve production issues. In a dependency-mapping context, this kind of unified signal correlation can help reduce manual context switching as engineers move from a user-facing symptom toward a more focused investigation. It supports the workflow described in the worked example above; it doesn’t replace the verification steps that workflow requires.
Application dependency mapping checklist
Use this checklist to confirm a dependency-mapping rollout is production-ready before treating it as complete.
- Critical user journeys and the services behind them are identified and named consistently.
- Priority services are instrumented with OpenTelemetry for traces, metrics, and logs.
- RUM is in place for user-facing flows tied to those journeys.
- Internal, external, and asynchronous dependencies are all represented, not just synchronous service calls.
- Every service and dependency in the map has a documented owner.
- The map is validated against production traffic on a recurring basis, not just at initial build time.
- Dependency impact is checked as part of the release process for significant changes.
- Alerting reflects business-journey impact, not just individual component uptime.
- Known blind spots (sampling gaps, uninstrumented third-party calls) are documented so responders know where the map is incomplete.
FAQs
What is the difference between application dependency mapping and service mapping?
Service mapping typically shows call relationships between an organization’s own services, usually derived from distributed tracing. Application dependency mapping is broader: it also includes infrastructure, data stores, configuration, and third-party dependencies outside the traced service-to-service path.
Is application dependency mapping useful for Kubernetes?
Yes. A Kubernetes service map is especially prone to going stale, since autoscaling, rescheduling, and rolling deployments change dependencies constantly. This is why Kubernetes monitoring tools favor continuous, automated discovery over static documentation.
How does distributed tracing help map dependencies?
Distributed traces record the spans a request passes through and the parent-child relationships between them, which is what reveals the actual path and timing of a request across services.
What tools are used for application dependency mapping?
Dependency mapping tools typically combine an instrumentation standard like OpenTelemetry with an observability platform that ingests traces, metrics, logs, and RUM data and correlates them into a usable view.
How often should dependency maps be updated?
In a dynamic, cloud-native environment, a dependency map should be continuously derived from live telemetry rather than updated on a fixed schedule, since the underlying system can change faster than any manual review cadence.
Can dependency mapping identify root cause?
Not on its own. A dependency map narrows where to investigate by showing what’s connected to a failing component, but confirming root cause still requires correlating metrics, logs, and timing, and ruling out alternative explanations.
What’s the difference between application dependency mapping and APM?
APM tells you how a service is performing right now, through metrics like latency, throughput, and error rate. Application dependency mapping tells you how services relate to each other. The two are complementary: APM flags that a service is degraded, and the dependency map shows what else that degradation could reach.
How is a dependency map actually built?
Through one of three discovery methods, usually combined: agent-based instrumentation that reports runtime behavior directly, agentless network monitoring that infers relationships from traffic, and orchestration-aware discovery that reads service and deployment data straight from a platform like Kubernetes.
What’s the difference between static and dynamic dependency mapping?
A static map is written down once, whether by hand or from architecture documentation, and stays fixed until someone updates it. A dynamic map is continuously derived from live telemetry, so it reflects what the system is actually doing right now. Most CMDBs are static; a dependency map built from traces and metrics is dynamic by definition.
How does dependency mapping for cloud migration work?
Before migrating a system, a dependency map shows what actually depends on what. That lets a team group services that need to move together and spot dependencies, like a legacy database or an on-prem identity provider, that would break if moved on their own timeline. This works best when the map is built from live traffic rather than architecture documents, since documentation often lags what a system has grown to depend on.

