




A trace ID is a unique identifier assigned to a single request, shared by every span recorded as that request moves through a distributed system. In distributed tracing, it’s the first thing an on-call engineer reaches for when a request fails and the failure could be anywhere in the stack.
This guide covers how a trace ID is structured, how it propagates over HTTP, gRPC, and queues, and where it tends to break down in practice.
TL;DR
- A trace ID is not a log tag. It’s the anchor for a structured tree of spans, each one a timed unit of work, with parent-child links showing exactly which operation triggered which.
- A trace ID is not the same as a correlation ID. A correlation ID can span multiple traces. A trace ID identifies exactly one.
- Propagation is automatic for live HTTP and gRPC calls. It is not automatic across queues and serverless functions. This is where most tracing setups quietly break.
- Sampling means most requests are never traced at all. A missing trace does not always mean a bug.
- Raw cloud storage runs about $0.02 per GB per month. Observability vendors typically charge $0.10 to $3.00 per GB once ingestion and indexing are included. That’s why trace retention windows are usually short.
What is a trace ID
A trace ID is a token given to a single request in a system. It tracks that request deeply, across every service it touches. They’re built across multiple services, APIs, and microservices to handle a single request.
Every trace ID is made up of spans. A span is one small, timed piece of work. It can be a database call, an API hit, or a function doing its job.
A trace is the full set of spans for one request. All of them share the same trace ID.
Trace ID: 4bf92f3577b34da6a3ce929d0e0e4736
├── API Gateway         span: a1b2c3            120ms
│   ├── Auth Service     span: d4e5f6 ← a1b2c3    15ms
│   ├── Order Service    span: g7h8i9 ← a1b2c3    80ms
│   │   └── Database Query  span: j0k1l2 ← g7h8i9  60ms
│   └── Notification Service span: m3n4o5 ← a1b2c3  20ms
One trace ID, many spans — a waterfall view showing API Gateway, Auth Service, Order Service, Database Query, and Notification Service, each with its own span ID and parent link, all sharing the trace ID 4bf92f3577b34da6a3ce929d0e0e4736
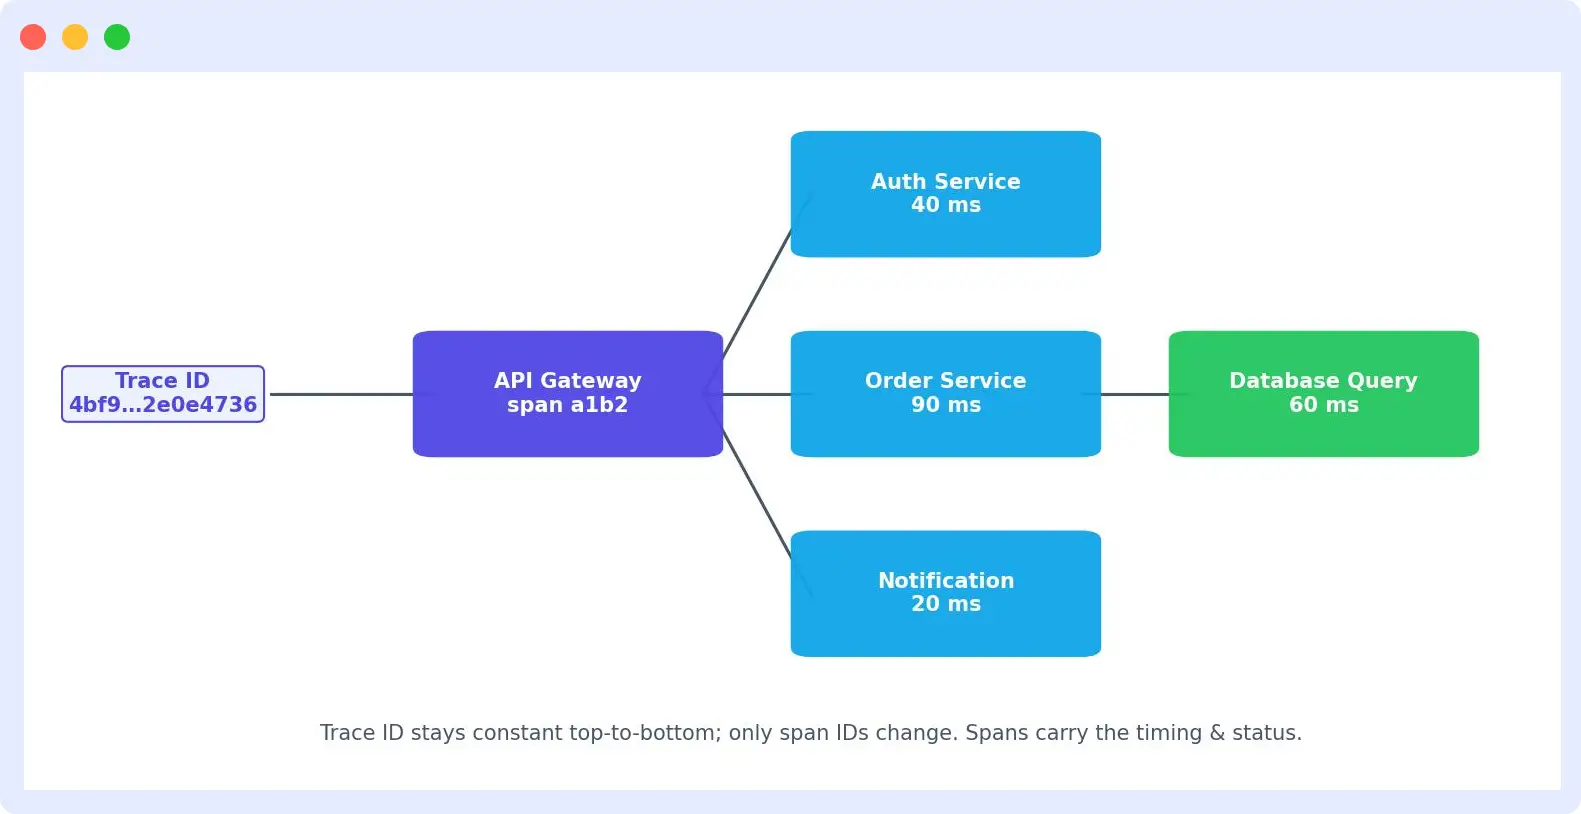
The trace ID stays constant from top to bottom. Only the span IDs change. Each one records which span above it triggered it (shown after the ←). The trace ID identifies the trace. It doesn’t describe what happened inside it.
The ID alone won’t tell you which services were involved, how long anything took, or whether something failed. Those details live in the spans themselves.
A span can carry:
- Service and operation name
- Start time and duration
- Status
- Attributes
- Errors and events
- Parent-child relationships
Why trace IDs matter
Debugging without a trace ID means cross-referencing timestamps across several separate log files by hand, and guessing which lines belong together the everyday reality for teams without a proper Application Performance Monitoring (APM) setup.
A trace ID removes the guessing. One search, one ID, and every log line and span from every service comes back, in order, with exact timing, instead of several separate log searches across several separate systems.
When should you use a trace ID?
A trace ID is most useful when you need to follow one request across multiple services and understand what happened at each step. Instead of matching timestamps across separate logs, you can use the trace ID to retrieve the spans and related logs for that request.
Common cases include:
- Debugging failed requests: Find which service, database call, or external API caused an error.
- Investigating latency: See where a slow request spent its time and identify the slowest operation.
- Correlating logs across services: Search the same trace ID in logs from multiple services to follow one request.
- Tracing asynchronous work: Connect processing across queues, workers, and event-driven services when trace context is propagated.
- Investigating customer-reported issues: Start with the trace ID associated with a failed request and inspect the exact path it took.
For example, if a checkout request takes three seconds, the trace ID can pull together the spans for the API gateway, order service, payment service, and database. The individual span timings then show where those three seconds were spent.
Trace ID vs request ID vs correlation ID: what’s the difference?
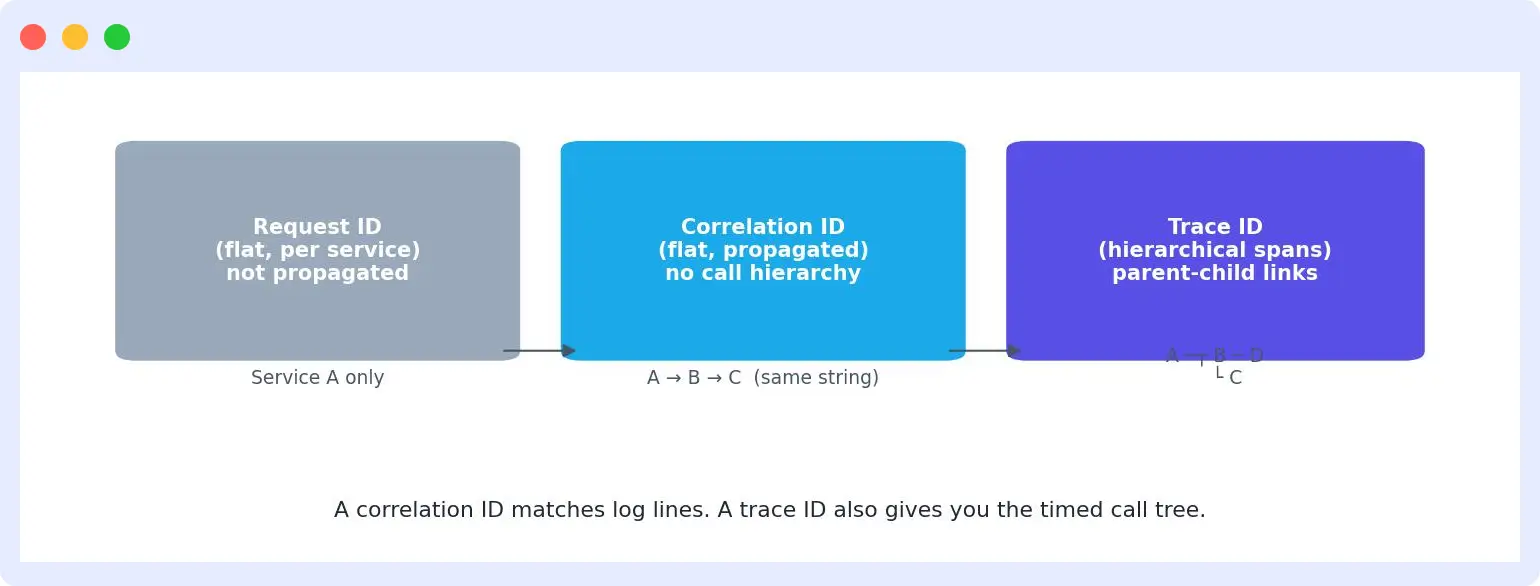
| Term | What it is | Structure | Typical use |
|---|---|---|---|
| Request ID | An identifier for a single request at a single service boundary, often generated fresh by each service and not propagated further | Flat string | Correlating logs within one service |
| Correlation ID | A single identifier propagated across every service a request touches | Flat string, no hierarchy | Connecting log lines for one request across a whole system |
| Trace ID | The root identifier of a structured, hierarchical trace made of parent-child spans | Part of a tracing system (OpenTelemetry, W3C Trace Context) | Latency breakdowns, dependency mapping, root-cause analysis |
A correlation ID is a flat string you pass everywhere so log lines can be matched up, but it carries no timing or call hierarchy. A trace ID does everything a correlation ID does, plus that structure on top, which is why most teams don’t bother maintaining both.
Where a trace ID physically sits
A trace ID doesn’t live in one place. It moves through three layers as a request travels through your system.
- Between services, it’s plain text inside a header. An HTTP header for REST calls, gRPC metadata for gRPC, a message header for something like Kafka. It never sits inside the actual request body.
- Inside a single service, it lives in an in-memory context object that quietly follows the current execution.
context.Contextin Go, contextvars in Python,AsyncLocalStoragein Node.js. Code running underneath the request can pull it out without being handed it directly. - After the work is done, it becomes a stored, indexed record. The tracing library ships the finished span, its trace ID, span ID, parent ID, duration, and any errors, to a backend like Jaeger, Tempo, or Middleware. It’s indexed by trace ID for fast lookup.
How trace IDs propagate
A trace ID moves from one service to the next through trace context. For HTTP and gRPC requests, this context is typically passed in request headers. For asynchronous systems such as queues and event streams, it travels with the message metadata. Each receiving service reads the context, keeps the same trace ID, and creates a new span for its own work.
For example, a single order moving through four services keeps the same trace ID at every hop, while the parent ID updates each time to point to whichever span just called it:
Order Service → Payment Service → Inventory Service → Shipping Service

Order Service:      trace_id: 4bf92f...4736   (starts the trace)
Payment Service:    trace_id: 4bf92f...4736   parent_id: a1b2c3
Inventory Service:  trace_id: 4bf92f...4736   parent_id: d4e5f6
Shipping Service:   trace_id: 4bf92f...4736   parent_id: g7h8i9
How a trace ID travels across services: Order Service, Payment Service, Inventory Service, and Shipping Service connected in sequence, each showing the same trace ID with an updated parent span ID at every hop
Same trace ID at every hop. Each service generates a new span ID for itself and forwards it as the next parent ID.
Synchronous propagation over HTTP
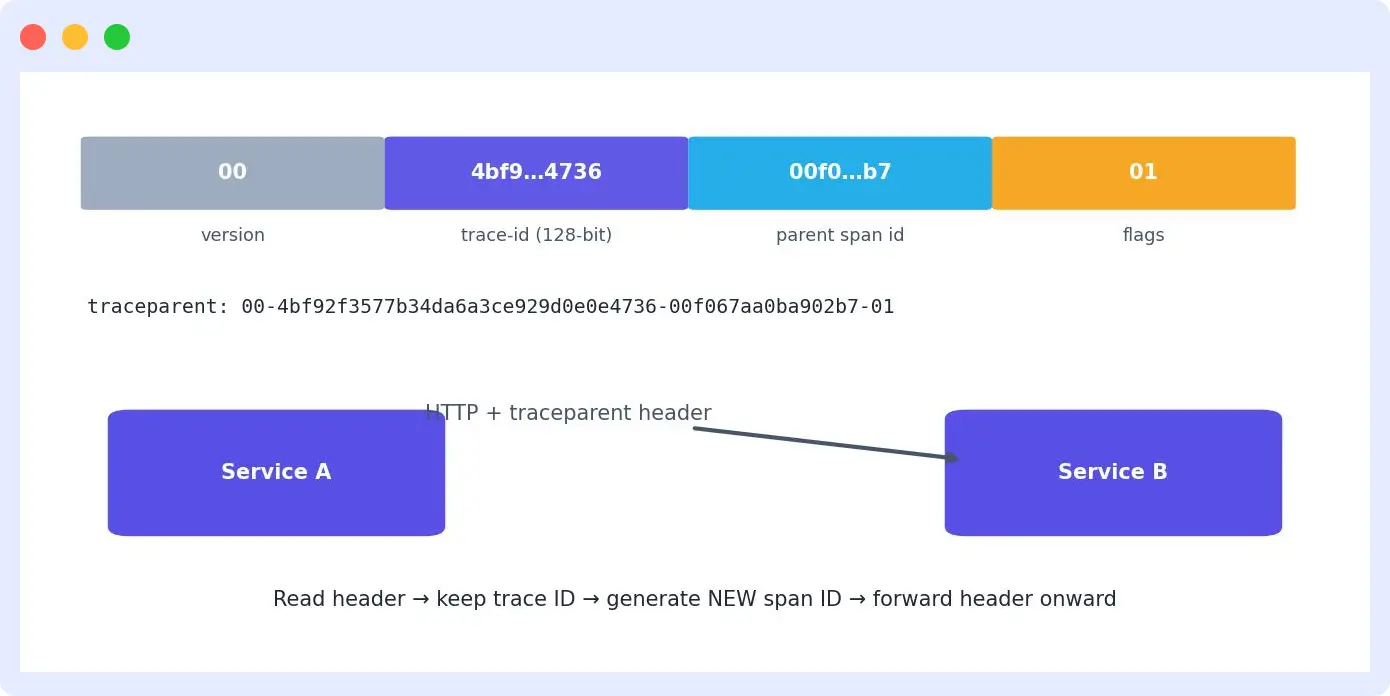
This is the default case. Service A waits for a response while it calls Service B. The trace ID rides that live connection as a header, standardized by the W3C Trace Context spec:
traceparent: 00-4bf92f3577b34da6a3ce929d0e0e4736-00f067aa0ba902b7-01Anatomy of a traceparent header: the W3C standard format broken into four segments: version (00), trace ID (4bf92f3577b34da6a3ce929d0e0e4736), parent span ID (00f067aa0ba902b7), and trace flags (01)
| Segment | Example | Meaning |
|---|---|---|
| Version | 00 | Format version |
| Trace ID | 4bf92f3577b34da6a3ce929d0e0e4736 | 128-bit, shared by every span in the trace |
| Parent span ID | 00f067aa0ba902b7 | The operation that made this call |
| Flags | 01 | Whether this trace is being recorded |
Every service follows the same rule. Read the incoming header. Keep the trace ID. Generate a new span ID for its own work. Forward the header on whatever it calls next.
Synchronous propagation over gRPC
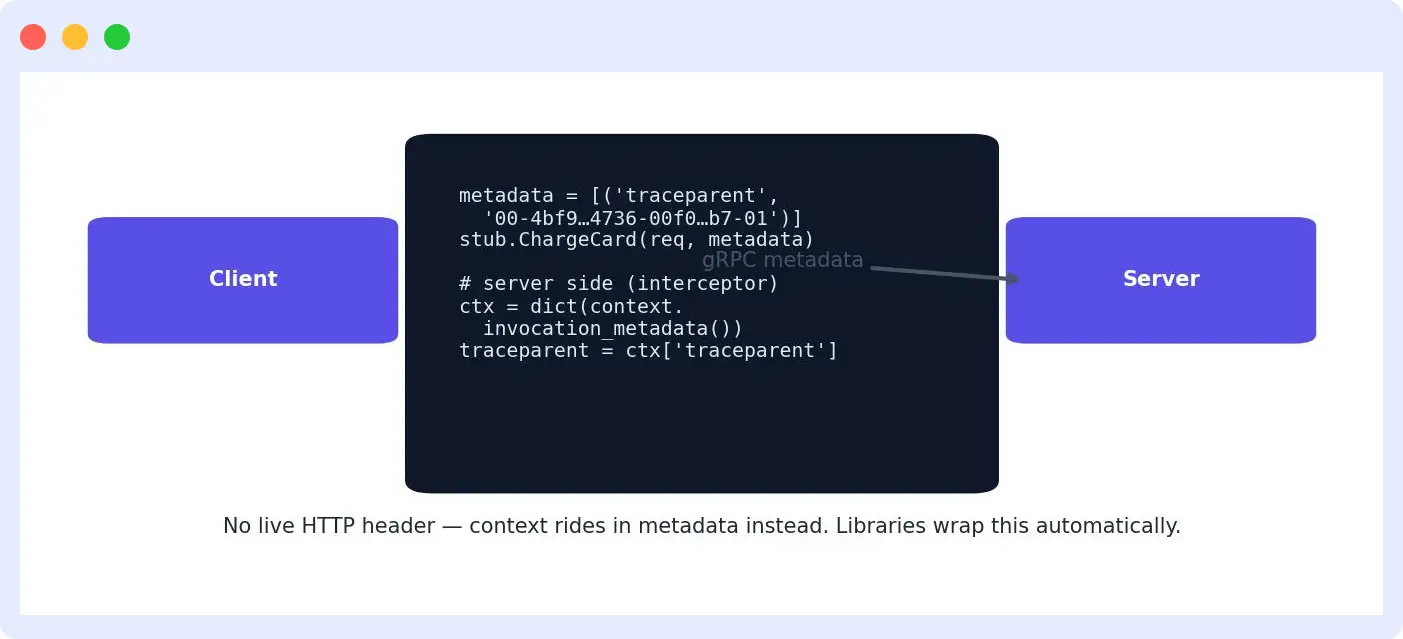
This works the same way, just carried differently. Instead of an HTTP header, the context rides in gRPC metadata:
# Client side: attaching trace context to outgoing gRPC metadata
metadata = [('traceparent', '00-4bf92f3577b34da6a3ce929d0e0e4736-00f067aa0ba902b7-01')]
response = stub.ChargeCard(request, metadata=metadata)

# Server side: reading it back out
def ChargeCard(self, request, context):
    incoming_metadata = dict(context.invocation_metadata())
    traceparent = incoming_metadata.get('traceparent')
Note: Most gRPC-aware tracing libraries wrap this automatically through interceptors. Most engineers never write this by hand.
Asynchronous propagation
A service can finish and respond before the real work happens. The actual next step is a message sitting in a queue, like Kafka, SQS, or RabbitMQ, picked up later by a different process. There’s no live connection to attach a header to. Whoever publishes it must write the trace context directly into the message.
Baggage
One related header travels alongside traceparent: baggage. Where traceparent only carries identity, baggage carries actual key-value data, like a customer tier or region, propagated the same way through every hop.
How spans get reassembled into a trace
Each service creates and exports its spans independently, so they may reach the tracing backend at different times. The backend uses the trace ID and parent-child relationships to connect them and rebuild the complete request path.
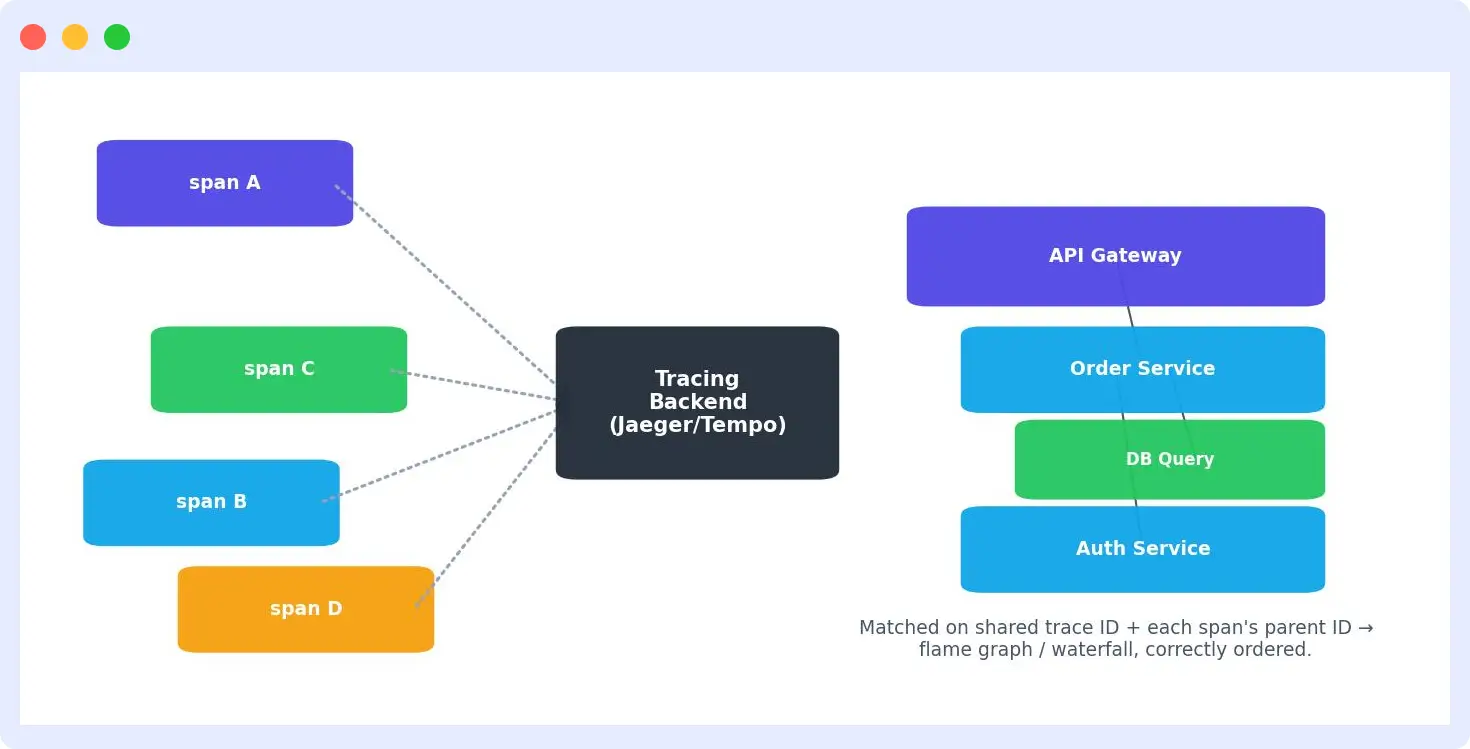
- Spans don’t need to arrive at the tracing backend in the order the actual work happened.
- A span can finish and ship before another span that started earlier has even completed.
- The backend handles this by matching on two things: the shared trace ID, and each span’s recorded parent ID.
- If three spans arrive out of order, all carrying the same trace ID, the backend uses their parent links to rebuild the actual hierarchy after the fact, regardless of arrival order.
- That reconstructed tree becomes the flame graph, or waterfall view. This is why a trace can look complete and correctly ordered even though the underlying spans were shipped in a scattered, arbitrary sequence.
Why not every request gets traced
Recording a full trace for every request gets expensive fast at high traffic volumes, both in storage and in the overhead added to each service. Sampling is the deliberate decision about which requests actually get traced.
- Head-based sampling decides at the very start of the trace, before anyone knows how it’ll turn out. Predictable and cheap. Can miss rare errors, since you don’t yet know if this particular request is the one that fails.
- Tail-based sampling decides after the trace finishes. Guarantees errors and slow requests get captured. Costs more, since every span has to be held in memory until the decision is made.
If you search for a trace ID and find nothing, it doesn’t necessarily mean something is broken. Sampling is the most common cause. Retention limits, a failed export, or simply the wrong search time window can produce the same empty result.
How to create a trace ID and a span ID
A trace ID is created when a new trace starts and stays the same for the entire request. Under the W3C Trace Context standard, it is a 128-bit value represented as 32 hexadecimal characters.
A span ID identifies one operation within that trace. It is a 64-bit value represented as 16 hexadecimal characters. Each new span gets a new span ID while keeping the same trace ID.
For example:
Trace ID: 4bf92f3577b34da6a3ce929d0e0e4736
├── API Gateway
│   Span ID: a1b2c3d4e5f67890
├── Payment Service
│   Span ID: b2c3d4e5f6789012
└── Database Query
    Span ID: c3d4e5f678901234
In practice, you rarely create trace IDs or span IDs yourself. Tracing libraries such as OpenTelemetry generate them automatically, create a new span ID for each operation, and propagate the trace ID to downstream services.
Correlation with logs and metrics
A trace ID is most useful when it doesn’t live in isolation.
- Logs: if your logger includes the active trace ID on every line, you can filter your entire log stream down to one request instantly.
- Metrics: if your dashboards carry the same ID, a latency spike or error alert can lead you straight into the specific traces that caused it.
const { trace } = require('@opentelemetry/api');

function getTraceId() {
  return trace.getActiveSpan()?.spanContext().traceId ?? 'no-trace';
}

logger.info('Order processed', { traceId: getTraceId(), orderId: '12345' });
Attaching a trace ID to every metric data point would create far too many unique label combinations to handle efficiently.
Instead, metrics connect to traces through exemplars. An exemplar attaches a sample trace ID to a specific metric observation, so a dashboard can point to one representative trace behind a spike without tagging every point.
How trace IDs help during production debugging
Trace IDs help engineers follow a failed or slow request across every service it touches. Instead of searching logs from each service by timestamp, you can search one trace ID and see the request path, span timings, errors, and related logs.
For example, a checkout request returns a 500 error:
POST /checkout                    1.8s
│
├── Auth Service                  40ms
├── Order Service                 90ms
└── Payment Service               1.62s
    └── Payment Gateway           1.55s  ERROR
The error appears at the checkout endpoint, but the trace shows that the failure happened during the payment gateway call. Using the same trace ID in the logs can reveal the corresponding error, such as a gateway timeout.
How to find a trace ID in practice
You can find a trace ID in your APM or tracing platform, application logs, or incoming trace context. The quickest method depends on what information you already have.
- If you know the affected request, open it in your tracing platform and copy its
trace_id. - If you only have an error or log entry, search by timestamp, service name, endpoint, or error message and look for the trace ID attached to the matching log.
For requests using W3C Trace Context, the trace ID is also carried inside the traceparent header:
traceparent: 00-4bf92f3577b34da6a3ce929d0e0e4736-00f067aa0ba902b7-01Here, 4bf92f3577b34da6a3ce929d0e0e4736 is the trace ID.
Once you have the ID, search your tracing backend to retrieve the full trace and its spans. If logs are correlated with traces, you can also use the same trace ID to find log entries generated during that request.
If you don’t know the trace ID, narrow the search using the service name, endpoint, time range, duration, or error status, open the matching trace, and retrieve the ID from there.
What a trace ID exposes
A trace ID contains no request details on its own, but the trace data connected to it can contain sensitive information. There is also a separate concern with trace context received from external clients.
- What a viewer can see: A bare trace ID is just a random string, generally safe to show a customer. The real risk sits one layer deeper, in the span data behind that ID. Spans can capture request parameters, internal service names, or full payloads if instrumentation isn’t scoped carefully. A reachable tracing backend can leak that data to a wider audience than intended.
- What a client can send: A traceparent header is just text on an incoming request. A client can forge one, with a fake trace ID or a flag value that forces full sampling. That can pollute a tracing backend with fabricated spans. Treat incoming trace context as unauthenticated input, like any other header.
Common trace ID failures
Trace IDs rarely fail outright. They fail in a few recognizable ways, and the failure usually shows up as a silent gap rather than an application error.
- The trace stops mid-request. Downstream services are missing; no error is shown.
- A second, unrelated trace ID appears. The trace seems to restart partway through.
- One hop is a black box. Everything traces cleanly except one call, which shows no children.
- Timestamps look wrong. Spans appear out of order despite sharing a trace ID.
- The search returns nothing. A valid ID, but no results.
What trace IDs don’t cover
A trace ID tells you where something happened. It doesn’t protect what’s inside the trace. It doesn’t tell you why a decision was made.
- Sensitive data in spans: The trace ID itself is safe to expose. The span attributes behind it are not automatically safe. They can capture full request parameters, internal service names, or payloads if instrumentation isn’t scoped carefully. Scrub sensitive fields the same way you’d scrub logs.
- Cost and storage limits: Trace data is large at scale. Raw cloud storage runs roughly $0.02 per GB per month. Observability vendors typically charge $0.10 to $3.00 per GB once ingestion and indexing are included. Full traces are often retained for a shorter window than logs, commonly 7 to 30 days versus 30 to 90 days, specifically to manage that cost.
- Performance overhead: Instrumentation isn’t free. Well-implemented tracing typically adds a small but real 1 to 3 percent overhead to request processing.
How Middleware helps you use trace IDs for faster troubleshooting
Middleware turns a trace ID into a starting point for root cause analysis across the full request path. Instead of using the ID only to open a trace, you can use it to move between traces, logs, infrastructure metrics, Kubernetes data, and database telemetry tied to the same incident.
Step 1: Start with the trace ID
When a request fails or becomes slow, search for its trace ID in Middleware.
For example:
trace_id=4bf92f3577b34da6a3ce929d0e0e4736Opening the trace shows the services and operations involved in that request, along with their duration and status.
POST /checkout                1.82s
├── inventory-service          74ms
├── payment-service           1.61s
│   └── payment-gateway       1.55s  ERROR
└── order-service               58ms
The trace immediately narrows the problem to payment-service.
Step 2: Identify the slow or failed span
Inspect the span with the highest latency or error status.
In this example:
payment-gateway
Duration: 1.55s
Status: ERROR
Span attributes can provide additional context such as the service name, endpoint, database system, HTTP status, or error details. This helps determine which part of the request needs further investigation.
Step 3: Open the related logs
Use the same trace ID to inspect logs generated during that request.
service=payment-service
trace_id=4bf92f...
level=ERROR
message="Payment gateway timeout"
Instead of searching logs by timestamp and guessing which entries belong to the request, the trace ID filters the logs to the relevant transaction.
Step 4: Check infrastructure and Kubernetes metrics
If the service itself appears slow, check Kubernetes monitoring and infrastructure signals around the same time.
Look for signals such as:
- CPU saturation
- Memory pressure
- Pod restarts
- CPU throttling
- Disk I/O
- Network errors
- Container resource usage
For example: payment-service latency rising tracks alongside pod CPU throttling rising, which tracks alongside the request timeout rate rising. This helps determine whether the application problem is related to the underlying host, container, or Kubernetes workload.
Step 5: Inspect database or external dependencies
A slow span may point to a database, queue, or third-party API rather than the application service itself.
For example:
POST /checkout       1.8s
└── orders-db         1.4s
Database monitoring can then show whether the delay came from:
- Slow queries
- Connection-pool exhaustion
- Lock contention
- High query volume
- Database resource pressure
For external APIs, compare the span with dependency latency, errors, timeouts, and retry activity.
Step 6: Check deployment context
If the issue appeared recently, compare it with deployment and version information.
2:01 PM  payment:v4.7.2 deployed
2:03 PM  p99 latency increased
2:04 PM  timeout errors increased
The timing does not prove the deployment caused the problem, but it gives engineers a clear change to investigate.
Step 7: Use OpsAI to narrow the cause
Middleware’s OpsAI can analyze the telemetry around the affected service, including traces, logs, infrastructure metrics, Kubernetes data, and related events.
The investigation can move from a trace ID to a failed span, to related logs, to infrastructure and dependency signals, to a recent change, to the likely root cause. This reduces manual switching between separate dashboards during an incident. See how OpsAI’s three-stage detection-to-fix workflow does this in practice.
Example: from trace ID to root cause
Suppose a customer reports a slow checkout and you find its trace ID: 4bf92f3577b34da6a3ce929d0e0e4736.
The path runs from POST /checkout at 2.1s, into payment-service at 1.8s, into a database connection wait at 1.5s, to pool utilization at 100%, to a log entry reading “connection acquisition timeout.” The trace ID starts the investigation, but the root cause comes from correlating the trace with database telemetry and logs.
FAQs
What is the difference between a trace ID and a correlation ID?
A trace ID identifies exactly one distributed trace. A correlation ID is defined by the application and can tie together multiple separate traces, for example a checkout, its fulfillment, and a later refund, all under one broader business event.
What is tracestate, and how is it different from traceparent?
traceparent carries the standardized fields needed to identify and continue a trace. tracestate is a separate, optional header defined in the same spec that carries additional vendor-specific data alongside it, without breaking compatibility with the standard format.
Why do I search for a trace ID and find nothing?
Sampling is the most common reason; not every request is traced, though retention limits and export failures can cause the same result.
Where does propagation most commonly break?
At queue and message broker boundaries. HTTP and gRPC propagation are usually automatic once a tracing library is installed. Queue propagation has to be wired in manually, since there’s no live connection to attach context to.
Is it safe to show a trace ID to end users?
The bare ID itself is safe, since it’s just a random string. The real risk is in the span data behind it, which can contain sensitive parameters or internal service details if instrumentation isn’t configured to scrub them.
How long should trace data be retained?
Most teams keep full trace data for a shorter window than logs, commonly 7 to 30 days versus 30 to 90 days, since trace data is significantly larger at the same volume of traffic and costs real money to ingest and index at scale.

