



Dynatrace is a dominant observability platform, but growing teams are finding it increasingly difficult to justify its complexity, opaque DDU-based pricing, and steep learning curve. Whether you are scaling a cloud-native startup, modernizing a mid-size SaaS product, or a large enterprise rethinking vendor lock-in, there is a wide field of capable Dynatrace alternatives that offer better pricing transparency, stronger OpenTelemetry support, and faster time-to-value.
This guide evaluates the top Dynatrace alternatives in 2026 across pricing, features, ease of use, and real-world fit with Middleware, leading the list as the strongest all-around replacement for modern engineering teams.
Key Takeaways
- Dynatrace’s DDU-based pricing results in a median enterprise contract of $182,883/year, making budgeting difficult without a dedicated FinOps function.
- Middleware is the top Dynatrace alternative in 2026: full-stack observability (APM, logs, traces, RUM, synthetics, infrastructure) plus OpsAI auto-remediation, at a fraction of the cost.
- Middleware’s usage-based pricing starts at $0.30/GB with a 14-day free trial and unlimited data ingestion, no host billing, no per-user fees, no DDU math.
- OpenTelemetry-native platforms like Middleware and SigNoz remove the proprietary agent lock-in that comes with Dynatrace’s OneAgent.
- Datadog, New Relic, and AppDynamics are strong enterprise picks but carry similar cost risk at scale; Grafana and SigNoz are free but require real operational investment to self-manage.
- No single tool wins every category, but for teams that want enterprise-grade observability without enterprise-grade cost or complexity, Middleware is the clearest choice in 2026.
Why teams are leaving Dynatrace in 2026
Dynatrace is a technically impressive platform. Its OneAgent auto-instrumentation, Smartscape topology mapping, and Davis AI engine are genuinely best in class for large, heterogeneous enterprise environments. But the same features that make it powerful also make it expensive, rigid, and difficult for teams that are not running 1,000+ host estates to justify.
Here are the most common reasons engineering teams look for Dynatrace alternatives:
Opaque, unpredictable pricing
Dynatrace’s Davis Platform Subscription (DPS) billing model charges across multiple dimensions simultaneously host-hours (memory-tiered), log ingest per GiB, RUM per session, synthetic requests, Kubernetes pod-hours, and separate Davis AI capability units at $3.60/month per host. The median enterprise buyer pays $182,883/year according to verified transaction data, and a host upgraded from 8 GB to 16 GB of RAM quietly doubles its monitoring cost with no in-platform warning. Forecasting spend requires running infrastructure audit scripts before you can even quote a project.
Proprietary agent lock-in
Dynatrace’s OneAgent is powerful but proprietary. Migrating away from it requires re-instrumenting your entire stack. As OpenTelemetry becomes the industry standard for telemetry collection in 2026, teams are increasingly unwilling to bet their observability infrastructure on a closed-format agent they cannot port elsewhere.
Steep learning curve
Mastering DQL (Dynatrace Query Language), Smartscape topology views, and the full DPS configuration stack takes weeks of dedicated onboarding. Smaller or faster-moving teams consistently report adoption falling off outside core DevOps and SRE functions because the tooling is designed for operations managers, not individual developers debugging in real time.
Overkill for cloud-native and Kubernetes-first teams
Dynatrace was designed for large, complex hybrid estates. Cloud-native teams running Kubernetes workloads with ephemeral infrastructure often pay significantly more than they should Dynatrace’s 15-minute billing interval minimum and 4 GiB memory floor inflate costs by 2–4x for short-lived containers and serverless functions.
What to look for in a Dynatrace alternative
Before evaluating options, define what actually matters for your stack and team. The best alternatives all cover these dimensions:
| Criterion | What to evaluate |
|---|---|
| Unified observability | Single pane for metrics, logs, traces, RUM, and infrastructure no stitching tools together |
| Transparent pricing | Clear cost per GB or host with no hidden DDU math or billing surprises |
| OpenTelemetry support | Native OTLP ingestion without proprietary agent translation layers |
| AI / auto-remediation | Anomaly detection, root cause analysis, and ideally agentic incident resolution |
| Deployment flexibility | SaaS, self-hosted, or BYOC depending on compliance requirements |
| Kubernetes-native support | Pod-level visibility, namespace breakdowns, and auto-discovery without manual config |
| Migration ease | OTel compatibility, import tools, and phased rollout support |
| Team accessibility | Developer-friendly UX, not just SRE-optimized dashboards |
Top Dynatrace alternatives in 2026
1. Middleware — best overall Dynatrace alternative
Best for: Engineering teams of all sizes wanting full-stack observability with AI-powered auto-remediation and predictable usage-based pricing.
Middleware is a full-stack observability platform built for modern cloud-native and Kubernetes environments. It unifies APM, distributed tracing, infrastructure monitoring, log management, RUM, synthetic monitoring, and LLM observability under a single timeline covering every observability signal Dynatrace covers, without the complexity, proprietary agents, or opaque billing.
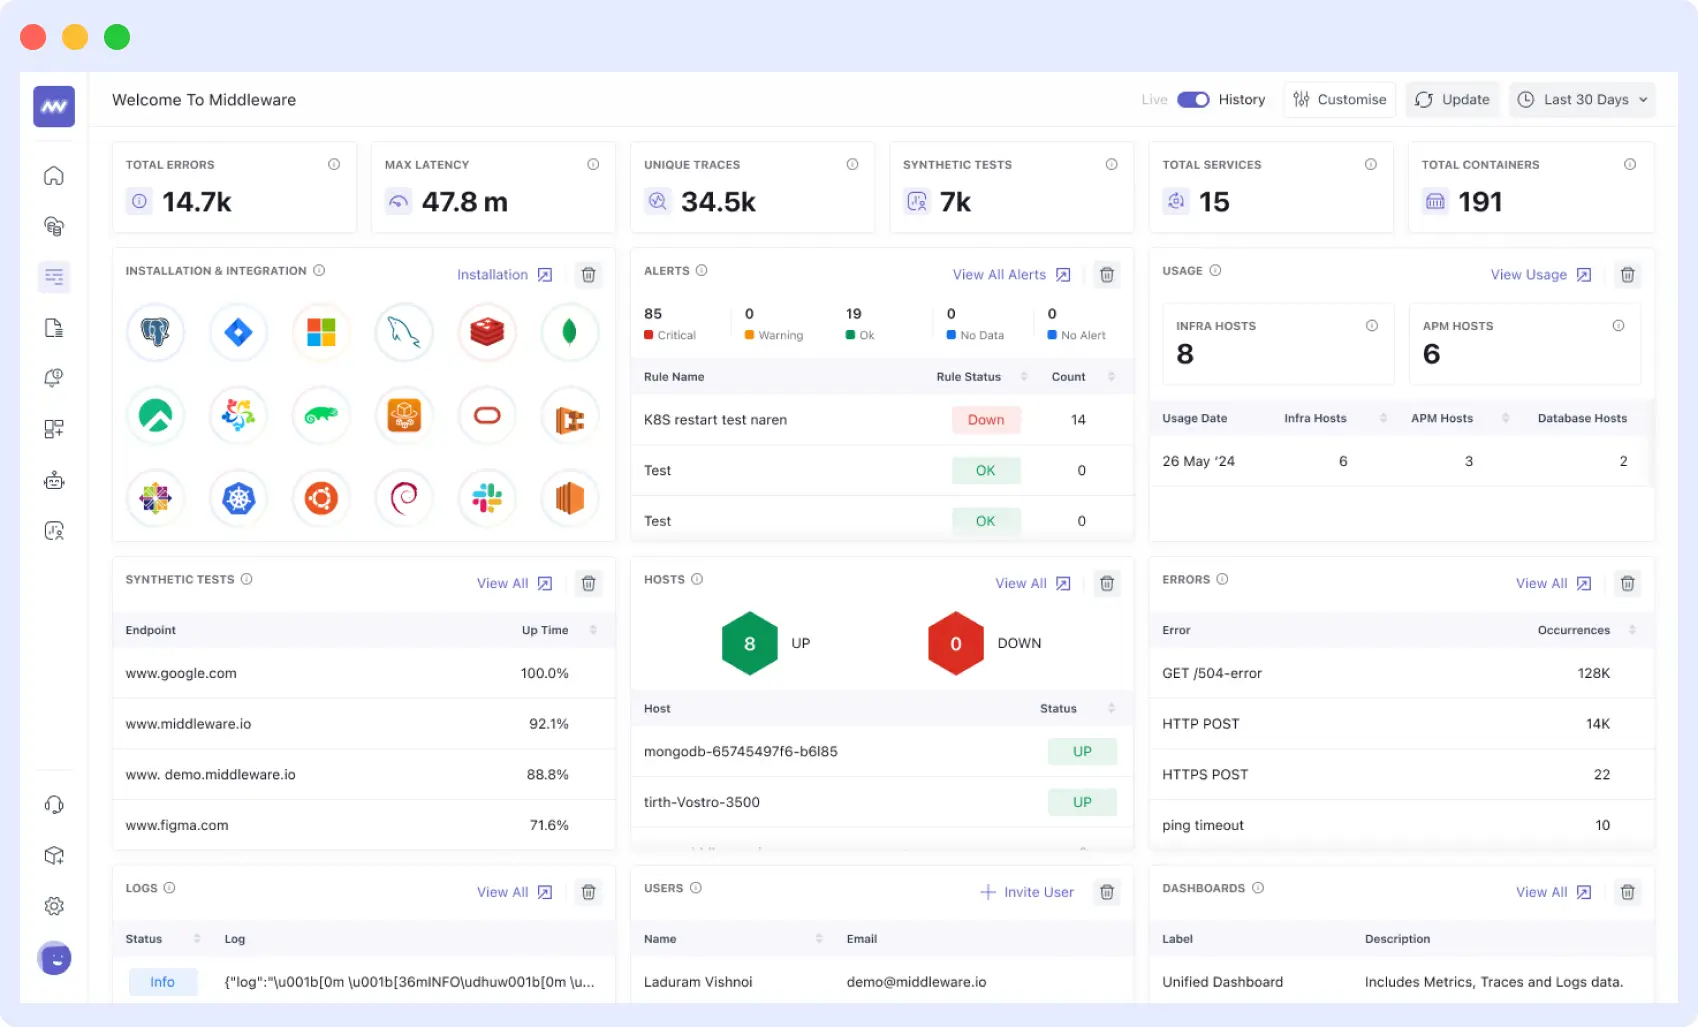
What makes Middleware stand out is OpsAI, its AI SRE agent that does not stop at detecting anomalies. OpsAI actively correlates signals across the full stack, generates postmortems, and resolves incidents without human intervention. This moves observability from passive dashboards to true autopilot, with internal benchmarks showing 80%+ improvement in on-call productivity and 70%+ incident auto-resolution rates across beta customers.
Unlike Dynatrace’s OneAgent, Middleware uses an eBPF-based collection layer and natively supports OpenTelemetry meaning your existing OTel instrumentation works from day one. No migration scripts, no agent replacement. The Kubernetes integration deploys in minutes with automatic pod discovery, namespace-level visibility, and node health metrics out of the box.
Key features
- Unified timeline: metrics, logs, traces, events, and RUM in a single correlated view
- OpsAI (AI SRE agent): auto-detects, correlates, and resolves incidents across the full stack
- eBPF-based data collection with native OpenTelemetry support
- APM with distributed tracing, code-level profiling, and error tracking
- Infrastructure monitoring with real-time Kubernetes visibility
- Real User Monitoring with session replay, Core Web Vitals, and backend correlation
- Synthetic monitoring for uptime and transaction testing
- LLM observability for AI-powered application stacks
- Data pipeline controls to manage ingestion and reduce unnecessary spend
- Deployment options: SaaS, BYOC, and on-premise Enterprise
Middleware vs Dynatrace: key differences
| Capability | Middleware | Dynatrace |
|---|---|---|
| Pricing model | Usage-based ($0.30/GB); no host-based tiers | Memory-GiB-hour + DDU + per-session + per-GiB log |
| Free tier | 14-day free trial, unlimited ingestion, no credit card | 15-day trial, no permanent free tier |
| AI capabilities | OpsAI: agentic auto-remediation, postmortem generation | Davis AI: anomaly detection, root cause analysis |
| Agent type | eBPF + OpenTelemetry native | Proprietary OneAgent |
| Kubernetes support | Auto-discovery, pod-level, namespace breakdowns | Auto-discovery via OneAgent; pods free on FSM hosts (1.301+) |
| LLM observability | Built-in | Limited / not native |
| Per-user pricing | None unlimited users included | None unlimited users included |
| Learning curve | Low intuitive UI, minimal config to get started | High DQL, Smartscape, and DPS require significant onboarding |
| G2 rating | 4.7/5 (55 reviews) | 4.5/5 |
Middleware pricing
Middleware offers three tiers:
- Free Trial: 14 days, unlimited data ingestion, no credit card required
- Pay-as-you-go: $0.30/GB ingested; 30-day data retention; no host-based minimums
- Enterprise: Custom pricing with BYOC/on-premise deployment, custom retention, volume discounts, and SLA-backed support
A team monitoring 50 hosts with Middleware pays only for what it ingests. The same team on Dynatrace full-stack monitoring pays roughly $50,000+ in Year 1 at list prices before logs, RUM, or security add-ons.
Pros and cons
Pros: Predictable usage-based pricing; OpsAI auto-remediation; eBPF + OTel native; unified full-stack observability; fast Kubernetes setup; LLM observability built in; no per-user costs; BYOC and on-premise options for Enterprise.
Cons: Newer platform with a growing integration ecosystem; some advanced enterprise features still maturing; high-volume teams should model ingest costs carefully before committing.
Verdict
Middleware wins on cost, simplicity, and AI-driven remediation for any team not running a 1,000+ host legacy estate. Dynatrace’s OneAgent auto-discovery and Davis causal AI remain best-in-class for large, heterogeneous hybrid environments but at a median contract of $182,883/year and a steep DQL learning curve, most modern engineering teams will get more value from Middleware’s eBPF + OTel stack, OpsAI autopilot, and $0.30/GB pricing from day one.
2. Datadog — best enterprise commercial alternative
Best for: Large enterprises wanting a Dynatrace-caliber feature set with a more developer-friendly UX and a broader integration catalog.
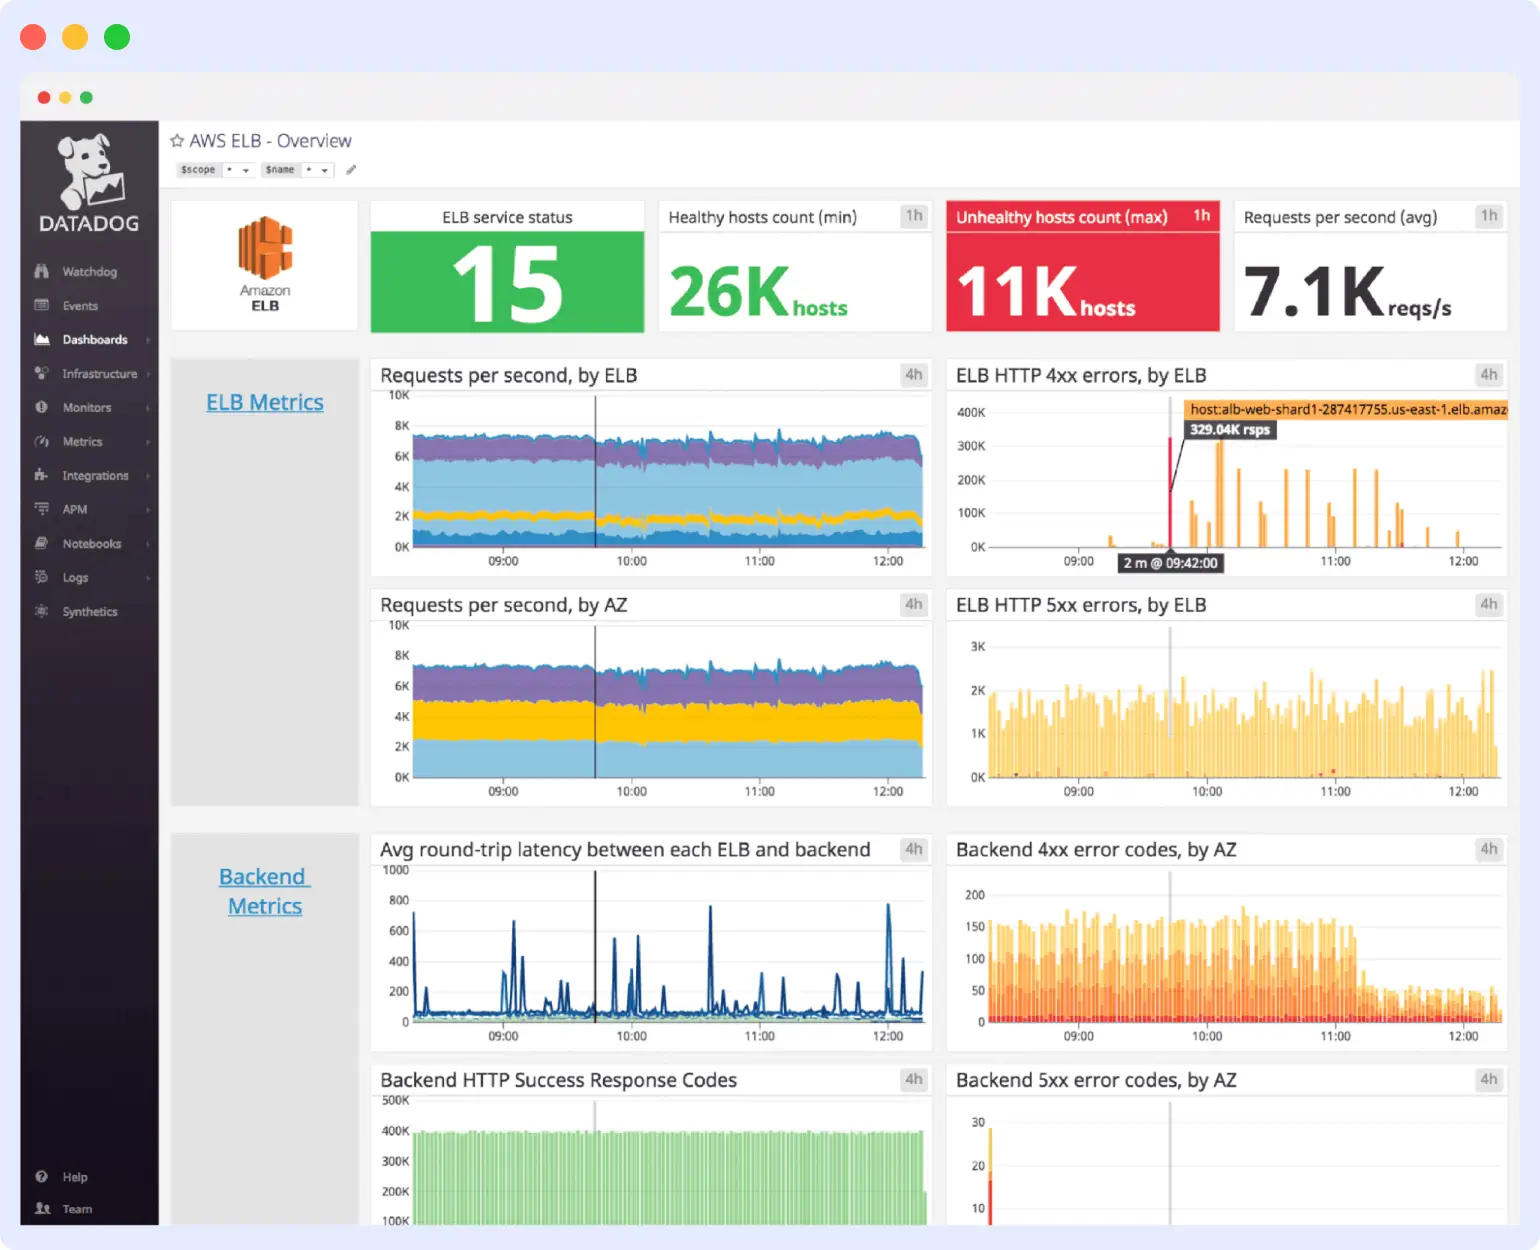
Datadog is Dynatrace’s most direct commercial competitor. With 900+ integrations, a unified APM, log management, distributed tracing, RUM, synthetics, and security monitoring platform, it covers a comparable breadth to Dynatrace while offering a more intuitive developer experience and easier onboarding.
Key features
- 1000+ integrations the broadest ecosystem of any commercial observability platform
- APM with distributed tracing, code-level profiling, and error tracking
- Watchdog AI for automated anomaly detection and root cause analysis
- Built-in security monitoring: CSPM, SIEM, and cloud security posture management
- Real User Monitoring and synthetic testing
- Log management with live tail and archive
- Network performance monitoring
Datadog pricing
Datadog uses a per-host, per-product pricing model. APM starts at $36/host/month (Pro at $42, Enterprise at $48). Infrastructure monitoring starts at $15/host/month. Log management is priced by ingestion and scanning volume. Custom metrics charges at scale can become a significant surprise cost. A 14-day free trial is available.
Pros and cons
Pros: Deepest integration ecosystem; excellent APM depth; strong security monitoring add-ons; more accessible developer UX than Dynatrace; Watchdog AI for automated insights.
Datadog vs Dynatrace: key differences
| Capability | Datadog | Dynatrace |
|---|---|---|
| Pricing model | Per-host, per-product ($15–$48/host/month depending on module) | Memory-GiB-hour DPS; 4 GiB minimum floor per host |
| Free tier | 14-day trial, no permanent free tier | 15-day trial, no permanent free tier |
| AI capability | Watchdog AI anomaly detection and surface-level root cause | Davis AI causal AI with stronger root cause reasoning |
| Agent type | Datadog Agent (proprietary, but OTel-compatible) | Proprietary OneAgent |
| Integration ecosystem | 1000+ integrations broadest in the market | Narrower catalog; strong for enterprise middleware and mainframe |
| Security monitoring | Built-in CSPM, SIEM, cloud security posture management | Application Security (separate module, separate cost) |
| Learning curve | Moderate more developer-friendly than Dynatrace | High DQL and Smartscape require significant onboarding |
| Kubernetes support | Strong auto-discovery, cluster maps, pod monitoring | Strong OneAgent auto-discovery, Smartscape topology |
| G2 rating | 4.3/5 | 4.5/5 |
Cons: Can cost as much or more than Dynatrace at scale; custom metrics charges create unpredictable billing; per-host pricing penalizes ephemeral cloud and serverless workloads; proprietary agents create some lock-in. See our full Datadog alternative comparison →
Verdict
Datadog is better for developer-centric teams who need 900+ integrations and a more intuitive UI. Dynatrace edges ahead for large, heterogeneous hybrid estates where OneAgent auto-discovery saves significant instrumentation effort. Neither beats Middleware on cost-predictability for cloud-native environments Datadog’s custom metrics billing and Dynatrace’s DDU model both create surprises at scale.
3. New Relic — best for full-stack SaaS with a generous free tier
Best for: Teams moving away from Dynatrace’s complexity who want a mature, feature-rich SaaS platform with 100 GB/month free ingestion.
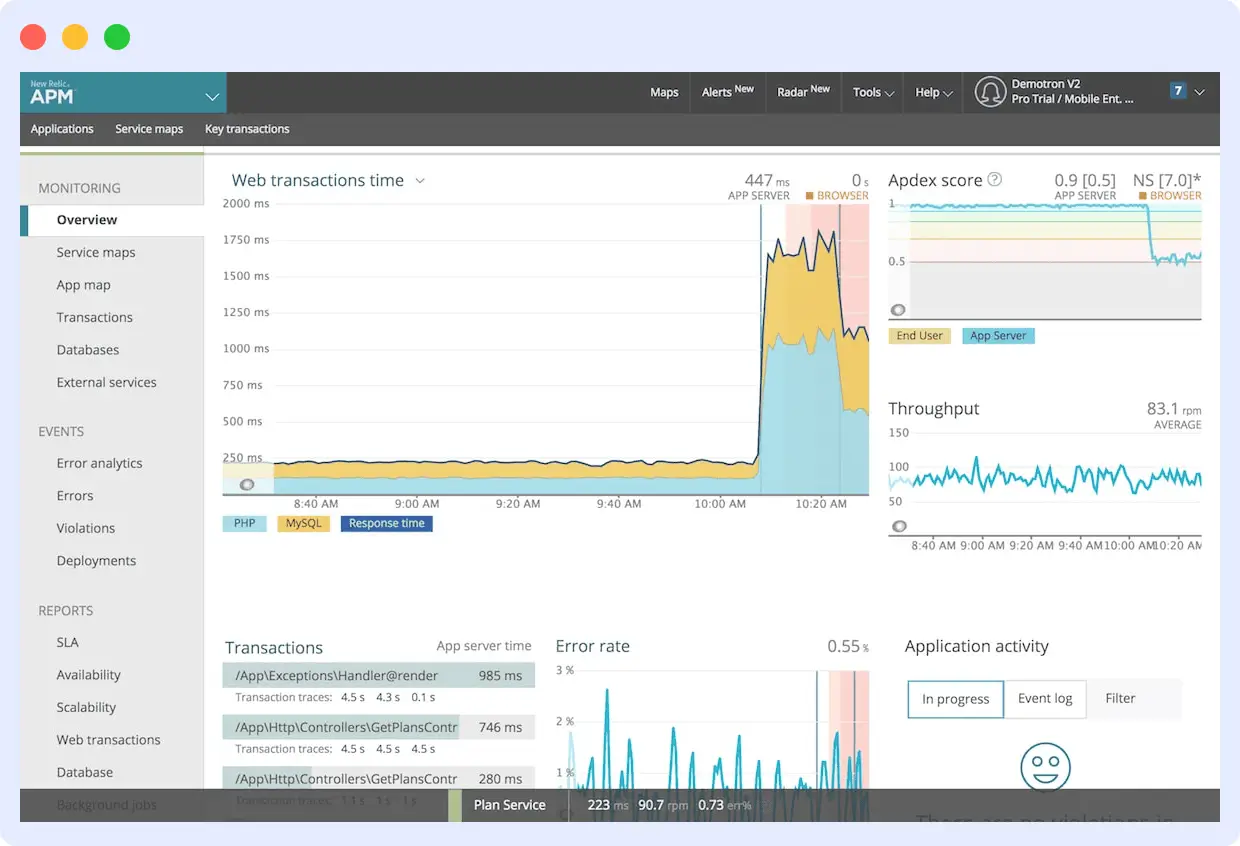
New Relic is a mature full-stack observability platform with 780+ integrations covering APM, infrastructure, logs, traces, RUM, synthetic testing, and AI monitoring. Its NRQL query language enables powerful cross-signal analysis, and the free tier, which includes 100 GB of data per month plus one free full-platform user, makes it genuinely accessible for smaller teams evaluating Dynatrace alternatives.
Key features
- 780+ integrations and 50+ observability capabilities in a single platform
- APM with distributed tracing, error tracking, and code-level profiling
- NRQL for powerful ad-hoc cross-signal analysis
- OpenTelemetry support for partial vendor neutrality
- AI monitoring for LLM-based applications
- Interactive Application Security Testing (IAST)
- 100 GB/month free data ingestion; 1 free full-platform user
New Relic pricing
New Relic is user-centric: $99/user/month for full-platform access (or $349/month for enterprise). Data overage beyond the free 100 GB/month is charged per GB ingested. Basic users are free and unlimited. The tiered model works well for small teams but can get expensive as the user count and data volume grow in parallel.
Pros and cons
Pros: Generous free tier; approachable learning curve vs Dynatrace; unified platform with 780+ integrations; strong NRQL query capabilities; OpenTelemetry support.
Cons: Per-user pricing gets expensive for large teams; NRQL is proprietary and less portable than SQL or PromQL; AI-driven root cause analysis less sophisticated than Davis or OpsAI; data overage costs can surprise growing teams.
New Relic vs Dynatrace: key differences
| Capability | New Relic | Dynatrace |
|---|---|---|
| Pricing model | Data + user-based ($99/user/month full platform; 100 GB/month free) | Memory-GiB-hour DPS; no permanent free tier |
| Free tier | Yes 100 GB/month + 1 free full-platform user permanently | 15-day trial only |
| AI capability | AI anomaly detection and alert correlation; less causal depth than Davis | Davis AI causal root cause analysis, auto-baselining |
| Query language | NRQL (proprietary but powerful for cross-signal analysis) | DQL (proprietary, steeper learning curve) |
| OpenTelemetry support | Supported partial; OTel data ingested via translation layer | Supported partial; OneAgent remains primary collection method |
| Integration catalog | 780+ integrations and 50+ observability capabilities | Narrower; strong for enterprise and legacy systems |
| LLM / AI monitoring | Yes AI monitoring module available | Limited not natively built-in |
| Learning curve | Moderate more approachable than Dynatrace | High DQL and full DPS config requires dedicated onboarding |
| G2 rating | 4.3/5 | 4.5/5 |
Verdict
New Relic is the better entry point for mid-size teams its 100 GB/month free tier and more approachable learning curve make it far easier to adopt than Dynatrace. Dynatrace’s Davis AI and OneAgent remain superior for automated root cause analysis in complex hybrid environments. For most teams, New Relic’s per-user pricing ($99/user/month) becomes a ceiling concern; Middleware’s unlimited-user model scales better as teams grow. See our full New Relic alternative comparison →
4. Grafana stack — best open-source alternative for Kubernetes teams
Best for: Kubernetes-native organizations with strong operational capacity who want maximum vendor flexibility and no licensing costs.
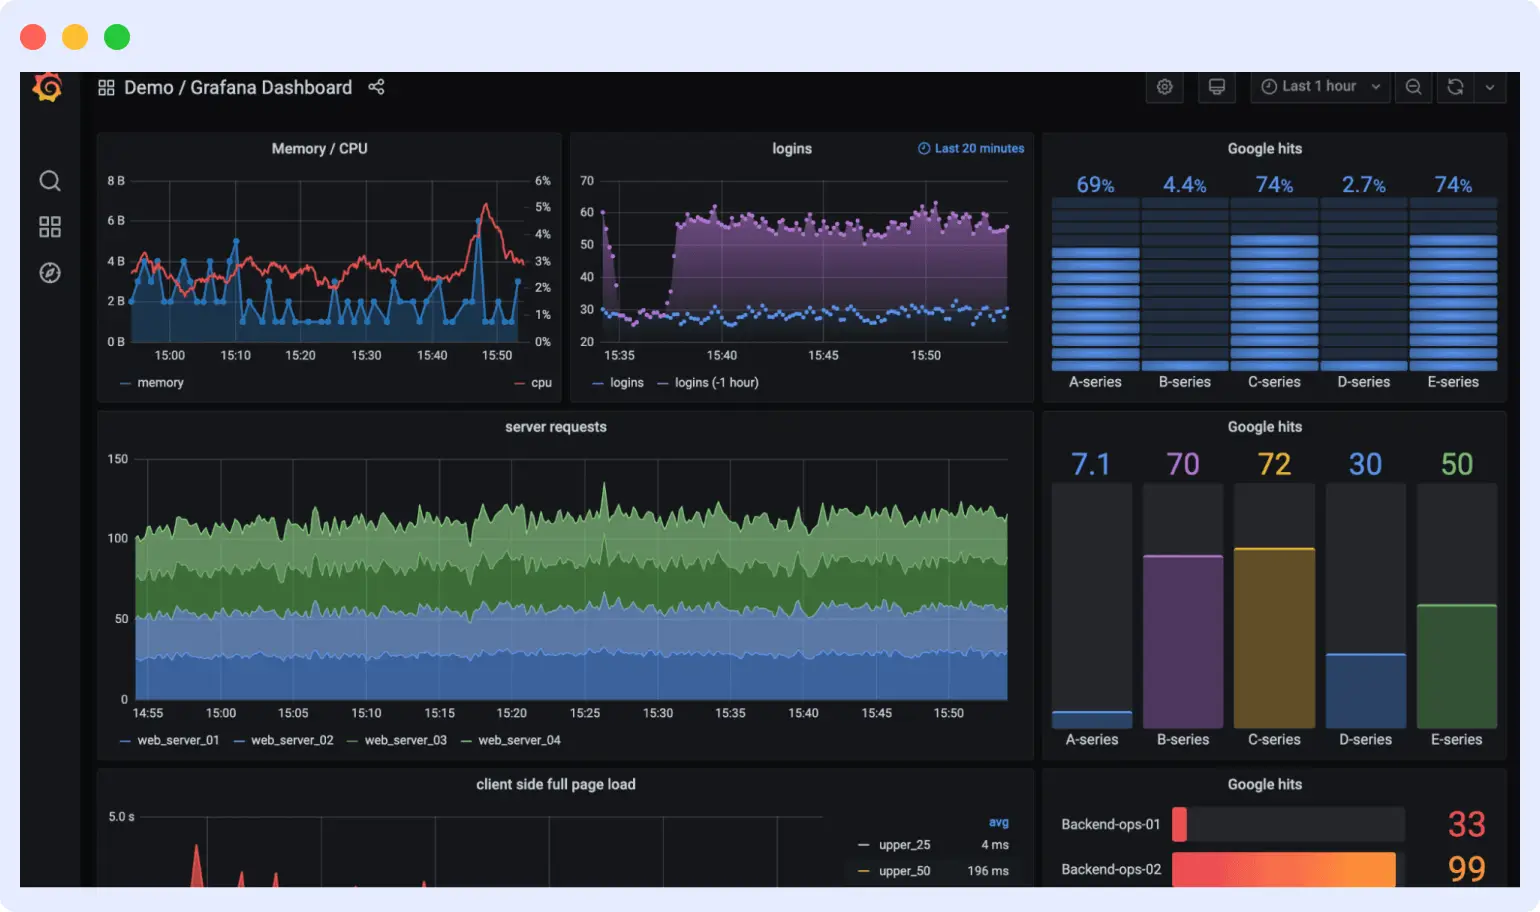
The Grafana observability stack built around Grafana, Prometheus, Loki, and Tempo is the most popular open-source Dynatrace alternative for cloud-native teams. Each component is a best-in-class tool for its signal type: Prometheus for metrics, Loki for logs, Tempo for traces, and Grafana for visualization. Together they form a fully vendor-neutral, OpenTelemetry-compatible observability platform.
Key features
- Prometheus is the CNCF standard for Kubernetes and cloud-native metrics
- Grafana dashboards offer significantly more visualization flexibility than Dynatrace
- Loki provides cost-efficient log aggregation with label-based querying
- Tempo enables distributed tracing with OpenTelemetry-native ingestion
- Grafana Cloud provides a managed path for teams who prefer SaaS delivery
- Fully modular pick only the components you need
Grafana pricing
Self-hosted Grafana stack is free (open-source). Grafana Cloud starts with a free tier (10k active series, 50 GB logs, 50 GB traces per month) and scales to Pro plans at approximately $8/month per 1k active series and $0.50/GB for logs. The operational cost of self-managing the full LGTM stack is significant teams typically need dedicated platform engineering resources.
Pros and cons
Pros: Open-source and free at core; maximum customization and vendor neutrality; world-class visualization with Grafana; strong CNCF community and ecosystem; no licensing cost for self-hosted.
Cons: High operational overhead to self-manage at scale; no built-in AI/ML insights or auto-remediation; requires significant platform engineering investment; multi-tool complexity can recreate the silos Dynatrace solves; no native session replay or synthetic monitoring.
Grafana vs Dynatrace: key differences
| Capability | Grafana Stack | Dynatrace |
|---|---|---|
| Pricing model | Free self-hosted; Grafana Cloud from ~$8/1k active series | Memory-GiB-hour DPS; median enterprise $182,883/year |
| Deployment | Self-hosted (full control) or Grafana Cloud (managed SaaS) | SaaS only (Dynatrace-managed) |
| AI / AIOps | None built-in requires third-party integrations | Davis AI causal anomaly detection and root cause analysis |
| OpenTelemetry | Native OTLP-first across Prometheus, Loki, Tempo | Partial OTel supported but OneAgent remains primary |
| Kubernetes metrics | Best-in-class Prometheus is the CNCF standard | Strong auto-discovery via OneAgent |
| Visualization | Superior Grafana dashboards far more flexible than Dynatrace UI | Smartscape topology maps are unique but less customizable |
| RUM / session replay | Not native requires Grafana Faro (limited) | Yes full RUM and session replay |
| Operational overhead | High 4+ tools to self-manage (Prometheus, Loki, Tempo, Grafana) | Low single platform, fully managed |
| Vendor lock-in | None fully open-source and portable | High OneAgent and DQL create migration friction |
Verdict
Grafana wins on cost and vendor neutrality the open-source LGTM stack has zero licensing cost and full OpenTelemetry compatibility. Dynatrace wins on ease of deployment, AI-driven insights, and unified support. The hidden cost of Grafana is platform engineering time: self-managing Prometheus, Loki, Tempo, and Alertmanager at scale is a significant operational investment that Dynatrace (and Middleware) eliminate entirely.
See our full Grafana alternative comparison → for teams weighing self-hosted control against a managed platform.
5. SigNoz — best OpenTelemetry-native open-source APM
Best for: Developer-centric teams who want an open-source, OTel-native APM with a unified UI and no per-user costs.
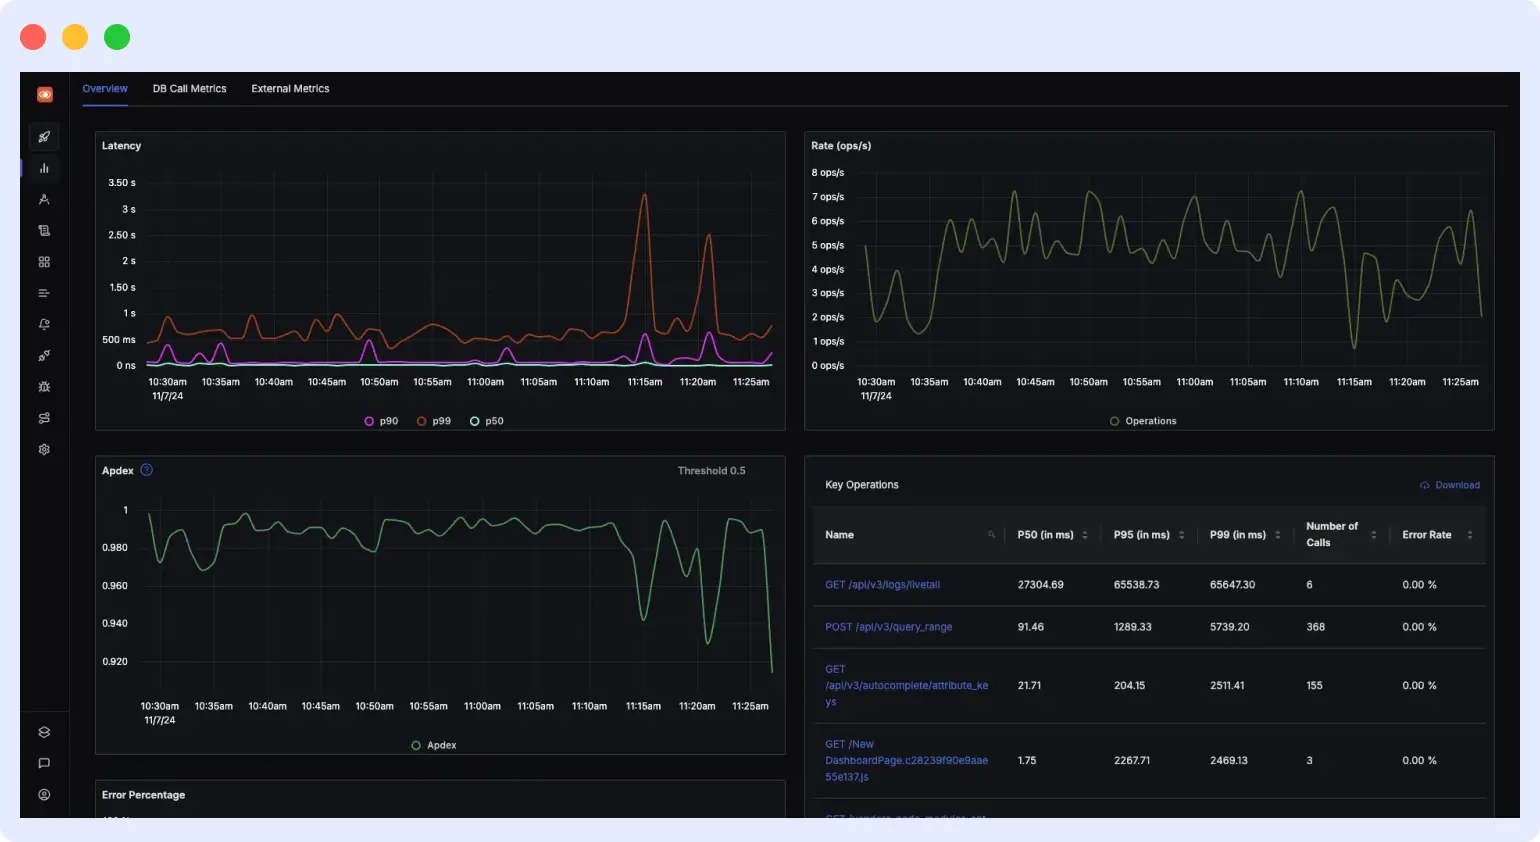
SigNoz is a comprehensive open-source APM and observability platform that natively supports OpenTelemetry. It provides application metrics, distributed tracing, and log management under a single dashboard with a familiar SaaS-like interface. The self-hosted option gives teams full data control, while SigNoz Cloud offers a managed path starting at $49/month.
Key features
- Native OpenTelemetry support works with existing OTel collectors immediately
- Unified metrics, logs, and traces in a single dashboard
- Out-of-box charts for p99 latency, error rates, request-per-second, and top endpoints
- Distributed tracing with trace-to-metric and trace-to-log correlation
- Self-hosted (open-source) or SigNoz Cloud (managed)
- No per-user licensing fees
SigNoz pricing
SigNoz Cloud starts at $49/month. Logs and traces are charged at $0.30/GB ingested; metrics at $0.10 per million samples. The self-hosted community edition is free. No per-user fees on either plan.
Pros and cons
Pros: Fully OpenTelemetry-native; open-source and community-supported; no per-user fees; SQL-friendly query model; strong APM depth for a free tool; self-hosted for full data control.
Cons: No RUM, session replay, or synthetic monitoring; limited AI/AIOps features; self-hosting requires meaningful DevOps overhead; integration ecosystem smaller than enterprise alternatives; no OpsAI-style auto-remediation.
SigNoz vs Dynatrace: key differences
| Capability | SigNoz | Dynatrace |
|---|---|---|
| Pricing model | Free self-hosted; SigNoz Cloud from $49/month ($0.30/GB logs+traces) | Memory-GiB-hour DPS; median enterprise $182,883/year |
| Free tier | Yes fully open-source, self-hosted at no cost | 15-day trial only |
| OpenTelemetry | Native built on OTel from the ground up | Partial OTel supported via translation layer |
| APM depth | Strong p99 latency, error rates, distributed tracing, log correlation | Strongest in class code-level profiling, Davis AI, Smartscape |
| AI / AIOps | Minimal basic anomaly detection | Davis AI causal root cause analysis, auto-baselining |
| RUM / session replay | Not available | Yes full RUM and session replay |
| Synthetic monitoring | Not available | Yes browser and HTTP synthetics |
| Per-user pricing | None unlimited users on both self-hosted and Cloud | None unlimited users included |
| Vendor lock-in | None fully open-source and OTel portable | High OneAgent and DQL |
Verdict
SigNoz is the best open-source APM for OTel-first teams on a tight budget native OTLP ingestion, no per-user fees, and a clean UI make it a compelling free Dynatrace alternative for core APM needs. But it cannot match Dynatrace’s breadth: no RUM, no synthetics, no session replay, and no agentic remediation. For teams who need the full observability stack, Middleware covers everything SigNoz covers and more, at a comparable usage-based price point.
6. AppDynamics (Cisco) — best for enterprise application-centric monitoring
Best for: Large enterprises with complex distributed applications where business transaction monitoring and code-level APM are the primary requirements.
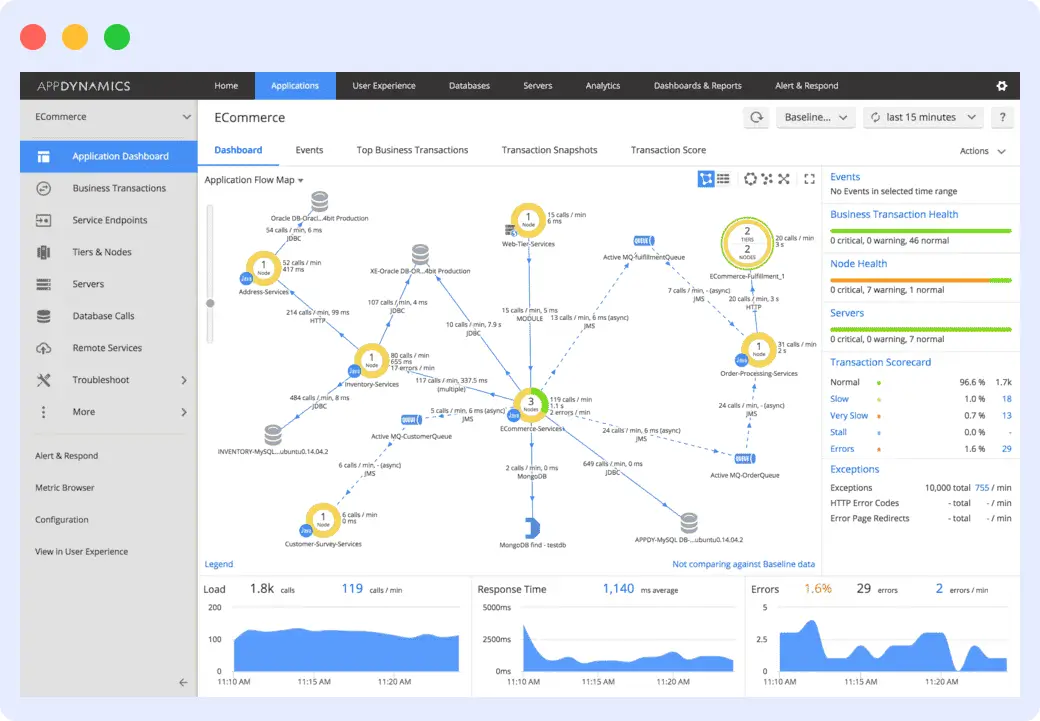
AppDynamics, now part of Cisco’s Splunk AppDynamics portfolio, is an application performance monitoring platform focused on end-to-end business transaction visibility and code-level diagnostics. It provides strong APM capabilities across Java, .NET, Node.js, PHP, and other languages, with deep integrations into enterprise IT ecosystems.
Key features
- Code-level APM across distributed and hybrid environments
- Business transaction monitoring with baseline and anomaly detection
- Network performance monitoring and application security
- Full-stack analytics from application to infrastructure
- Deep Cisco ecosystem integration
- Real User Monitoring and synthetics
AppDynamics pricing
AppDynamics is licensed per CPU core across multiple packages: Infrastructure Monitoring, Premium, Enterprise, and Enterprise for SAP editions. Detailed pricing requires contacting sales. Cisco ownership means roadmap alignment with the Splunk portfolio a factor to evaluate for long-term planning.
Pros and cons
Pros: Deep code-level APM visibility; strong business transaction monitoring; robust enterprise support from Cisco; broad language and framework coverage.
Cons: Pricing is opaque and per-core licensing gets expensive at scale; Cisco acquisition introduces roadmap uncertainty; complex initial configuration; weaker Kubernetes and cloud-native support relative to modern alternatives; no transparent free tier.
AppDynamics vs Dynatrace: key differences
| Capability | AppDynamics | Dynatrace |
|---|---|---|
| Pricing model | Per CPU core; contact sales for all packages | Memory-GiB-hour DPS; published rate card available |
| Ownership | Cisco (acquired 2017) roadmap tied to Splunk AppDynamics portfolio | Independent Dynatrace Inc. (NYSE: DT) |
| AI capability | Business transaction AI, anomaly detection | Davis AI causal root cause analysis; more advanced |
| APM depth | Strong code-level diagnostics, business transaction mapping | Strongest code-level + Smartscape topology + Davis AI |
| Kubernetes support | Available but less Kubernetes-native than Dynatrace | Strong OneAgent auto-discovery, pod-level visibility |
| OpenTelemetry | Partial support | Partial OTel accepted but OneAgent preferred |
| Business transaction monitoring | Industry-leading core AppDynamics differentiator | Available but not the primary focus |
| Free tier | No public free tier | 15-day trial only |
| Roadmap certainty | Lower Cisco/Splunk consolidation ongoing | Higher independent, public company with clear roadmap |
Verdict
Both are enterprise-grade APM platforms with comparable code-level depth, but Dynatrace’s Davis AI and Smartscape topology mapping are meaningfully more advanced than AppDynamics’ anomaly detection. Cisco’s acquisition introduces roadmap uncertainty that Dynatrace does not carry. For net-new deployments, neither AppDynamics nor Dynatrace is the right call for cloud-native teams both are built for large, traditional enterprise estates where Middleware’s modern eBPF stack is a better fit.
7. Elastic Observability — best for teams already in the Elastic ecosystem
Best for: Organizations already using Elasticsearch or Kibana who want to extend into unified observability without adopting a new data platform.
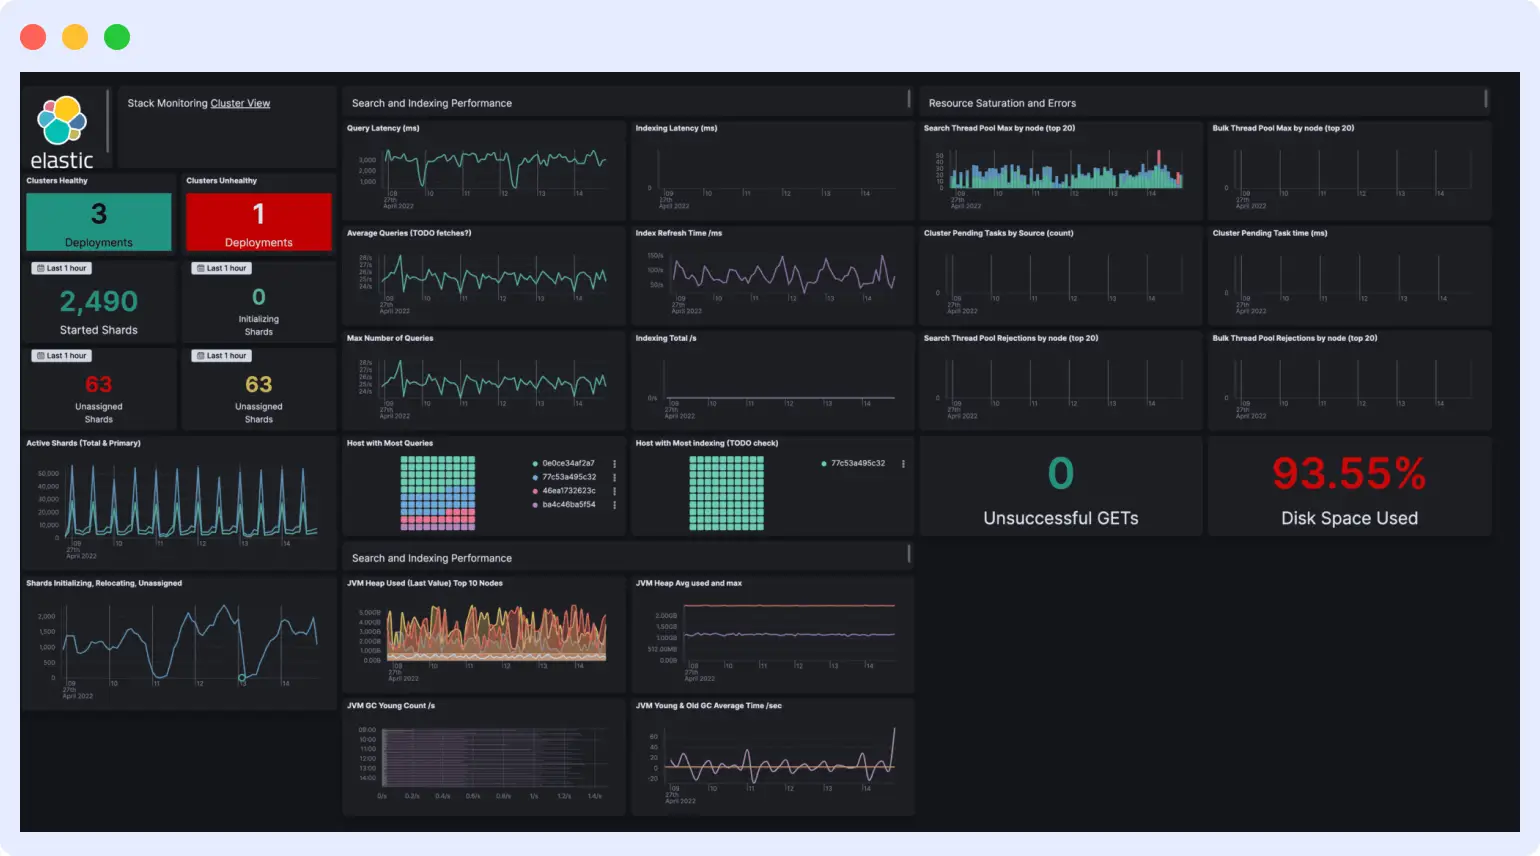
Elastic Observability unifies logs, metrics, APM traces, and uptime monitoring on top of the Elasticsearch data store. For teams already invested in the Elastic stack for search or logging, it provides a natural path to extending observability without changing their data infrastructure. It supports OpenTelemetry and provides machine learning-based anomaly detection through Elastic ML.
Key features
- Unified logs, metrics, APM, and uptime on Elasticsearch
- OpenTelemetry-compatible ingestion
- Machine learning anomaly detection
- Kibana for visualization and dashboards
- Elastic Agent for simplified data collection
- Service map for distributed tracing topology
Elastic pricing
Elastic Cloud pricing starts at approximately $95/month for a minimal cluster. Observability tiers are charged by data storage and compute, not by host. Self-hosted deployment is free (open-source) but requires significant infrastructure investment to operate at scale.
Pros and cons
Pros: Excellent if already using Elasticsearch; powerful search-driven log analysis; flexible deployment (cloud or self-hosted); OTel-compatible; strong visualization in Kibana.
Cons: Steep operational cost and complexity to self-host at scale; Elastic Cloud costs escalate quickly with data volume; less intuitive APM compared to dedicated platforms; no native RUM session replay; ML anomaly detection requires configuration tuning.
Elastic Observability vs Dynatrace: key differences
| Capability | Elastic Observability | Dynatrace |
|---|---|---|
| Pricing model | Data + compute-based; Elastic Cloud from ~$95/month | Memory-GiB-hour DPS; comparable or lower at mid-scale |
| Deployment | Self-hosted (free OSS) or Elastic Cloud (managed SaaS) | SaaS only |
| Log analytics | Best-in-class Elasticsearch full-text search and aggregation | Good Grail data lakehouse with DQL; less flexible than Elastic |
| APM depth | Good distributed tracing, service maps, error tracking | Superior code-level profiling, Davis AI, Smartscape |
| AI / AIOps | ML anomaly detection via Elastic ML | Davis AI causal root cause analysis; more advanced |
| OpenTelemetry | Yes OTel-compatible ingestion | Partial OTel supported via translation layer |
| RUM / session replay | RUM available; no native session replay | Yes full RUM and session replay |
| Kubernetes support | Good Elastic Agent for Kubernetes monitoring | Strong OneAgent auto-discovery and Smartscape |
| Best fit | Teams already running Elasticsearch | Large enterprise hybrid estates |
Verdict
Elastic wins for teams already running Elasticsearch the natural data continuity and powerful log search are hard to replicate elsewhere. Dynatrace wins on out-of-the-box APM intelligence, auto-instrumentation, and unified support. For teams starting fresh, Elastic’s self-hosting complexity and Elastic Cloud cost escalation make it a harder sell than either Dynatrace or Middleware as a primary observability platform.
8. Splunk Observability Cloud — best for large enterprises with complex security and SIEM needs
Best for: Large regulated enterprises that need unified observability and security intelligence in a single platform, with deep log analytics at scale.
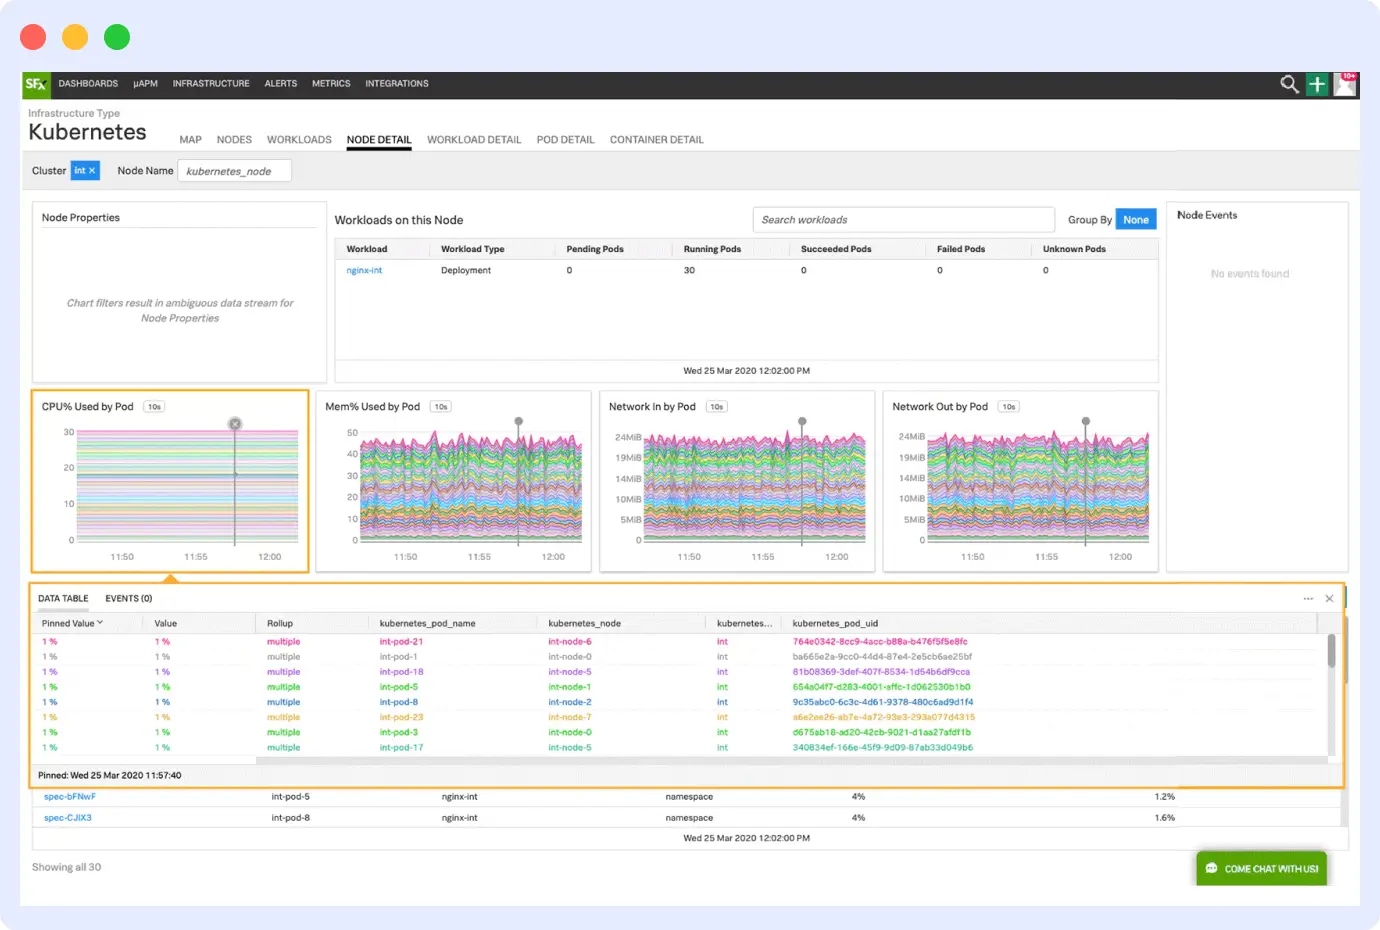
Splunk Observability Cloud provides APM, infrastructure monitoring, log investigation, RUM, and synthetic monitoring across hybrid and multi-cloud environments. Splunk’s core strength remains its unmatched log search and analytics engine, which makes it particularly valuable in environments where security and compliance logging is as important as performance observability.
Key features
- APM with full distributed tracing and NoSample full-fidelity trace capture
- Infrastructure monitoring with AI-driven detector alerts
- Log Observer Connect for correlating logs with traces and metrics
- RUM and synthetic monitoring
- Strong SIEM integration through Splunk Enterprise Security
- OpenTelemetry-native ingestion
Splunk pricing
Splunk Observability Cloud is consumption-based but consistently ranks as one of the most expensive platforms at scale. Log ingestion pricing is a known cost driver. Enterprise contracts typically involve significant negotiation. Cisco’s acquisition of Splunk in 2024 is reshaping the product roadmap alongside AppDynamics.
Pros and cons
Pros: Best-in-class log analytics and search; full-fidelity tracing with NoSample; strong security and SIEM integration; enterprise compliance and certifications; OpenTelemetry-native.
Cons: One of the most expensive platforms in the market; Cisco/Splunk/AppDynamics roadmap consolidation creates uncertainty; significant implementation effort; heavy resource requirements for self-hosted deployments; can feel over-engineered for pure observability use cases.
Splunk vs Dynatrace: key differences
| Capability | Splunk Observability Cloud | Dynatrace |
|---|---|---|
| Pricing model | Consumption-based; log ingestion costs make it the most expensive at scale | Memory-GiB-hour DPS; median enterprise $182,883/year |
| Ownership | Cisco (acquired Splunk 2024) roadmap overlaps with AppDynamics | Independent Dynatrace Inc. (NYSE: DT) |
| Log analytics | Best-in-class Splunk’s core strength, unmatched search and SPL | Good Grail data lakehouse with log retention and DQL |
| APM / tracing | Strong NoSample full-fidelity trace capture | Stronger Davis AI causal analysis on top of full APM |
| Security / SIEM | Industry-leading Splunk Enterprise Security integration | Application Security module (separate cost); weaker SIEM |
| AI capability | AI detectors and anomaly detection; no Davis-level causal AI | Davis AI causal root cause analysis; more advanced |
| OpenTelemetry | Native OTLP-first ingestion | Partial OTel supported via translation layer |
| RUM + synthetics | Yes both available | Yes both available |
| Best fit | Regulated enterprises needing unified obs + SIEM | Large hybrid estates needing AI-powered auto-instrumentation |
Verdict
Splunk’s NoSample full-fidelity tracing and SIEM integration make it the stronger choice for regulated enterprises where security and compliance logging are as critical as performance observability. Dynatrace leads on AI-powered root cause analysis and Kubernetes automation. Both are among the most expensive platforms in the market Splunk often costs more than Dynatrace at high log volumes. For pure observability needs without the security overhead, Middleware delivers a stronger ROI than either.
9. LogicMonitor — best for infrastructure-focused IT ops teams
Best for: IT operations teams monitoring hybrid and multi-cloud infrastructure with 2,000+ integration requirements and AIOps-driven alerting.
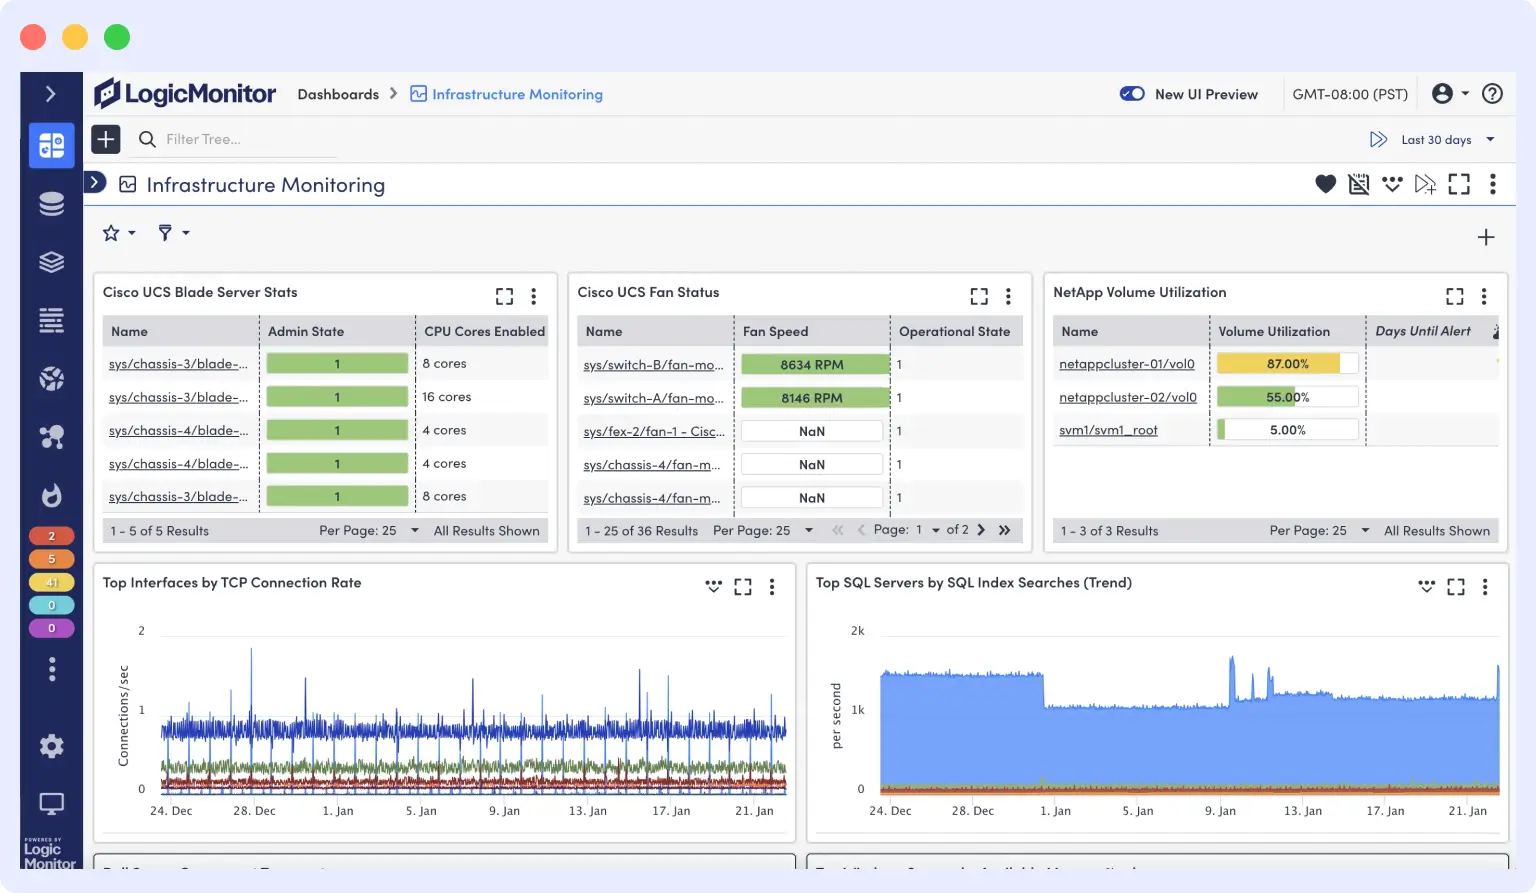
LogicMonitor is a cloud-based unified infrastructure monitoring platform that covers servers, networks, cloud services, containers, and databases through 2,000+ out-of-the-box integrations. Its AIOps layer provides root cause analysis, anomaly detection, and predictive alerting making it a strong Dynatrace alternative for infrastructure-focused operations teams who do not need deep code-level APM.
Key features
- 2,000+ integrations for infrastructure, network, cloud, and container monitoring
- AIOps with root cause analysis and predictive alerting
- Multi-cloud and hybrid infrastructure visibility
- Customizable dashboards and reporting
- Automated discovery and topology mapping
- Alert escalation and on-call management
LogicMonitor pricing
LogicMonitor pricing is subscription-based and requires contacting sales. It scales by the number of monitored resources. No public per-unit pricing is available.
Pros and cons
Pros: Enormous out-of-the-box integration catalog; strong infrastructure monitoring depth; AIOps for predictive alerting; suitable for large heterogeneous IT estates; managed SaaS model.
Cons: Weaker APM compared to dedicated platforms; no native session replay or RUM; pricing requires sales engagement; less suited for cloud-native Kubernetes-first teams; limited developer-facing tooling.
LogicMonitor vs Dynatrace: key differences
| Capability | LogicMonitor | Dynatrace |
|---|---|---|
| Pricing model | Subscription per monitored resource; contact sales | Memory-GiB-hour DPS; comparable enterprise range |
| Primary focus | Infrastructure and network monitoring for IT ops | Full-stack APM + infrastructure + observability |
| Integration catalog | 2,000+ integrations strongest for network and legacy infrastructure | Narrower but deep for enterprise middleware and cloud services |
| APM depth | Limited infrastructure-focused, not code-level APM | Best-in-class code-level profiling, Davis AI, Smartscape |
| AI / AIOps | AIOps for predictive infrastructure alerting | Davis AI full causal root cause analysis across all signals |
| OpenTelemetry | Partial support | Partial OTel ingestion available |
| RUM / session replay | Not available | Yes full RUM and session replay |
| Network monitoring | Strong core LogicMonitor differentiator | Available but not the primary strength |
| Best fit | IT ops teams monitoring heterogeneous infrastructure | DevOps / SRE teams needing full-stack APM + infrastructure |
Verdict
LogicMonitor is the better fit for IT operations teams managing large, heterogeneous infrastructure estates its 2,000+ integration catalog and network monitoring depth exceed Dynatrace’s scope for traditional IT. Dynatrace wins on APM depth, Kubernetes support, and AI-powered root cause analysis. Neither is well-suited for cloud-native development teams; for that use case, Middleware is the stronger platform for both infrastructure and application observability in a single stack.
10. Sematext — best for budget-conscious SMBs wanting full-stack monitoring
Best for: Small to mid-size engineering teams wanting full-stack monitoring (infrastructure, APM, logs, RUM, synthetics) at a significantly lower cost than Dynatrace or Datadog.
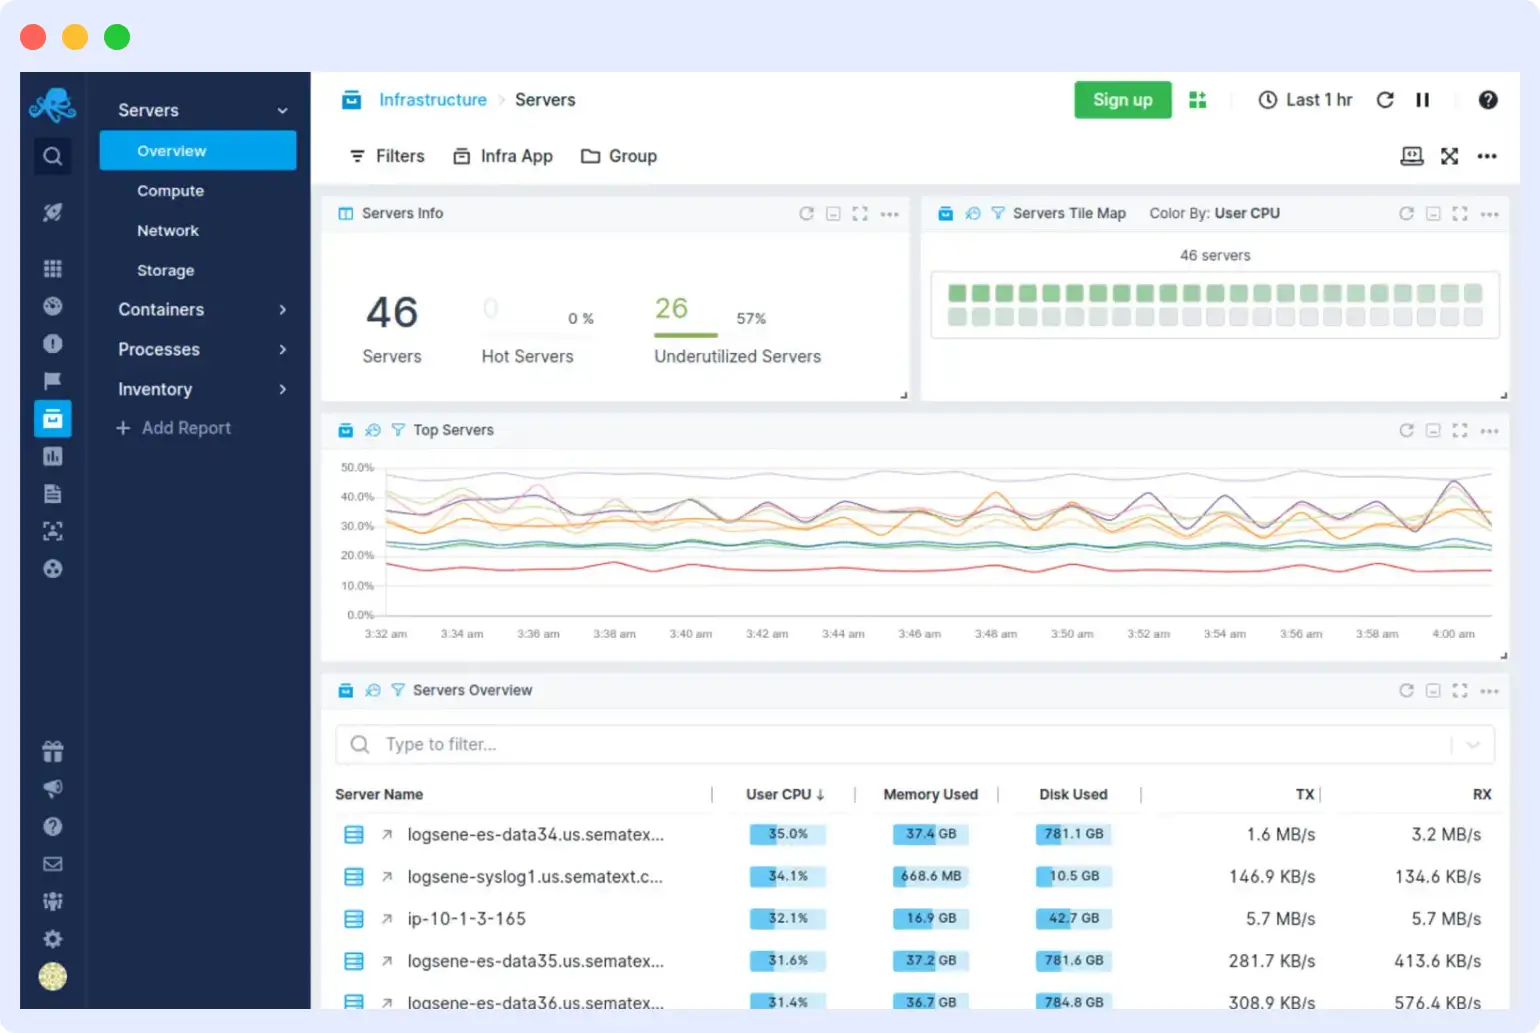
Sematext Cloud provides end-to-end visibility by consolidating logs, metrics, and traces in a single interface. Available as both a fully managed SaaS (Sematext Cloud) and a self-hosted enterprise option (Sematext Enterprise), it covers infrastructure monitoring, APM, real user monitoring, database monitoring, and synthetic monitoring in a unified platform at an SMB-friendly price point.
Key features
- Infrastructure monitoring, APM, RUM, and synthetic monitoring in a unified platform
- Log management with full-text search and correlation
- Database monitoring for major databases
- Self-hosted (Sematext Enterprise) or managed SaaS (Sematext Cloud)
- Alerting with third-party integrations including Slack and PagerDuty
- Lighter operational footprint and faster setup than enterprise alternatives
Sematext pricing
Infrastructure monitoring starts at $3.60/month per host. Service monitoring starts at $10.08/month per agent. Log monitoring starts at $50/month with additional charges at $0.10/GB received and $1.57/GB stored. Multiple tiers are available including pay-as-you-go, pro, and startup options.
Pros and cons
Pros: Very affordable entry pricing for SMBs; both SaaS and self-hosted options; covers all major observability signals; low setup friction; good documentation and support.
Cons: Less feature depth than enterprise platforms; limited AI/AIOps capabilities; integration ecosystem smaller than Datadog or New Relic; less suited for very large or complex distributed environments; no native agentic remediation.
Sematext vs Dynatrace: key differences
| Capability | Sematext | Dynatrace |
|---|---|---|
| Pricing model | From $3.60/host/month (infra); logs from $50/month + $0.10/GB | Memory-GiB-hour DPS; median enterprise $182,883/year |
| Target audience | SMBs and mid-size engineering teams | Mid-to-large enterprise; best value at 1,000+ hosts |
| Deployment | SaaS (Sematext Cloud) or self-hosted (Sematext Enterprise) | SaaS only |
| APM depth | Moderate APM available but less deep than enterprise platforms | Best-in-class code-level profiling, Davis AI, Smartscape |
| AI / AIOps | Minimal basic alerting; no AIOps engine | Davis AI causal root cause analysis and auto-baselining |
| OpenTelemetry | Partial support | Partial OTel ingestion via translation layer |
| RUM / session replay | RUM available; no session replay | Yes full RUM and session replay |
| Kubernetes support | Basic container monitoring available | Strong OneAgent auto-discovery, Smartscape topology |
| Best fit | SMBs that need full-stack monitoring at low cost | Large enterprises with complex hybrid environments |
Verdict
Sematext is the most affordable full-stack monitoring alternative for SMBs infrastructure monitoring from $3.60/host/month puts it within reach of teams that cannot justify Dynatrace’s median $182,883/year contract. Dynatrace’s Davis AI, OneAgent, and enterprise-grade support are in a different class entirely. For growing teams who need more depth than Sematext provides but less cost than Dynatrace demands, Middleware is the natural next step.
Dynatrace alternatives: side-by-side comparison
| Platform | Type | Best for | Starting price | Free tier | OTel native | AI / auto-remediation |
|---|---|---|---|---|---|---|
| Middleware | SaaS / BYOC | All team sizes; cloud-native | $0.30/GB | 14-day trial, unlimited ingestion | Yes (eBPF + OTel) | OpsAI — agentic auto-remediation |
| Datadog | SaaS | Large enterprises | $15/host/month (infra) | 14-day trial | Partial | Watchdog AI (detection only) |
| New Relic | SaaS | Mid-size teams | Free (100 GB/month) | Yes — 100 GB + 1 user free | Partial | AI anomaly detection |
| Grafana Stack | Open-source / Cloud | Kubernetes-native teams | Free (self-hosted) | Yes (Grafana Cloud free tier) | Yes | No built-in AIOps |
| SigNoz | Open-source / Cloud | OTel-first developers | $49/month (Cloud) | Yes (self-hosted) | Yes (native) | Limited |
| AppDynamics | SaaS / Enterprise | Large enterprise APM | Contact sales | No | Partial | Business transaction AI |
| Elastic Observability | SaaS / Self-hosted | Elastic ecosystem teams | ~$95/month (Cloud) | Yes (self-hosted OSS) | Yes | ML anomaly detection |
| Splunk Obs. Cloud | SaaS / Enterprise | Enterprise security + obs | Contact sales | No | Yes | AI detectors |
| LogicMonitor | SaaS | IT ops / infrastructure | Contact sales | No | Partial | AIOps predictions |
| Sematext | SaaS / Self-hosted | SMB full-stack monitoring | $3.60/host/month | No | Partial | Limited |
Why Dynatrace’s pricing is harder to predict than it looks
Dynatrace publishes a rate card, but the real cost is the product of several multiplied billing dimensions:
- Full-stack monitoring: $0.08/GiB-hour (with a 4 GiB minimum per host — so a 2 GiB micro-instance is billed at 4 GiB × 730 hours × $0.01 = $29.20/month)
- Infrastructure monitoring: $0.04/host-hour = ~$29.20/host/month
- Log ingest: $0.20/GiB (separate from FSM cost)
- RUM: $0.00225/session; Session Replay: $0.0045/session
- Synthetic monitoring: $0.0045/action (browser); $0.001/request (HTTP)
- Davis AI capability units: $3.60/month per host on top of monitoring costs
- K8s pods on non-FSM hosts: $0.002/pod-hour
A team running 100 hosts at 8 GiB average, full-stack monitoring, generates roughly $5,840/month in FSM cost alone at list prices — before adding logs, RUM, synthetics, security, or AI. The median enterprise buyer ends up at $182,883/year according to verified procurement transaction data. Compare that to Middleware’s $0.30/GB usage-based model with no host floors, no DDU math, and no per-feature add-on billing.
How to migrate from Dynatrace
Moving from Dynatrace to any alternative requires a structured approach to avoid observability gaps during transition. A proven three-phase migration pattern:
Phase 1: Parallel instrumentation
Deploy your target platform (for example, Middleware’s OTel collector) alongside the Dynatrace OneAgent. Configure dual export so both platforms receive telemetry simultaneously. This gives you a direct comparison of coverage and data fidelity before cutting over.
Phase 2: Validate and migrate dashboards
Recreate your critical dashboards and alert policies in the target platform. Validate that coverage matches or exceeds your Dynatrace setup for every service, namespace, and SLO. Fix gaps before touching production traffic.
Phase 3: Cut over and remove Dynatrace agents
Once validated, remove OneAgent from services progressively — starting with low-criticality hosts. Monitor the transition window carefully, then decommission the remaining Dynatrace infrastructure and cancel the subscription before the next billing cycle.
Middleware’s OpenTelemetry-native architecture makes Phase 1 particularly fast: existing OTel collectors can target Middleware’s OTLP endpoint with a single configuration line, with no agent replacement required on the application side.
Final Verdict
Which Dynatrace alternative should you choose? The right choice depends on your team’s scale, technical capacity, and primary pain point with Dynatrace:
| If your priority is… | Best choice |
|---|---|
| Full-stack observability + AI auto-remediation at any scale | Middleware |
| Breadth of integrations and developer UX at enterprise scale | Datadog |
| Free tier and approachable learning curve for mid-size teams | New Relic |
| Open-source flexibility and Kubernetes-native metrics | Grafana Stack |
| OTel-native APM with no per-user costs and open-source control | SigNoz |
| Enterprise APM with business transaction monitoring (Cisco ecosystem) | AppDynamics |
| Unified observability + SIEM for regulated enterprises | Splunk Observability Cloud |
| Budget-friendly full-stack monitoring for SMBs | Sematext |
For the majority of engineering teams from growing SaaS startups to mid-market engineering organizations Middleware is the strongest Dynatrace alternative in 2026. It covers every observability signal Dynatrace covers, adds OpsAI-powered agentic remediation that goes beyond anything Davis AI offers, and does all of this at a fraction of the cost with no proprietary agent lock-in, no DDU complexity, and no per-host billing floors.
FAQs
What is the best Dynatrace alternative in 2026?
Middleware is the best overall Dynatrace alternative in 2026 for most engineering teams. It provides unified full-stack observability (APM, logs, traces, RUM, infrastructure, synthetics) with OpsAI-powered auto-remediation at $0.30/GB — no host-based minimums, no DDU math, no proprietary agents. Datadog is the best alternative for teams prioritizing integration breadth; New Relic for teams on a budget who want a managed SaaS; Grafana for teams preferring open-source control.
How much does Dynatrace cost per month?
Dynatrace pricing is consumption-based using its Davis Platform Subscription (DPS) model. Full-stack monitoring starts at $0.08/GiB-hour per host (minimum 4 GiB = ~$29.20/host/month). Log ingest costs $0.20/GiB on top. Davis AI capabilities add $3.60/month per host. The median enterprise buyer pays $182,883/year according to verified procurement transaction data. Costs scale non-linearly with host count, memory, log volume, RUM sessions, and synthetic actions.
Is there a free Dynatrace alternative?
Yes. New Relic offers 100 GB/month free data ingestion plus one free full-platform user permanently. Grafana Cloud has a free tier covering 10k active Prometheus series, 50 GB logs, and 50 GB traces. SigNoz is fully open-source and free to self-host. Middleware offers a 14-day free trial with unlimited data ingestion and no credit card required.
Is Middleware a good replacement for Dynatrace?
Yes — particularly for cloud-native and Kubernetes-first teams. Middleware covers every core observability capability that Dynatrace does (APM, distributed tracing, logs, metrics, RUM, infrastructure, synthetics) and adds OpsAI agentic auto-remediation that goes beyond Dynatrace’s Davis AI. It uses eBPF and native OpenTelemetry instead of a proprietary agent, eliminating lock-in risk. And it does all of this at dramatically lower cost with simpler, predictable billing. Teams migrating from Dynatrace can dual-export via OTel collectors with no agent replacement required.
What is the difference between Datadog and Dynatrace?
Both Datadog and Dynatrace are enterprise-grade commercial observability platforms. Dynatrace’s strengths are its OneAgent auto-instrumentation, Smartscape topology mapping, and Davis causal AI making it ideal for large, heterogeneous hybrid estates. Datadog has a broader integration catalog (900+ vs Dynatrace’s narrower ecosystem), a more developer-friendly UX, and generally easier onboarding. Both have complex pricing that can result in high costs at scale; Datadog per-host pricing penalizes ephemeral workloads while Dynatrace’s memory-tiered DDU model is difficult to predict. Neither is as cost-effective as Middleware for cloud-native teams.
What is OpenTelemetry and why does it matter for choosing a Dynatrace alternative?
OpenTelemetry (OTel) is the CNCF open-source standard for collecting metrics, logs, and traces from applications and infrastructure. It is rapidly becoming the default instrumentation layer for cloud-native systems in 2026. Choosing a Dynatrace alternative with native OTel support means you can reuse your existing instrumentation without replacing agents, switch observability backends without re-instrumenting code, and avoid the lock-in that comes with proprietary collection agents like Dynatrace’s OneAgent. Middleware, SigNoz, and Grafana all provide native OTLP ingestion; Datadog and New Relic offer partial OTel support with agent translation layers.

