


Looking for Dash0 alternatives usually means you’ve hit one of three walls: Agent0 is still in Beta, there’s no on-call or incident management built in, or you need a self-hosting path Dash0’s SaaS-only model doesn’t offer.
This guide compares 10 platforms, including Middleware, Datadog, and SigNoz, across OpenTelemetry support, pricing, and free tiers, so you can match the fix to the actual limitation you’re running into.
Key takeaways
- Dash0 is OTel-native with signal-based pricing, but has no built-in incident management and no self-hosting option.
- Middleware adds BYOC and on-prem deployment plus an AI SRE agent with 50%+ auto-resolution internally.
- Datadog and New Relic add session replay, native mobile monitoring, and broader integrations, at the cost of per-host or per-seat pricing.
- Grafana Cloud and SigNoz are the two fully open-source, self-hostable paths off Dash0.
- Chronosphere and Honeycomb fit teams whose main problem is high-cardinality data at scale, not incident response.
- Every alternative here accepts OTLP directly, so migration means an endpoint change, not re-instrumentation.
The 10 best Dash0 competitors and alternatives in 2026
Here’s a side-by-side comparison of ten Dash0 competitors covering where you can run them, how they handle OpenTelemetry, pricing, and the type of team each one fits.
| Tool | Deployment | OTel Support | Free Tier | Best For |
|---|---|---|---|---|
| Middleware | SaaS, on-prem, BYOC, hybrid | Native | Free Forever: Up to 100GB/month, 1K RUM sessions, 20K synthetic checks, 10 browser test runs, and 2M OpsAI tokens | Teams that need a managed OTel platform with deployment flexibility and an AI SRE agent, plus the option to keep telemetry in their own infrastructure |
| Datadog | SaaS only | Supported | Yes, 5 hosts with 1-day retention | Teams that need session replay, security monitoring, and 1000+ integrations and have the budget for it |
| New Relic | SaaS only | Native | Yes, 100GB/month + 1 full platform user | Teams that want full-stack coverage without per-host fees and can manage user seat costs |
| Dynatrace | SaaS, Managed (on-prem) | Supported | 15-day trial; 3-host free tier | Large enterprises that want AI-driven automation and zero-touch instrumentation |
| Grafana Cloud | SaaS managed | Native | Yes, 10K metrics series, 50GB logs, 50GB traces, 3 users | Teams already running Prometheus, Loki, or Tempo who want a managed backend |
| Better Stack | SaaS only | Native | Yes, 10 monitors, 3GB logs, 30GB metrics | Teams that want observability, AI SRE, and incident response (on-call, status pages) in one platform |
| Honeycomb | SaaS only | Native | Yes, 20M events/month | Teams debugging high-cardinality production traces where queryable wide events matter |
| IBM Instana | SaaS, self-hosted | Supported | 14-day free trial, no permanent free plan | Enterprises running complex Kubernetes and microservices environments that want zero-config auto-instrumentation |
| Chronosphere | SaaS, control plane | Native | No free tier; pilots typically free | Teams with high-cardinality metrics and traces at scale who need to control retention and cost |
| SigNoz | Self-hosted, cloud | Native | Free open source; cloud free trial | Teams that want an open-source OTel-native stack with the option to self-host on ClickHouse |
1. Middleware
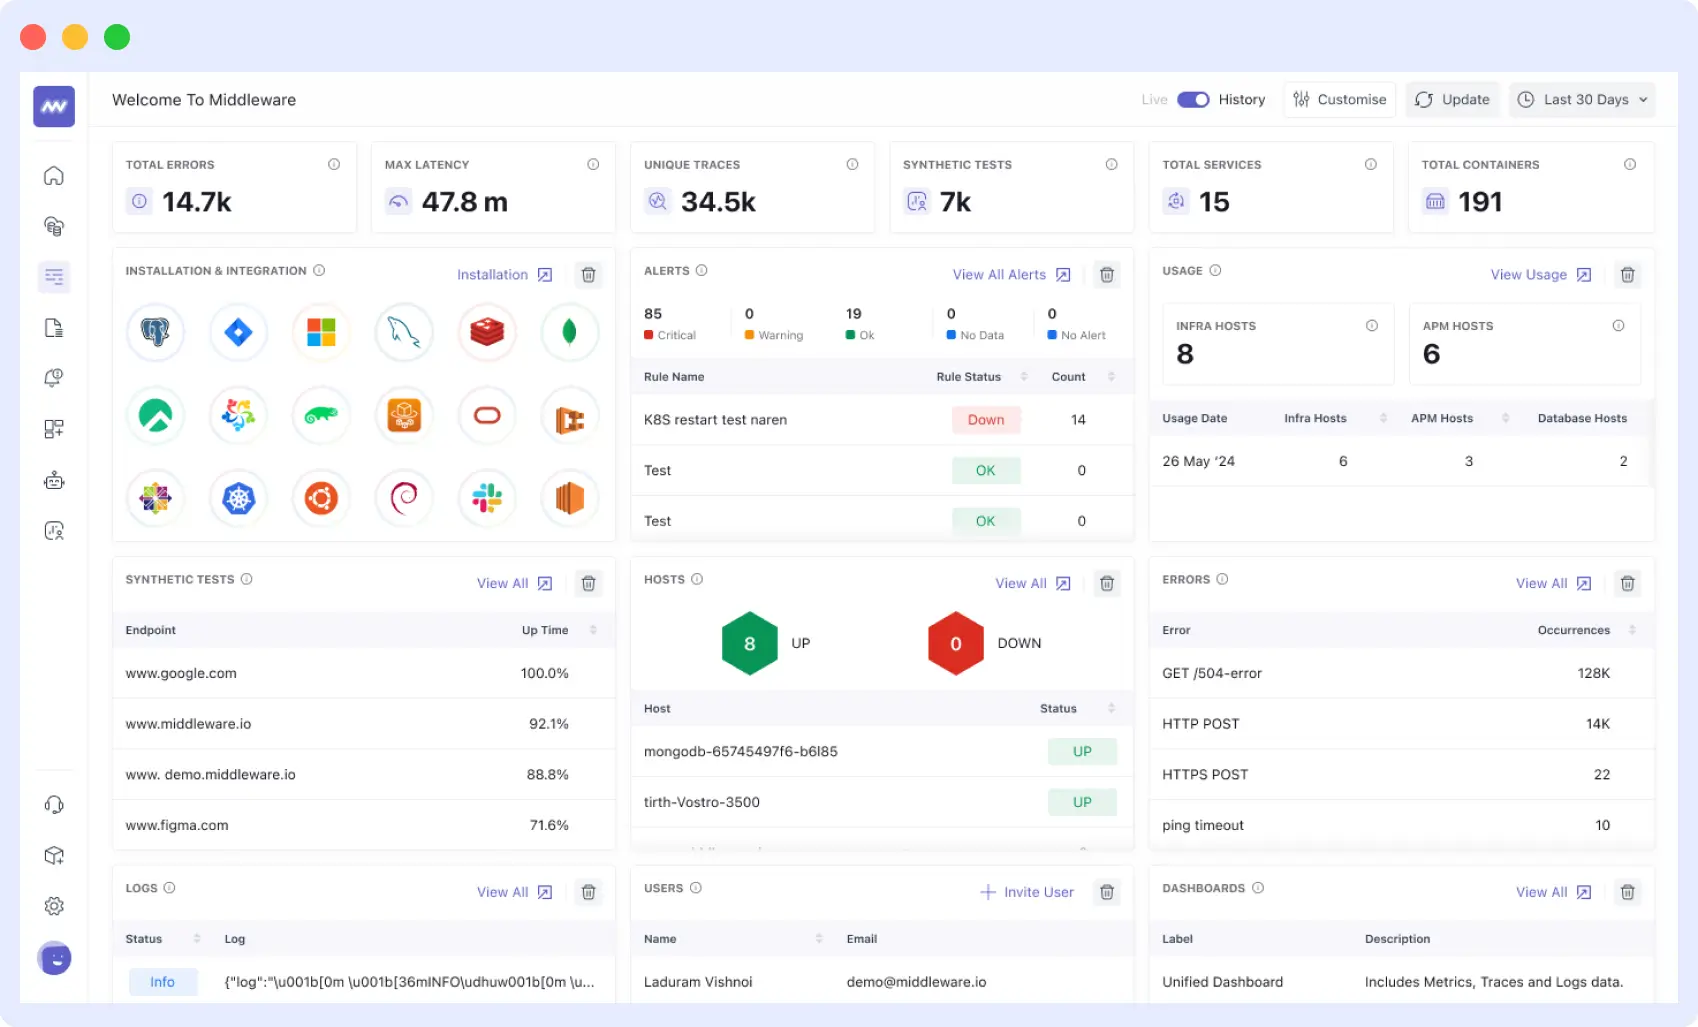
Middleware is a managed observability platform built on OpenTelemetry. It’s best for teams that want OTel-native ingestion plus the option to keep telemetry in their own cloud across SaaS, on-prem, and BYOC. The OTel-based agent installs with one command.
Why it’s a Dash0 alternative
- OpsAI, an AI SRE agent, detects production issues, runs root cause analysis, and opens a GitHub pull request with the fix. Internal teams see 50%+ auto-resolution, and beta customers report 70%+. Dash0’s own Agent0 also drafts pull requests since reaching general availability, so the real difference between the two is deployment flexibility, not AI maturity.
- Middleware’s real user monitoring, synthetic checks, and database monitoring run on the same BYOC or on-prem deployment as the rest of the platform, so regulated teams can keep frontend and database telemetry in their own cloud instead of Dash0’s SaaS-only model.
- Point your OTel Collector at the Middleware OTLP endpoint, and Dash0 instrumentation carries over with a config change instead of new code, since both platforms are OTel-native end to end.
- BYOC and on-prem deployment give teams a self-hosting path that Dash0’s SaaS-only model doesn’t offer.
Pricing
Middleware offers a 14-day free trial with unlimited data ingestion, RUM, and synthetic checks, along with 10 browser test runs and 2 million OpsAI tokens. After the trial, users can continue with the Free Forever plan by adding a credit card, which includes up to 100GB of data, 1,000 RUM sessions, 20,000 synthetic checks, 10 browser test runs, and 2 million OpsAI tokens per month, with 14-day retention. Usage beyond these limits is billed at Pay As You Go rates, starting at $0.30 per GB for metrics, logs, and traces, $1 per 1,000 RUM sessions, $1 per 5,000 synthetic checks, and $10 per 1,000 browser test runs. See the Middleware pricing page for full details.
Limitations
Middleware is a younger platform than Datadog or New Relic. Most observability features match what older platforms offer, but Middleware doesn’t yet ship security monitoring or SIEM as part of the platform. Enterprise customers like Walmart, Hoichoi, and CEAT already use the platform at scale, so teams that don’t need security tooling on the same vendor get a mature observability product.
Verdict
The Dash0 vs Middleware choice comes down to deployment flexibility more than AI maturity now that both platforms’ agents draft pull requests. Pick Middleware if you want OTel-native ingestion with the option to run in your own cloud through BYOC or on-prem. Skip if you need security and SIEM under the same roof as observability.
Start your 14-day free trial of Middleware with unlimited data ingestion.
2. Datadog
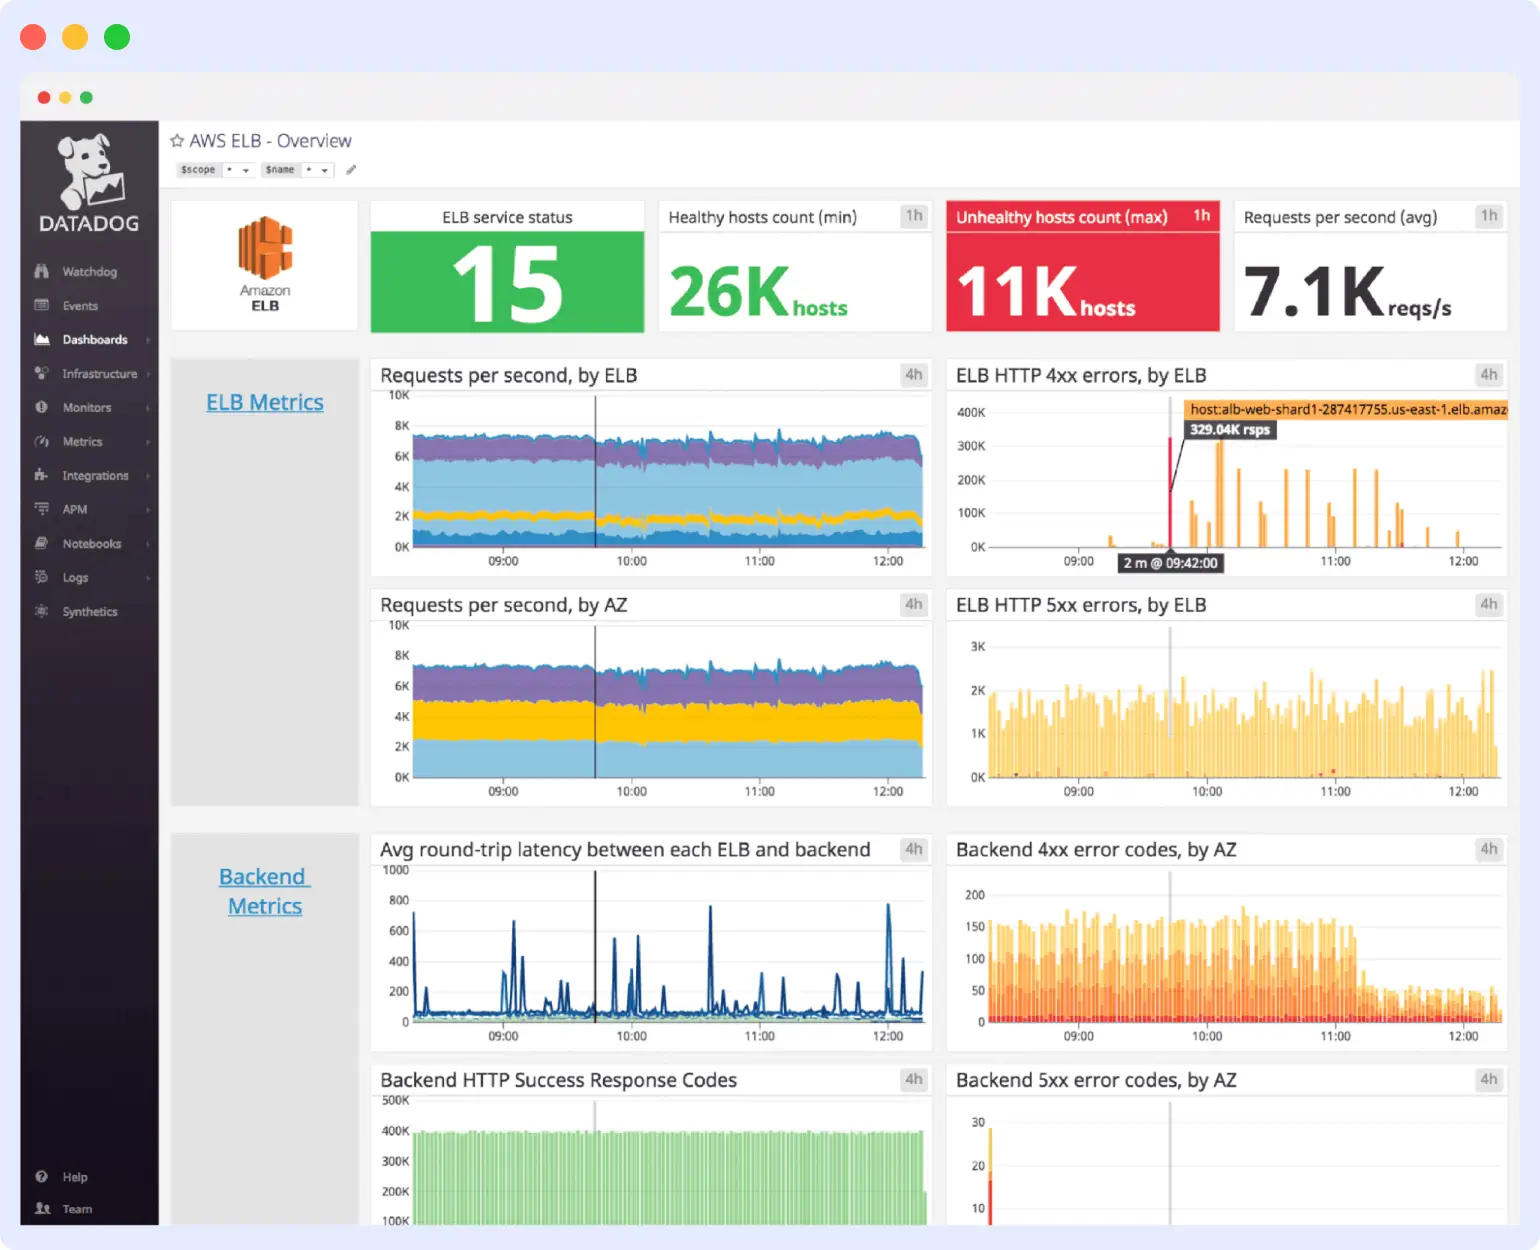
Datadog is a full-stack observability platform with session replay, security monitoring, and multi-cloud management. Teams pick Datadog when they need broad feature coverage without waiting on newer platforms to catch up, and can absorb the pricing complexity that comes with it.
Why it’s a Dash0 alternative
- 1000+ integrations with ready-made dashboards, well beyond what a newer platform like Dash0 has built out.
- Datadog accepts OTel Collector output through its Datadog exporter, so moving off Dash0 means changing the endpoint, not re-instrumenting.
- APM, infrastructure, RUM, synthetics, and security monitoring share one data model, which fills the incident management and session-replay gaps reviewers cite against Dash0.
Pricing
Datadog has a free tier for 5 hosts with 1-day retention, but it doesn’t include APM, logs, or any add-on. Paid plans start at $15 per host per month for infrastructure and $31 per host per month for APM. Logs cost $0.10 per GB ingested plus $1.70 per million events indexed. See the full Datadog pricing breakdown.
Limitations
Datadog’s pricing is hard to predict next to Dash0’s flat per-signal model. Per-host fees, per-GB log ingest, and separate charges for custom metrics, RUM sessions, and synthetic checks all add up, and bills can spike without warning. Teams coming from Dash0’s cost transparency feel this shift the most.
Verdict
Dash0 vs Datadog is a trade of predictable, signal-based pricing for a mature, all-in-one feature set. Pick Datadog if your team needs RUM, synthetics, and security monitoring under one platform today. Skip if predictable bills and OpenTelemetry-first simplicity are what drew you to Dash0 in the first place.
3. New Relic
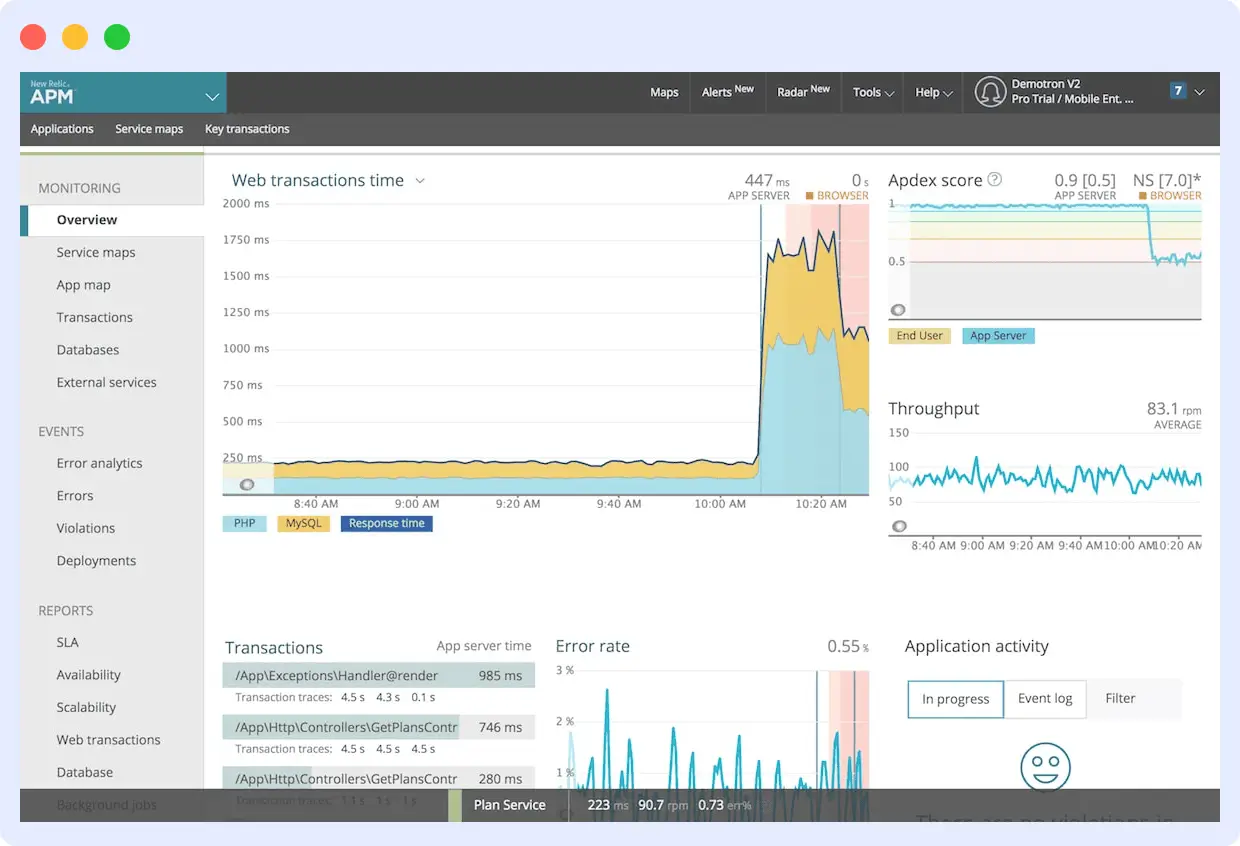
New Relic is a full-stack observability platform with native OpenTelemetry support and 780+ integrations. Teams that want APM, logs, infrastructure, and synthetics under one platform tend to land on New Relic, since it charges for data ingest instead of per host.
Why it’s a Dash0 alternative
- New Relic’s free tier has no time limit, so small teams migrating off a Dash0 trial can run real production observability without paying immediately.
- New Relic has a native OTLP endpoint, so Dash0-instrumented services only need an endpoint and API key swap.
- Mobile monitoring and AI-powered analytics through New Relic AI round out coverage where Dash0 focuses on web rather than native mobile telemetry.
Pricing
New Relic offers a free tier with 100GB of monthly ingest, one full platform user, and unlimited basic users. Beyond that, data costs $0.40 per GB on Original Data or $0.60 per GB on Data Plus. Full platform users cost $349 each per month on the Pro plan (annual billing), and core users cost $49 each per month.
Limitations
A team of 6 has to move from Standard to Pro because Standard caps at 5 full platform users, and the bill jumps sharply from that seat-based structure, which is the opposite of Dash0’s no-per-seat pricing. New Relic also uses its own query language (NRQL), so dashboards built on the platform don’t transfer if you leave.
Verdict
Dash0 vs New Relic comes down to team size and query language preference. Pick New Relic if your team is small enough that the free tier or low seat counts cover most of your usage and you want a bigger integration catalog than Dash0 currently has. Skip if per-seat pricing would grow faster than your data costs.
4. Dynatrace
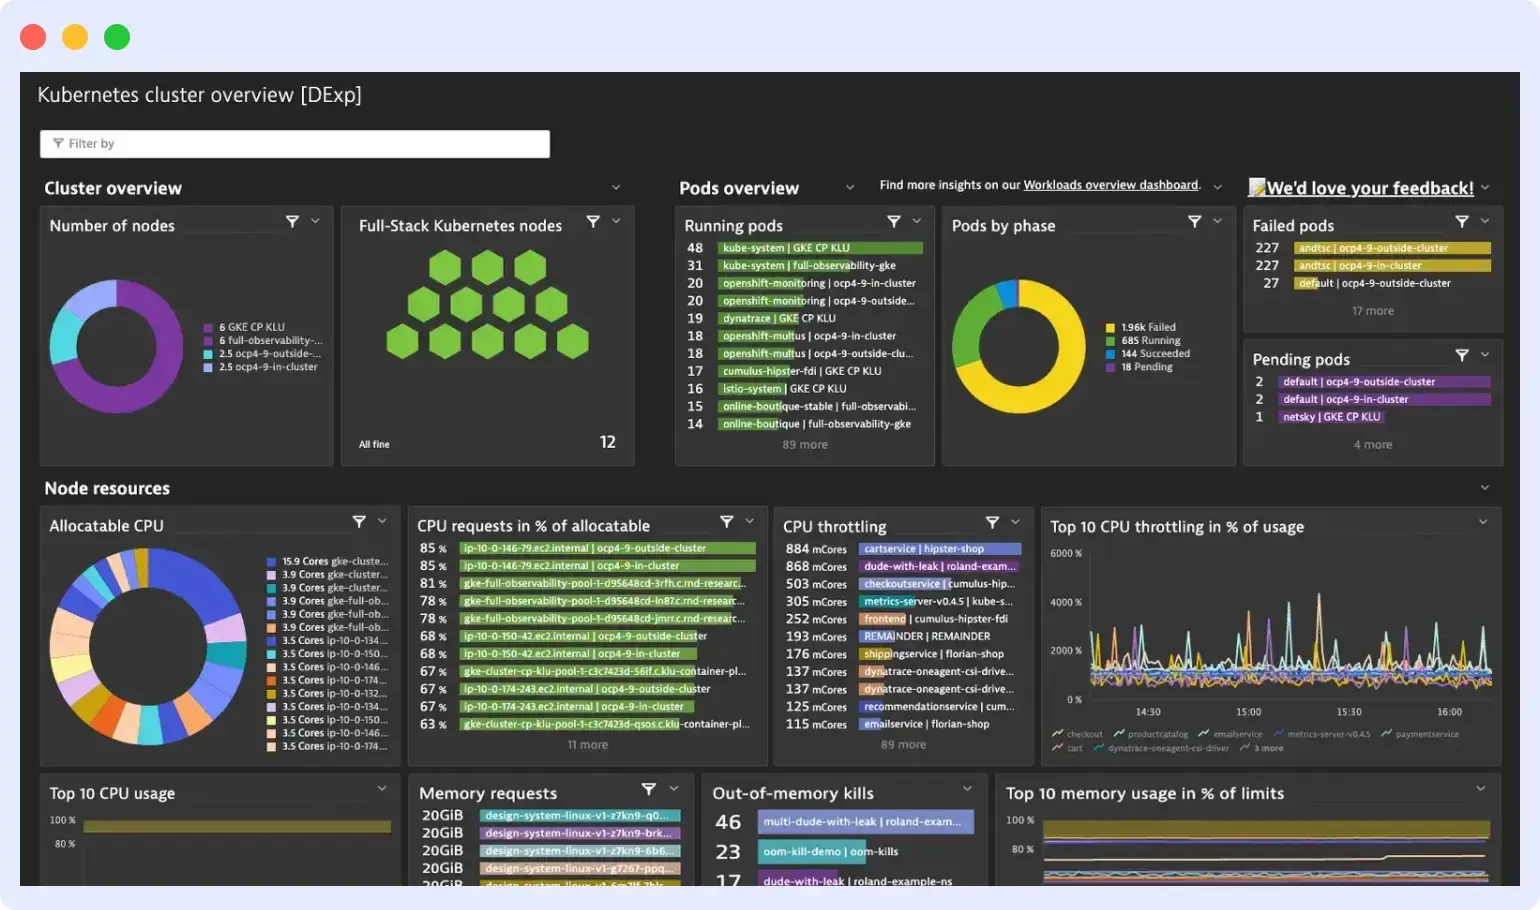
Dynatrace is an enterprise full-stack observability platform with AI-driven root cause analysis (Davis AI) and automatic instrumentation through its OneAgent. Large enterprises pick Dynatrace for zero-touch instrumentation and automated dependency mapping across hybrid and multi-cloud environments, an area Dash0 doesn’t target.
Why it’s a Dash0 alternative
- OneAgent automatically discovers and maps dependencies across hosts, containers, services, and processes without manual instrumentation, unlike Dash0’s collector-based OTel setup.
- Davis AI runs root cause analysis automatically in the background by default, a longer production track record than Dash0’s equivalent Agent0 Automations feature.
- Dynatrace covers APM, infrastructure, logs, RUM, synthetics, and application security under one platform.
Pricing
Dynatrace uses consumption-based pricing with no permanent free tier. Full-Stack Monitoring costs $0.08 per hour for an 8 GiB host (about $58 per month per host). Logs cost $0.20 per GB ingested plus $0.02 per GB-day retained. Real user monitoring is $0.00225 per session, and synthetics are $0.001 per request. There’s a 15-day free trial with full platform access, though Dynatrace also requires a quote-based annual minimum spend commitment.
Limitations
Dynatrace bills hosts by memory at a 4 GiB minimum floor per host, so small hosts with less RAM still get billed at that rate, which makes bills harder to predict than Dash0’s per-signal model in environments with many small hosts.
Verdict
Dash0 vs Dynatrace is really a question of scale and automation appetite. Pick Dynatrace if you’re a large enterprise that needs AI-driven automation, full-stack coverage, and have the budget for an annual contract. Skip if you’re a small or mid-sized team that picked Dash0 specifically to avoid enterprise-scale pricing.
5. Grafana Cloud
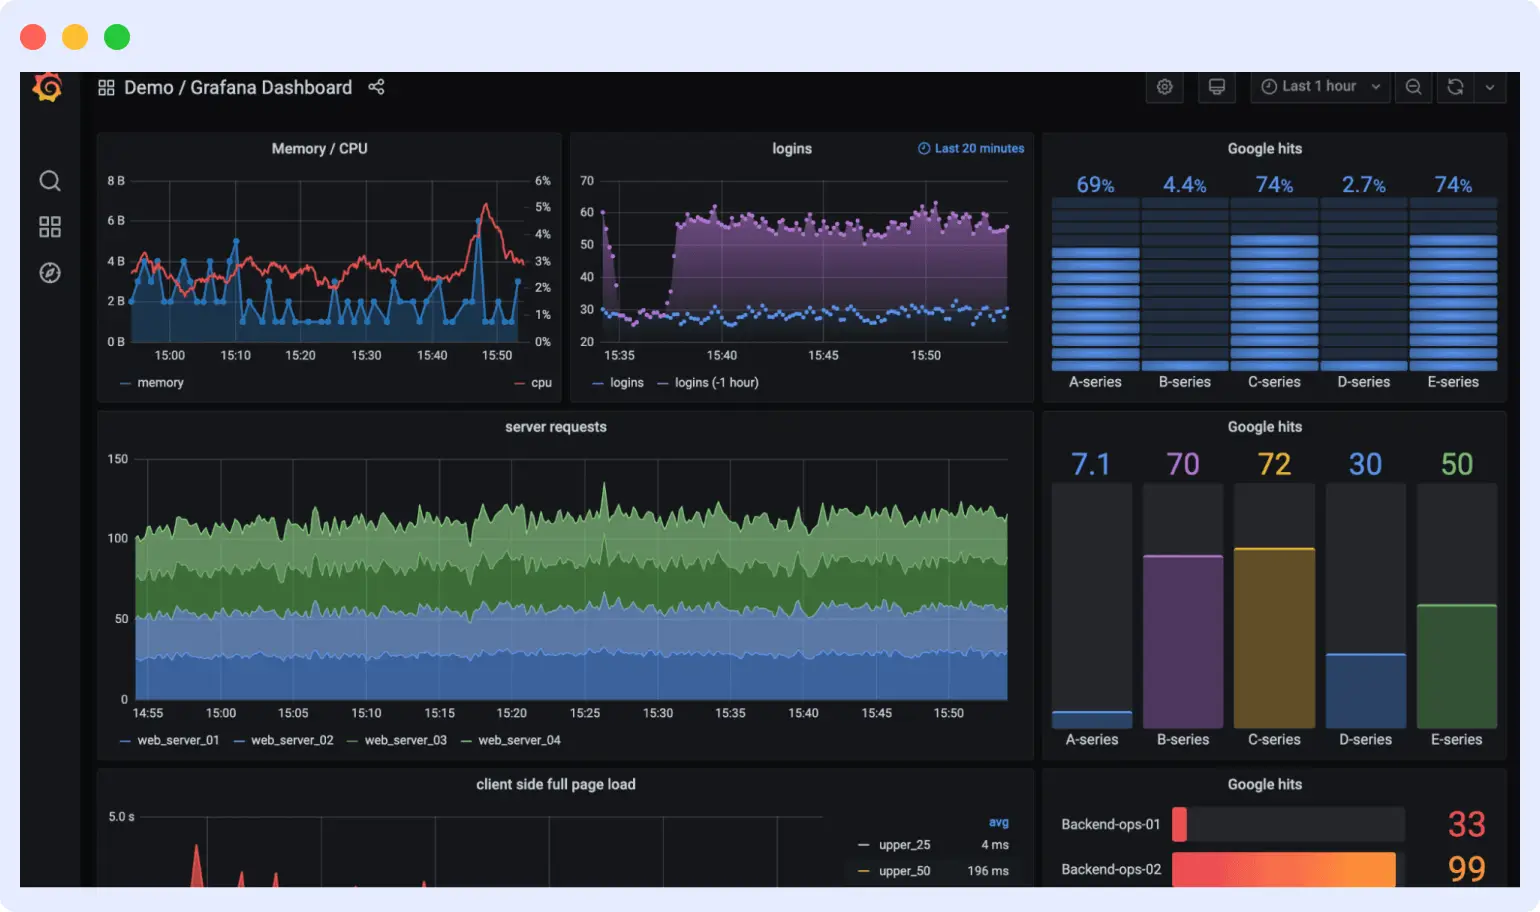
Grafana Cloud is a managed observability platform built on the open-source LGTM stack (Loki for logs, Grafana for visualization, Tempo for traces, Mimir for metrics). Teams already running Prometheus or other open-source tools choose Grafana Cloud when they want a managed backend without the upkeep.
Why it’s a Dash0 alternative
- Grafana Cloud’s free tier is generous enough to cover most small teams running real production workloads, which makes it a low-risk way to leave Dash0’s paid signal-based pricing.
- Grafana Cloud ingests OTel data through OTLP, so existing Dash0 instrumentation works as-is once you update the export target.
- Grafana OSS is free and self-hostable, giving teams a self-hosting option Dash0’s SaaS-only model doesn’t have.
Pricing
Grafana Cloud has a free tier with 10K metric series, 50GB logs, 50GB traces, and 3 users with 14-day retention. The Pro plan starts at $19 per month and adds usage-based billing: $6.50 per 1,000 metric series, $0.50 per GB for logs, and $0.50 per GB for traces. The Advanced plan starts at a $25,000 annual commit.
Limitations
Grafana Cloud uses three different query languages (PromQL for metrics, LogQL for logs, TraceQL for traces), a steeper learning curve than Dash0’s more unified query experience. There’s also no native APM auto-instrumentation; you have to instrument your code with OpenTelemetry yourself.
Verdict
If your team already uses Prometheus, the Dash0 vs Grafana Cloud decision is mostly made. Pick Grafana Cloud if your team is comfortable with PromQL and wants the same open-source LGTM stack as a managed service, with a self-hosting fallback. Skip if you want a single query language or need APM auto-instrumentation out of the box.
6. Better Stack
Better Stack combines logs, metrics, traces, error tracking, RUM, uptime monitoring, an AI SRE agent, on-call scheduling, and status pages on one platform. It’s the closest match to what Dash0 is missing today.
Why it’s a Dash0 alternative
- Dash0 gives you observability and Agent0’s specialized agents, now generally available, but still leaves incident management to other tools. Better Stack gives you observability, a single AI SRE agent, and the full incident lifecycle in one platform, no separate PagerDuty subscription or status page tool required.
- Better Stack’s AI SRE draws from eBPF-based service maps, OpenTelemetry traces, logs, metrics, errors, and web events, and it generates pull requests for new errors in GitHub, the same capability Agent0 added at general availability.
- Better Stack uses eBPF-based zero-code instrumentation on top of OTel support, so Dash0-instrumented services migrate by updating the export target.
Pricing
Better Stack’s free tier includes 10 monitors, 3GB of logs with 3-day retention, and 30GB of metrics. Paid plans with on-call start at $29 per responder per month. Telemetry bundles for logs, metrics, and traces start separately at $25 per month for 40GB of each signal type, scaling up to $420 per month for 700GB of each. A 60-day money-back guarantee applies to all plans.
Limitations
Better Stack’s AI SRE works best with its own native telemetry rather than relying solely on third-party tool integrations, so teams with a heavily third-party stack may see less value than a Dash0-native OTel setup offers.
Verdict
Dash0 vs Better Stack is a question of scope: do you want observability and an AI agent alone, or observability, AI SRE, and incident response in one bill? Pick Better Stack if you’re tired of Dash0 plus a separate PagerDuty or status page tool. Skip if you need Dash0’s specific multi-agent model for tasks like PromQL generation.
7. Honeycomb
Honeycomb is an observability platform built for high-cardinality event data, with native OpenTelemetry support and a query engine designed for fast queries on wide events. Teams debugging complex distributed systems pick Honeycomb when the questions they need to ask weren’t planned in advance.
Why it’s a Dash0 alternative
- The query engine groups and filters high-cardinality fields like user ID or request ID without slowing down, a workload Dash0’s newer query layer is still maturing into.
- Honeycomb takes OTel data through OTLP, so migrating from Dash0 means changing the destination, not the instrumentation.
- BubbleUp automatically surfaces which dimensions of an event correlate with anomalies, cutting time spent guessing during incident investigation, similar in spirit to what Dash0’s Threadweaver agent aims for but with a longer production track record.
Pricing
Honeycomb offers a free tier with up to 20 million events per month and 60-day retention. The Pro plan starts at $130 per month for 100 million events, scaling up to 1.5 billion events with 500 million time series data points included. Enterprise pricing starts at 10 billion events per year with custom terms.
Limitations
Infrastructure monitoring isn’t Honeycomb’s strength, so teams running heavy infrastructure workloads often pair it with a separate tool. Its integration ecosystem is also smaller than Datadog or New Relic.
Verdict
What you’re optimizing for shapes the Dash0 vs Honeycomb choice. Pick Honeycomb if your main pain is slow queries on high-cardinality trace data and you want a more mature query engine than Dash0’s. Skip if you need broad infrastructure monitoring or built-in incident management under one platform.
8. IBM Instana
IBM Instana is an enterprise observability platform with automatic discovery, zero-touch instrumentation, and AI-driven root cause analysis across 300+ supported technologies. Enterprises running complex Kubernetes and microservices environments pick Instana for its automation depth.
Why it’s a Dash0 alternative
- Zero-config instrumentation automatically discovers and maps services, containers, and hosts, which removes the collector setup work Dash0’s OTel-native model still requires.
- Instana ingests OpenTelemetry data alongside its own automatic agents, so teams keep OTel investments while gaining broader auto-instrumentation coverage.
- GenAI observability automatically maps LLM and AI agent workflows, correlating prompt data, token consumption, latency, and errors, a capability Dash0 doesn’t currently offer.
Pricing
Instana prices per Managed Virtual Server (MVS), a licensing unit covering physical machines, virtual servers, or worker nodes, with a 10-host minimum. SaaS pricing starts at $21.20 per host per month for the Essentials tier and $79.50 per host per month for the Standard tier; self-hosted runs about $120 per host per month. A 14-day free trial is available, but there’s no permanent free plan.
Limitations
Instana’s per-host MVS pricing can get expensive quickly at Kubernetes scale, since host counts grow fast in containerized environments, the opposite of the flat, predictable per-signal model that draws teams to Dash0 in the first place.
Verdict
Dash0 vs Instana comes down to whether you want to keep managing OTel collectors yourself or hand instrumentation over to automatic discovery. Pick Instana if your team runs a complex, host-heavy Kubernetes environment and values zero-touch setup over per-signal pricing. Skip if Dash0’s cost predictability at scale is what you value most.
9. Chronosphere
Chronosphere is an observability platform built for cost and cardinality control at scale, giving customers a control plane to decide how much metrics and trace data to retain instead of paying for everything collected.
Why it’s a Dash0 alternative
- The control plane lets you aggregate, roll up, and set retention by environment, so you’re billed on data you actually keep rather than everything ingested, a different cost lever than Dash0’s per-signal pricing.
- Chronosphere ingests metrics and trace data in open source formats, including OpenTelemetry and Prometheus, so Dash0 instrumentation can point at a new destination without re-instrumenting.
- Purpose-built for high-cardinality Kubernetes and microservices environments where uncontrolled data growth becomes the main cost driver, a scale problem Dash0’s newer platform hasn’t been stress-tested against as long.
Pricing
Chronosphere doesn’t publish pricing. It charges based on data throughput and retained volume rather than hosts or seats, and works with each customer to set a capacity ceiling so bills don’t spike unexpectedly. There’s no self-serve free tier, though pilots are typically free for standard-scale evaluations.
Limitations
Pricing requires a sales conversation, and there’s no free tier or self-serve trial the way Dash0 offers, so evaluating Chronosphere takes more upfront commitment.
Verdict
Dash0 vs Chronosphere is a fit question for teams whose main problem is uncontrolled data growth rather than OTel-native simplicity. Pick Chronosphere if cardinality and retention costs are what’s pushing your bill up. Skip if you want self-serve signup and transparent published pricing, which is exactly what Dash0 offers today.
10. SigNoz
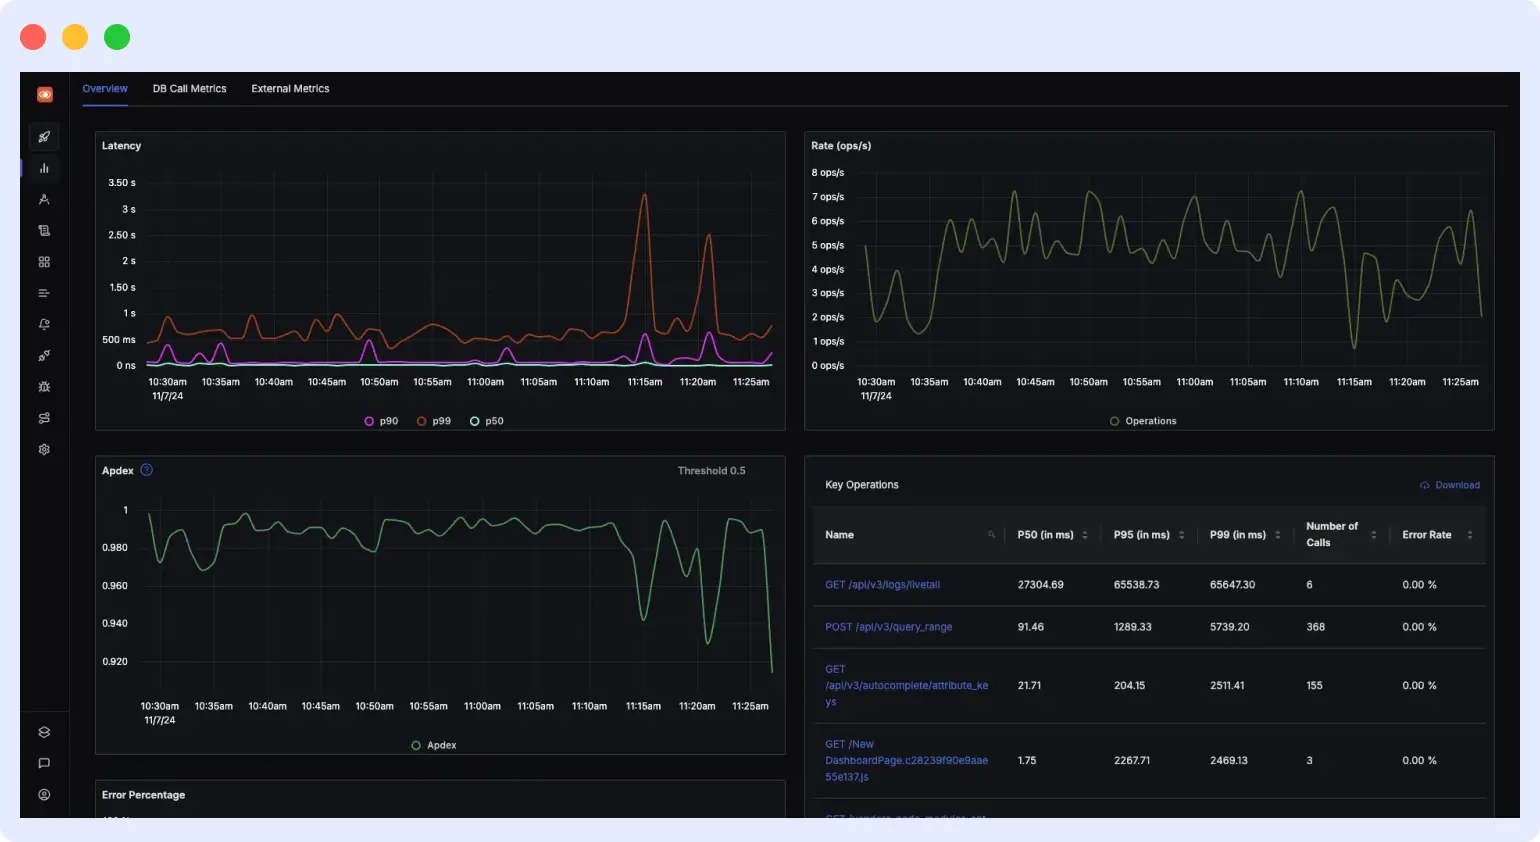
SigNoz is an open-source, OpenTelemetry-native observability platform that stores logs, metrics, and traces in ClickHouse. It’s available as a managed service or fully self-hosted.
Why it’s a Dash0 alternative
- Self-hosting is a first-class option, which fills the gap for teams that picked Dash0 for OTel-native ingestion but want to keep telemetry infrastructure in-house rather than SaaS-only.
- SigNoz is OTel-native end to end, so Dash0 instrumentation moves over with an endpoint change.
- The open-source core means no vendor lock-in and full visibility into how data is stored and queried, an option Dash0’s closed SaaS platform doesn’t provide.
Pricing
SigNoz Community Edition is free to self-host, though you absorb the infrastructure cost of running ClickHouse. SigNoz Cloud charges $0.30 per GB with a free trial available.
Limitations
Self-hosting SigNoz means owning ClickHouse operations, the same kind of infrastructure overhead Dash0’s managed SaaS model was built to avoid. The community edition also caps dashboard panels and alert rules more tightly than Dash0’s paid tiers.
Verdict
Dash0 vs SigNoz comes down to whether you want to manage infrastructure yourself in exchange for zero licensing cost and no vendor lock-in. Pick SigNoz if self-hosting and open source matter more to you than Dash0’s managed, predictable-pricing convenience. Skip if you’d rather not run ClickHouse.
How to choose a Dash0 alternative
If deployment flexibility or incident response is the problem, pick Middleware or Better Stack. Dash0’s Agent0 also generates pull requests now that it’s generally available, so the gap is elsewhere: Middleware adds BYOC for teams that need telemetry to stay in their own cloud; Better Stack adds full incident management on top.
If missing incident response is the problem, pick Better Stack. It’s the only platform here that folds on-call scheduling, status pages, and escalation workflows into the same product as observability and AI-powered root cause analysis, closing the exact gap Dash0 leaves open.
If you need features Dash0 doesn’t have yet, pick Datadog or New Relic. Both cover session replay, native mobile monitoring, and security monitoring. Datadog has more integrations than New Relic (1000+ vs. 780+), while New Relic avoids per-host pricing. Pick Datadog if your team needs those extra features today. Pick New Relic if you mostly need APM plus full-stack visibility.
If cardinality and cost control at scale is the problem, pick Chronosphere or Honeycomb. Chronosphere’s control plane lets you decide what to retain instead of paying for everything ingested. Honeycomb was built for fast queries on high-cardinality wide events, which is useful once trace volume outgrows what a newer query engine handles comfortably.
If you want a self-hosting path Dash0 doesn’t offer, pick Middleware, Grafana Cloud, or SigNoz. Middleware and Grafana Cloud both support running your own infrastructure alongside a managed option. SigNoz is fully open source if you want zero licensing cost and are comfortable running ClickHouse yourself.
Before committing, run a one-to-two week trial with your real production data, not synthetic samples. Watch for two signals: how the bill projects at your actual ingest volume after any trial discount ends, and whether the platform’s AI features actually fit your workflow, since most vendors compared here, including Dash0, now ship a generally available AI agent that can draft fixes.
FAQs
What is the best alternative to Dash0?
The best alternative depends on the Dash0 limitation you want to fix. Middleware and Better Stack fit teams that want deployment flexibility or built-in incident response that Dash0 doesn’t offer. Datadog and New Relic fit teams that need session replay, native mobile monitoring, and broader integrations. Chronosphere and Honeycomb fit teams hitting cardinality and cost-control limits at scale.
Is Dash0 better than Datadog?
Dash0 is better for OpenTelemetry-native ingestion, predictable signal-based pricing, and simplicity for teams standardized on OTel. Datadog is better for mature, ready-to-use features like session replay, native mobile monitoring, security monitoring, and 1000+ integrations.
Why do teams move away from Dash0?
Teams leave Dash0 for three main reasons: there’s no built-in incident management, on-call scheduling, or status pages, so teams pair it with a second tool for the full incident lifecycle; Dash0 is SaaS only with no self-hosting or BYOC option; and its multi-agent AI model asks users to know which specialized agent handles which task, versus a single contextual agent in some alternatives.
Which Dash0 alternatives support OpenTelemetry natively?
Middleware, New Relic, Grafana Cloud, Better Stack, Honeycomb, Chronosphere, and SigNoz are OpenTelemetry observability tools with native OTLP support. Datadog, Dynatrace, and IBM Instana accept OpenTelemetry data but route it alongside their own native agents.
Is there a free Dash0 alternative?
Yes. Middleware offers a Free Forever plan with monthly usage limits, including up to 100GB of data, 1,000 RUM sessions, 20,000 synthetic checks, 10 browser test runs, and 2 million OpsAI tokens. New users first receive a 14-day free trial with unlimited data ingestion, RUM, and synthetic checks. Grafana Cloud offers 10K metric series, 50GB logs, and 50GB traces free. New Relic offers 100GB of free ingest plus one full platform user. Honeycomb offers 20M events per month, and SigNoz Community Edition is free to self-host.
Is there a free open-source alternative to Dash0?
SigNoz is the closest open-source, OpenTelemetry-native equivalent, with a self-hosted Community Edition built on ClickHouse. Grafana OSS (Loki + Tempo + Mimir) is another self-hosted option if your team is comfortable with PromQL, LogQL, and TraceQL.
How does Dash0 pricing compare to alternatives?
Dash0 charges per signal: $0.20 per million metric data points, $0.60 per million spans, log records, or web events, and $0.20 per thousand synthetic check runs, with no per-host or per-seat fees. Middleware charges $0.30 per GB but bundles RUM, synthetics, and a production AI SRE agent into the same pricing. SigNoz Cloud matches Middleware at $0.30 per GB. Datadog and Dynatrace charge per host plus separate fees for logs, RUM, and synthetics, which tends to be less predictable than Dash0’s or Middleware’s flat models.
How do I migrate from Dash0 to another platform?
If you’re moving to an OTel-native platform like Middleware, Grafana Cloud, Honeycomb, or SigNoz, update the OTLP endpoint and API key in your collector config; no re-instrumentation needed. Historical data stays in Dash0 for the duration of your retention window. Run both platforms in parallel for 48 hours to confirm data parity before cutting over.

