
Summary: Slow applications cost real money, research consistently shows that even a one-second delay in page load can reduce conversions by 7%. Synthetic monitoring solves this by continuously simulating user journeys across your apps, APIs, and endpoints, catching performance problems before any real user encounters them. It is the foundation of a proactive observability strategy for engineering and DevOps teams.
TL;DR
- Synthetic monitoring uses scripted, simulated user interactions to test performance, no real users required.
- It runs 24/7 from multiple global locations, catching issues that only appear in specific regions or under certain conditions.
- Unlike Real User Monitoring (RUM), which is reactive, synthetic monitoring is proactive — it alerts you before users complain.
- Core use cases: API health checks, uptime testing, multi-step transaction validation, and SLA enforcement.
- Best results come from combining synthetic monitoring with RUM, APM, and infrastructure monitoring in a unified observability stack.
What is synthetic monitoring?
Synthetic monitoring is a proactive testing technique that simulates user interactions with a website, API, or application using scripted transactions independent of real user traffic. Tests are run on a scheduled basis across multiple geographic locations, measuring performance metrics such as response time, availability, and error rate.
Unlike passive monitoring methods that wait for problems to surface in production, synthetic monitoring actively probes your system around the clock. If your checkout API starts returning 500 errors at 3 AM, a synthetic monitor catches it and alerts your on-call team — before your first customer does.
It is a core component of a mature observability strategy, sitting alongside APM, log monitoring, and infrastructure monitoring.
How does synthetic monitoring work?
At its core, synthetic monitoring works by executing pre-written scripts that mimic specific user actions, visiting a URL, submitting a login form, calling an API endpoint, or completing a multi-step purchase flow.
Here is a simplified end-to-end flow:
- Script creation: Engineers write scripts representing critical user journeys (e.g., “user logs in → searches for a product → adds to cart → checks out”).
- Scheduled execution: The monitoring platform runs these scripts at defined intervals (every 1 minute, 5 minutes, etc.) from multiple global nodes.
- Metric collection: Each test captures response time, HTTP status codes, SSL certificate validity, DNS resolution time, and more.
- Threshold evaluation: Results are compared against predefined SLAs and performance baselines.
- Alerting: When a test fails or a metric degrades beyond a threshold, alerts are sent via PagerDuty, Slack, email, or other channels.
- Root cause analysis: Detailed waterfall charts and network timing breakdowns help engineers pinpoint exactly where the failure occurred.
Types of synthetic monitoring
There are several different types of synthetic monitoring, each designed to focus on specific service areas. Let’s explore some commonly used types of synthetic monitoring:
Browser-based monitoring
Browser-based monitoring uses a headless browser to replay real user journeys clicking buttons, filling forms, navigating between pages and captures screenshots and performance timelines at each step.
It is particularly useful for verifying that frontend frameworks render correctly across browsers and operating systems, and that third-party scripts (chat widgets, payment SDKs) do not degrade page load time.
Best for: E-commerce checkout flows, login/authentication paths, single-page application rendering.
API and endpoint monitoring
API monitoring tests HTTP endpoints directly verifying status codes, response body content, latency, and schema integrity. Since APIs power nearly every modern application, this is often the highest-value synthetic check you can run.
Middleware synthetic monitoring covers API testing across HTTP, SSL, DNS, TCP, WebSocket, UDP, ICMP, and gRPC layers giving you a complete view of API health across your entire network stack.
If you’re evaluating dedicated API monitoring platforms alongside synthetic testing, see our breakdown of the best API monitoring tools in 2026.
Best for: REST and GraphQL APIs, payment gateways, third-party integrations, and microservice health checks.
Network-level monitoring
Network monitoring tests DNS resolution times, TCP connection latency, packet loss, and routing performance from different geographic nodes. It helps identify region-specific performance degradation that may not be visible from your own data center.
Best for: CDN validation, multi-region latency comparison, ISP-level connectivity checks.
Mobile application monitoring
Mobile monitoring simulates user interactions on mobile devices across different OS versions and screen sizes. It detects crashes, slow load times, and rendering failures that only appear on specific device configurations.
Best for: Native iOS/Android apps, mobile web applications, teams with significant mobile user traffic.
Why is synthetic monitoring important?
Modern applications are distributed, API-heavy, and expected to be always-on. Reactive monitoring, waiting for users to report a problem, simply does not scale. Synthetic monitoring gives engineering teams the ability to:
Support A/B testing: Measure the performance impact of feature flags and infrastructure changes against a consistent baseline.
Catch regressions before deployment: Run synthetic checks in pre-production to validate that new releases do not break critical user paths.
Enforce SLAs with data: Prove uptime and performance commitments to customers with objective, continuous test data.
Test geography-specific performance: A page that loads in 600ms in Mumbai may take 4 seconds in São Paulo. Synthetic tests from distributed nodes expose these discrepancies.
Validate third-party dependencies: You cannot control your payment provider’s uptime, but you can monitor it and alert on degradation before your revenue is affected.
Synthetic monitoring vs. real user monitoring (RUM): what is the difference?
Real User Monitoring (RUM) captures performance data from actual user sessions in real time. Synthetic monitoring uses scripted bots to simulate those sessions on a schedule. They are complementary, not competing.
| Real User Monitoring (RUM) | Synthetic Monitoring | |
|---|---|---|
| Data source | Actual user sessions | Scripted simulations |
| Approach | Reactive — captures what happened | Proactive — tests before it happens |
| Coverage | Dependent on user traffic volume | Consistent, scheduled, 24/7 |
| Geographic reach | Where your users actually are | Any location, including low-traffic regions |
| Pre-production testing | Not possible | Yes — test before launch |
| Traffic dependency | Requires real traffic | Works with zero traffic |
| Weakness | Misses off-peak and low-traffic failures | Cannot detect issues tied to real user variability |
Best practice: Use both. Synthetic monitoring fills coverage gaps (nights, weekends, low-traffic regions, pre-production). RUM provides the ground truth of actual user experience. Together, they give you complete observability. See our in-depth RUM vs. synthetic monitoring comparison →
Key benefits of synthetic monitoring
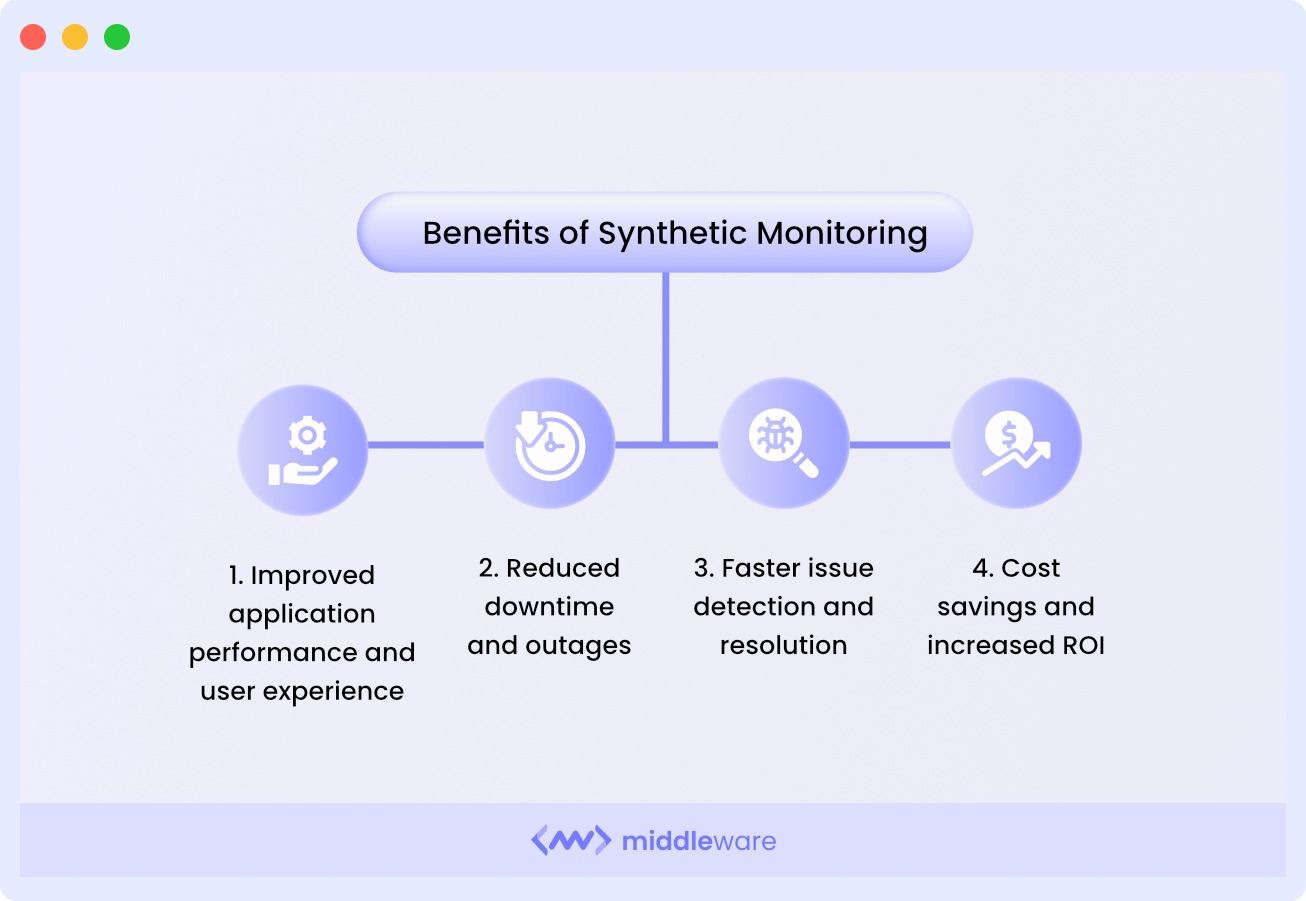
Faster mean time to detect (MTTD)
Because synthetic checks run continuously, failures surface within minutes rather than after users have been impacted for hours. Faster detection directly reduces mean time to resolution (MTTR) and limits the blast radius of incidents.
Reduced downtime and outage cost
Middleware’s synthetic monitoring provides detailed network timing breakdowns and response-time data segmented by location, giving on-call engineers immediate context for root cause analysis. Less time diagnosing means less time down.
Pre-production validation
Synthetic tests run identically in staging and production environments. This makes them invaluable for validating releases, infrastructure changes, and configuration updates before they reach end users, reducing the risk of regressions shipped to production.
SLA and compliance enforcement
Objective, timestamped synthetic test data gives you auditable proof of uptime and performance against contractual SLAs. For regulated industries, this data also supports compliance reporting requirements.
Baseline and trend visibility
Running the same synthetic tests over time builds a performance baseline. When response times drift upward gradually a common sign of database bloat or memory leaks synthetic trends will surface it before it becomes a user-visible problem.
Challenges in synthetic monitoring (and how to address them)
Implementing synthetic monitoring within an organization presents multifaceted challenges, spanning both technical and organizational realms.
Flaky tests and false positives
Headless browser tests occasionally fail due to timing issues, network jitter, or test environment inconsistencies, not actual application problems. This creates alert fatigue.
Solution: Implement retry logic (e.g., re-run a failed test 2–3 times before alerting), use assertion-based validations instead of simple status-code checks, and regularly audit your test suite to remove unstable scripts.
Integration complexity
Adding synthetic monitoring to an existing CI/CD pipeline, especially with a “monitoring as code” philosophy, requires clear ownership and tooling decisions that cut across dev and ops teams.
Solution: Define monitoring ownership in your team charter. Treat synthetic test scripts as first-class code artifacts: version-controlled, reviewed, and deployed alongside application code.
Simulated vs. real behavior gaps
Scripts cannot replicate every edge case of real user behavior. A user with a slow 3G connection in a rural area behaves very differently from your scripted test running on a cloud node.
Solution: Pair synthetic monitoring with RUM data. Platforms like Middleware merge both data streams, letting you cross-reference simulated test results with actual user session data for statistically sound analysis.
Shared ownership across DevOps teams
In traditional organizations, monitoring lived with ops. In modern DevOps, the team that ships a feature owns its observability, including synthetic tests.
Solution: Establish a shared monitoring repository, standardized alerting templates, and cross-team SLAs for test coverage before features go to production.
Synthetic monitoring best practices
To implement synthetic monitoring effectively, businesses need to adopt best practices that can help them achieve their goals efficiently.
1. Start with your most critical user journeys
Do not try to monitor everything at once. Identify the 5–10 user journeys that, if broken, would have the highest business impact: checkout, login, core API calls. Build synthetic tests for those first.
2. Set monitoring frequency based on criticality
A payment API might warrant a 1-minute check interval. A marketing landing page might be fine in 15 minutes. Matching frequency to business criticality reduces noise and unnecessary load on your monitoring infrastructure.
3. Test from multiple geographic locations
Performance problems are often location-specific a CDN misconfiguration or a latent regional cloud endpoint. Always run tests from at least 3–5 geographically distributed nodes.
4. Use meaningful assertions, not just status codes
A 200 OK response does not mean your app is working correctly. Assert on response body content, header values, JSON schema validity, and response time thresholds. A page that loads in 8 seconds with a 200 status is still a broken user experience.
5. Build failure scenarios into your test suite
Include tests that simulate partial failures: a slow downstream API, a missing product image and an expired SSL certificate. Knowing how your application degrades under these conditions is as valuable as knowing it works under ideal conditions.
6. Integrate alerts into your incident workflow
Synthetic alerts should feed directly into your incident management system, PagerDuty, OpsGenie, Slack, with enough context (failing test, location, response payload) for the on-call engineer to act immediately without investigating first.
7. Review and update tests on every release
A test that still checks an API path you deprecated six months ago is pure noise. Make a synthetic test review part of your definition of done for every sprint or release cycle.
Which synthetic monitoring tool should you use?
Choosing the right tool depends on your stack, team size, and how deeply you need synthetic monitoring to integrate with APM, logs, and alerting. We’ve done a full head-to-head comparison of the top 10 platforms with verified pricing, honest pros and cons, and a clear verdict for each.
→ See the full guide: 10 best synthetic monitoring tools in 2026
Why teams choose Middleware for synthetic monitoring
Middleware’s synthetic monitoring is purpose-built for complex, multi-tiered applications. Unlike tools that treat synthetic monitoring as a bolt-on feature, Middleware correlates every test result directly with APM traces, infrastructure metrics, and log data, so when a check fails, the full investigation context is already in the same view.
Key capabilities that set it apart:
- Deepest network-layer coverage: Monitor APIs across HTTP, SSL, DNS, TCP, WebSocket, UDP, ICMP, and gRPC all from a single platform.
- Location-segmented timing breakdowns: See response time and network timing data broken down by geography, so region-specific degradation is immediately visible.
- Unified observability: Synthetic monitoring, RUM, APM, log monitoring, and infrastructure monitoring in one platform, with no context-switching between tools during an incident.
- OpsAI auto-remediation: When a synthetic test fires an alert, OpsAI automatically correlates it with related signals, identifies the probable root cause, and executes remediation runbooks for known failure types reducing mean time to resolution without manual triage.
- Meaningful assertions: Go beyond status codes assert on response body content, JSON schema, header values, and latency thresholds with a detailed time graph for each test step.
→ Start using Middleware’s synthetic monitoring
How to choose the right synthetic monitoring approach
The right tool and configuration depend on your specific context. Use this checklist:
What is your existing observability stack? Consolidating synthetic monitoring into your existing APM and log platform reduces context-switching and accelerates root cause analysis.
What are you monitoring? Web apps → browser-based; APIs and microservices → API/endpoint monitoring; mobile-first products → mobile monitoring.
What is the blast radius of downtime? Revenue-critical flows deserve 1-minute check intervals and multi-channel alerting. Internal tools can tolerate 15-minute intervals.
Who are your users and where are they? If 40% of your traffic is in Southeast Asia, you need monitoring nodes there not just in US-East.
Do you need pre-production testing? If yes, choose a platform that supports private or internal monitoring locations.
Do you want auto-remediation? Platforms with AI-powered agents, such as Middleware’s OpsAI, can automatically resolve common failure types, reducing on-call burden.
How OpsAI takes synthetic monitoring further
Synthetic monitoring tells you when something is broken and where in the stack the failure originates. But it still requires an engineer to investigate, diagnose, and fix. That is where OpsAI Middleware’s AI SRE agent, generally available, changes the equation.
When a synthetic test fails, OpsAI automatically:
- Correlates the alert with related APM traces, logs, and infrastructure metrics
- Identifies the most probable root cause using pattern recognition across your historical incident data
- Executes pre-approved remediation runbooks for known failure types
- Escalates to on-call with a pre-built incident summary so engineers start at triage, not at detection
In production, OpsAI has demonstrated over 50% auto-resolution of incidents internally, with 70%+ auto-resolution rates across beta customers and an 80%+ reduction in on-call toil. This means your synthetic monitoring investment does not just catch more problems it also fixes more of them automatically.
📌 Start monitoring your critical paths today. Get started with Middleware free →
FAQs
What is the difference between synthetic monitoring and active monitoring?
The terms are often used interchangeably. Active monitoring describes any technique where the monitoring system itself generates test traffic — as opposed to passive monitoring, which only observes existing traffic. Synthetic monitoring is a form of active monitoring that uses scripted, user-like transactions rather than simple ping-style checks.
Can synthetic monitoring replace real user monitoring?
No — and it should not try to. Synthetic monitoring is proactive and consistent, making it ideal for pre-production testing, off-peak coverage, and SLA validation. RUM captures the actual diversity of real user behavior, devices, and network conditions. The two approaches are complementary, and most mature teams use both.
How often should synthetic monitoring tests run?
It depends on business criticality. Revenue-critical APIs and checkout flows typically warrant 1–5 minute intervals. Less critical pages or internal tools can run every 15–30 minutes. A high check frequency increases detection speed but also increases load on your monitoring infrastructure — balance accordingly.
What metrics does synthetic monitoring measure?
The most common metrics include: response time, time to first byte (TTFB), DNS resolution time, TCP connect time, SSL handshake time, HTTP status code, content validation (is the expected response body present?), and availability percentage over a rolling window.
Is synthetic monitoring useful for APIs?
Yes — in fact, API monitoring is one of the highest-value applications of synthetic testing. API failures directly break application functionality, often before any frontend signal appears. Synthetic API checks validate endpoint availability, response correctness, authentication flows, and latency SLAs on a continuous basis.
How does synthetic monitoring support SLA reporting?
Because synthetic tests run on a fixed schedule from known locations, their results are objective and auditable. Monitoring platforms like Middleware aggregate test pass/fail data over time, making it straightforward to calculate uptime percentages, mean response times, and SLA adherence reports for customers or internal stakeholders.


