
Kubernetes infrastructure monitoring tracks node CPU, memory, disk, and network health, as well as control plane and pod status, to surface problems before they affect users. Tools like Middleware provide pre-built dashboards and automated alerts that cut setup time from days to minutes.
TL;DR
- Kubernetes infrastructure monitoring continuously tracks node CPU, memory, disk I/O, network throughput and control plane health,, so teams can catch capacity problems, pod evictions and node failures before they cause user-facing outages.
- Without monitoring, problems only surface as errors. A common real-world example: users see 503 errors, investigation reveals nodes hit 94% memory two hours earlier, enough lead time to fix it, if someone had been watching.
- Key things to monitor include node health, pod status, control plane performance, disk I/O, network throughput and alert thresholds for each.
- This guide walks through a step-by-step Middleware agent setup that gets full Kubernetes visibility live in minutes, with pre-built dashboards and automated alerts, cutting setup time from days to minutes.
- Proactive Kubernetes monitoring means catching issues in metrics before they become incidents. Reactive monitoring means your users find the problem first.
What Is Kubernetes Infrastructure Monitoring?
Kubernetes infrastructure monitoring is the continuous collection and analysis of cluster-level metrics, node CPU, memory, disk I/O, network throughput, and control plane health to detect capacity problems, pod evictions, and node failures before they cause outages.
Without it, problems surface as user-facing errors. A common real-world example: users report 503 errors during peak traffic. Investigation reveals three nodes at 94% memory, triggering the kernel OOM killer and evicting pods. Memory had crossed 80% two hours earlier, enough lead time to add capacity, if anyone had been watching. This is the foundation of proactive infrastructure monitoring catching issues in metrics before they become incidents.
For a broader overview covering the full Kubernetes monitoring stack, including observability concepts, key metrics, and tooling, see the Kubernetes Monitoring: A Complete Guide.
Setting up Middleware for Kubernetes infrastructure monitoring
Before installing the Middleware Kubernetes agent, confirm you have:
- A Kubernetes cluster (1.21+)
- kubectl set up and talking to your cluster
- Helm 3.x
- RBAC permissions to deploy agents
- A Middleware account (free tier available)
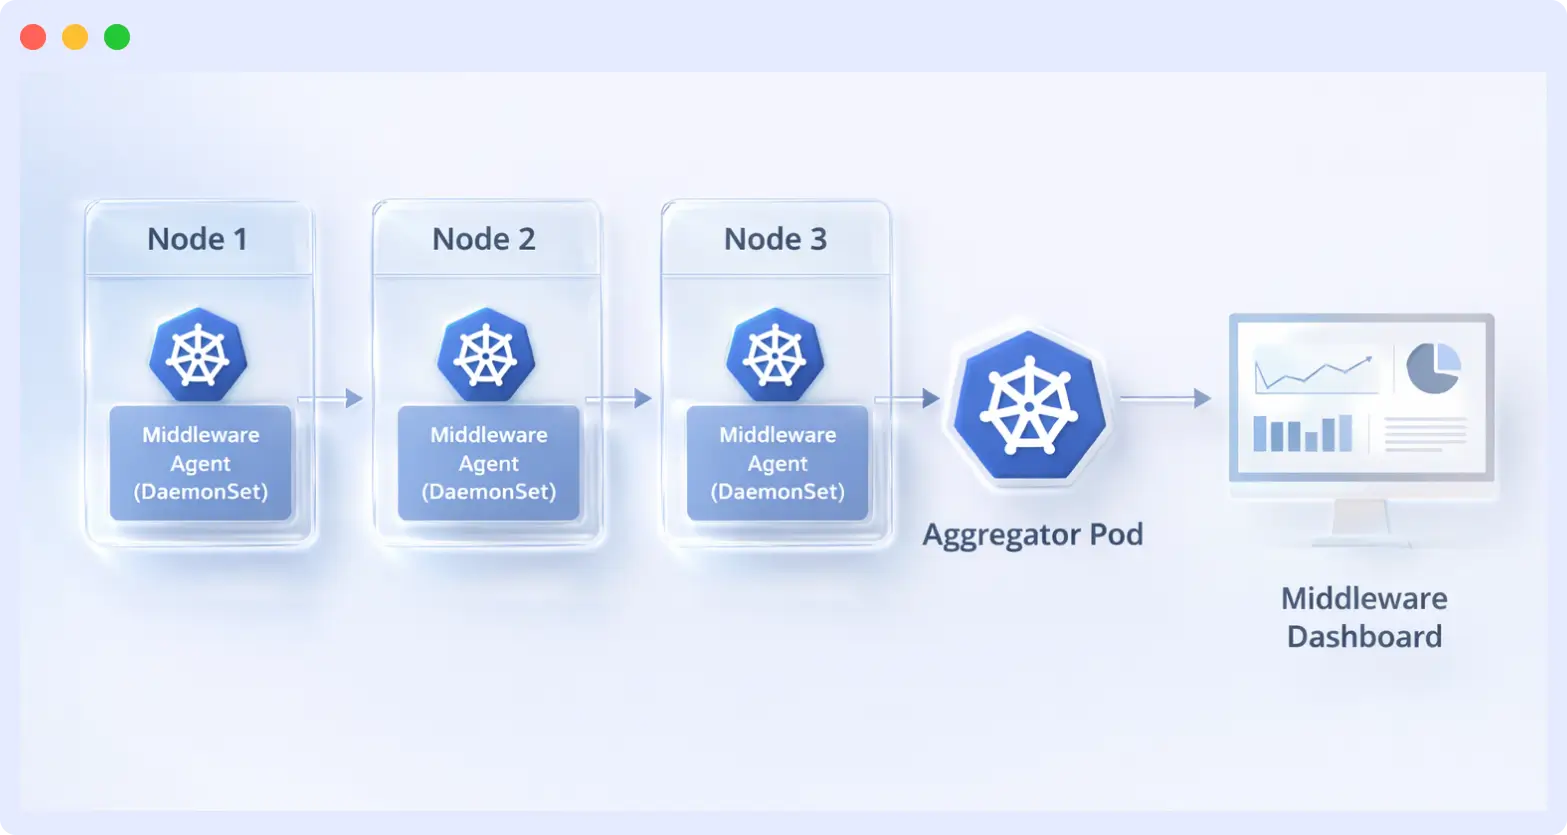
How the Middleware Agent Works
The Middleware agent uses a two-tier architecture:
Aggregator pod — a Deployment that pulls data from all DaemonSet pods and forwards it to Middleware. If it reschedules due to node failure, there will be a short data gap.
DaemonSet — runs one pod per node, collecting CPU, memory, disk, and network metrics. If this pod fails, that node becomes invisible to monitoring.
For critical clusters, set resource requests on the aggregator so it lands on a stable node.
Step 1 — Install the Middleware agent via Helm
Retrieve your API key and target URL from Middleware Settings → API Keys. Your target URL follows this pattern:
https://YOUR_MW_UID.middleware.io:443Run the following commands:
helm repo add middleware-labs https://helm.middleware.io

helm install mw-agent middleware-labs/mw-kube-agent-v3 \
  --namespace mw-agent-ns \
  --create-namespace \
  --set mw.apiKey=YOUR_API_KEY \
  --set mw.target=https://YOUR_MW_UID.middleware.io:443 \
  --set opsai.enabled=true \
  --set clusterMetadata.name=k8s-cluster
Key flags:
clusterMetadata.name— sets how the cluster appears in the dashboard; use a descriptive name when managing multiple clusters.opsai.enabled=true— enables OpsAI, which automatically detects crashes and memory issues and recommends or applies fixes.
Step 2: Verify agent health
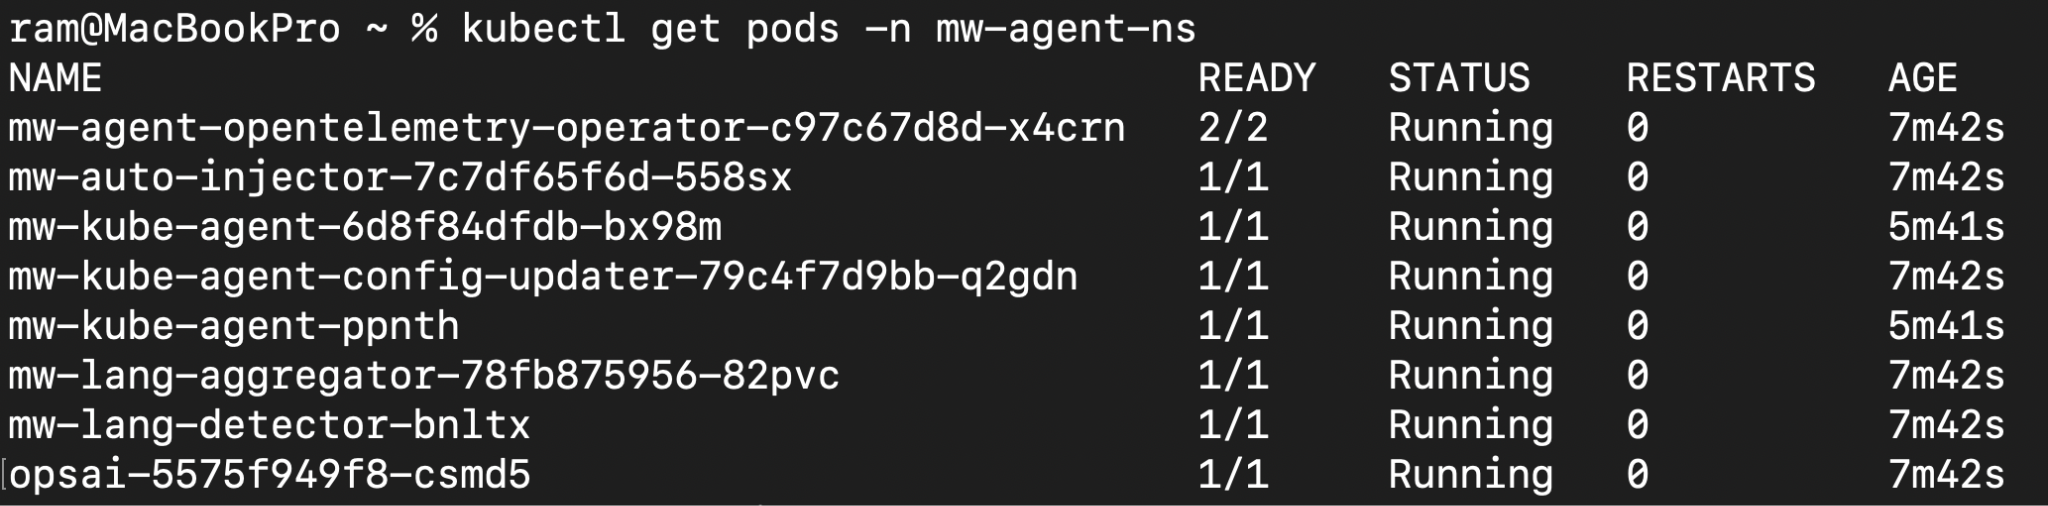
Verify the agent is collecting data. If metrics aren’t appearing in the dashboard after 5 minutes, the agent pods are likely failing. Check agent health:
kubectl get pods -n mw-agent-nsExpected output: DaemonSet pods showing 1/1 In READY, the deployment pod showing 2/2.
| Pod Status | What It Means | Fix |
|---|---|---|
CrashLoopBackOff | Wrong API key or target URL | Re-check credentials |
Pending | RBAC or scheduling issue | Check permissions and node resources |
Running but no metrics | Network policy blocking egress | Allow traffic to Middleware target |
Metrics appear in your Middleware Kubernetes dashboard within 2–5 minutes.
Ready to get cluster-wide visibility in minutes?
Start monitoring Kubernetes free-trial with Middleware →
How to View Kubernetes Metrics During Incidents
To view Kubernetes metrics in your Middleware dashboard, log in to your account, navigate to Infrastructure → Kubernetes, and select your cluster (labeled with your clusterMetadata.name value).
Metrics appear in your Middleware dashboard within 2-5 minutes after installation. Raw metrics don’t mean much without context. Here’s what to look for and what the numbers actually tell you during investigations.
What Does High Node CPU and Memory Usage Mean?
What normal looks like: Production clusters average 40–60% CPU and memory utilization, spiking to 80% during peak hours.
What requires action:
- Sustained usage above 70% across multiple nodes for 10+ minutes signals a scheduling problem — new pods will be placed on nodes without available capacity.
- CPU at 85% with low network throughput points to compute-bound workloads (image processing, data transformation). Adding nodes resolves this; adding memory does not.
- High memory with moderate CPU often indicates an application holding more than it needs — investigate for memory leaks before eviction begins.
Scale vs. optimize decision:
| Situation | Action |
|---|---|
| Multiple nodes high | Add nodes immediately; optimize later |
| Single pod consuming everything | Fix the pod; don’t add capacity |
| Sudden spike after deployment | Roll back first, then investigate |
During active incidents, default to scaling. Capacity is cheaper than downtime.
How to interpret disk I/O patterns in kubernetes
The most important signal is the trend over time, not a single snapshot. Separate write latency from read latency:
- Write latency climbing, read latency flat → disk I/O path issue, not network or application layer.
- Sudden IOPS drop during heavy writes (database backups, batch jobs) → volume throttling. Check whether the workload is on burstable storage.
Real example PostgreSQL write latency: Write latency rose from 12ms to 38ms over 72 hours. Read latency held at 4ms throughout with no application errors. Root cause: an EBS volume with burstable IOPS ran out of burst credits during nightly batch jobs. Fix: migrated to provisioned IOPS. Latency returned to 10ms and stayed stable.
Key rule: Burstable storage is fine for irregular workloads. For consistent write patterns, it will eventually hit the ceiling.
When to check network throughput metrics
Check network throughput when pods are slow but CPU and memory look normal. Bandwidth saturation (typically 5–10 Gbps depending on instance type) won’t surface elsewhere until timeouts begin.
High egress, low ingress → background operations: backups, exports, sync jobs. Rate-limit large transfers to prevent them from starving application traffic.
How to use pod resource consumption by namespace
Use this view to identify which team or workload is driving a capacity problem:
- Test environments in the same cluster consuming production resources → add namespace-level resource quotas.
- Gradual increase over several days in one namespace → likely a memory leak.
- Sudden spike → bad deployment; investigate before adding capacity.
Kubernetes alert thresholds that work in production
Baseline before alerting: Run the cluster for 3–7 days before setting thresholds. Without baseline data, alerts fire on normal behavior and get ignored.
Critical alerts — set these first
These always require immediate action:
| Alert | Threshold | Why |
|---|---|---|
| Node NotReady | Any | Pods cannot schedule until the node is healthy |
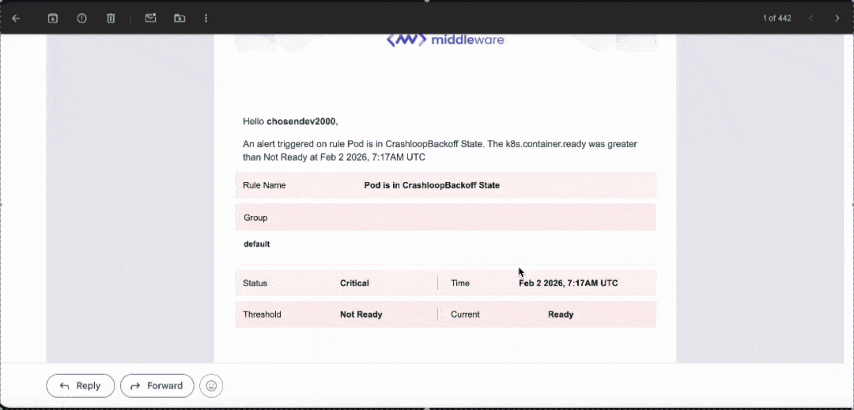
| CrashLoopBackOff | Persisting 5+ minutes | Pod cannot start; cascades to traffic loss |
| Disk usage | Above 85% | Kubernetes eviction begins at 90% — this gives response time |
| Memory usage | Above 90% | Provides 5–10 minutes before OOM killer terminates processes |
Setting memory thresholds higher (e.g., 95%) leaves no time to respond before pod kills begin.
Capacity alerts — add next
| Alert | Threshold | Why |
|---|---|---|
| CPU sustained high | Above 80% for 15 minutes | Filters normal spikes; sustained load requires action |
| Persistent volume usage | Above 80% | Prevents pod failures from volume exhaustion |
Alert priority during multi-alert incidents
When multiple alerts fire simultaneously, fix in this order:
- Node NotReady — pods can’t schedule anywhere until fixed
- Disk pressure (>85%) — evictions will cascade and worsen all other issues
- CrashLoopBackOff — investigate after infrastructure stabilizes; often self-resolves once nodes recover
- High CPU/Memory — performance problems don’t cascade like infrastructure failures
Fix infrastructure before optimizing workloads.
Setting Up Alerts in Middleware
Navigate to the bell icon → Add New Rule:
- Select Metrics for CPU/Memory alerts or Host for node-level alerts
- Configure the metric, threshold, and notification channel (email, Slack, PagerDuty)
- Click Create Alert
For full configuration options, see the Middleware Alerts documentation.
Don’t wait for an outage to set thresholds.
Explore Middleware’s pre-built Kubernetes alert templates →
Common Kubernetes infrastructure issues and how to fix them
1. What to do when the Kubernetes node memory exceeds 85%
When node memory crosses 85%, and evictions start, find out which workloads are responsible:
kubectl top pods --all-namespaces --sort-by=memorykubectl describe pod <pod-name> -n <namespace>Restart vs. investigate:
| Scenario | Action |
|---|---|
| Stateless pods, climbing memory | Safe to restart immediately |
| Databases / StatefulSets | Check replication health before restarting |
| Gradual growth over days | Restart buys time; won’t fix a leak |
| Sudden spike | Investigate first or you’ll mask the root cause |
Example: Background jobs using 6x their declared memory
Symptoms: Three nodes in a payment processing cluster hit 89% memory. Evictions started across all three. The scheduler could not reschedule the evicted pods because the remaining nodes were already under pressure.
Investigation Steps
- `kubectl top pods` sorted by memory identified which pods were consuming the most.
- `kubectl describe pod` on each one showed the declared request against actual consumption. The background job processors were the outlier, so that’s where the investigation focused.
Root Cause: The processors had no memory limits set. Each was using 9GB against a declared request of 1.5GB. The growth happened over several days. Memory had crossed 80% two hours before evictions started, but nothing alerted on it.
Fix Applied: Restarting the pods reclaimed memory immediately. Limits were set at 6GB, based on p95 usage plus a 20% buffer. An alert was added for memory sustained above 80% for 10 minutes.
Key Learning: The 80% alert would have caught these two hours before evictions started. When setting limits for pods that have never had them, use p95 consumption as the baseline and add 20% headroom. Sudden spikes point to capacity needs. Gradual growth over days points to a leak.
2. Why is a Kubernetes node stuck in the not-ready state?
A node showing NotReady status needs immediate investigation. Check what condition triggered it:
kubectl describe node <node-name>Look for the Conditions section in the output. It shows specific issues: DiskPressure indicates disk space is critically low, MemoryPressure means available memory is insufficient, and Ready=False means kubelet stopped communicating with the API server.
For disk pressure, container logs and accumulated images typically fill the disk. Cordon the node to prevent new pod scheduling, clean up disk space, then uncordon when resolved.
Check kubelet logs when it stops responding. For a deeper look at OS-level metrics alongside cluster data, see Linux infrastructure monitoring with Middleware.
journalctl -u kubelet -n 100Look for errors indicating failed communication with the API server (for example, connection refused or timeout errors) or TLS issues such as expired or invalid certificates.
The recovery approach depends on what’s running on the node. Restart kubelet directly if the node only runs stateless workloads. For nodes with databases or other stateful applications, drain the node first to avoid data loss.
kubectl drain <node-name> --ignore-daemonsets
systemctl restart kubelet
Look for the Conditions section:
| Condition | Cause | Fix |
|---|---|---|
DiskPressure | Logs or images filled the disk | Cordon node, clean disk, uncordon |
MemoryPressure | Insufficient available memory | Drain and address workloads |
Ready=False | kubelet lost connection to API server | Check kubelet logs |
3. What causes Kubernetes DNS dailures and pod connectivity issues?
Most DNS failures and pod connectivity problems come from CoreDNS or network policy misconfigurations. Start by checking CoreDNS health:
kubectl get pods -n kube-system -l k8s-app=kube-dnsIf pods are not running, restart:
`kubectl rollout restart deployment/coredns -n kube-system`If CoreDNS is healthy, look at network policies:
`kubectl get networkpolicies --all-namespaces`Test from the affected pod directly:
kubectl exec -it <pod-name> -n <namespace> -- curl <target-service>Timeouts mean something is blocking the connection. Immediate resolution errors mean DNS is the problem.
Example: New service could not reach Redis because of a missing Label.
Symptoms: Every request from the analytics pod to Redis timed out at 30 seconds. DNS was resolving correctly. Every other service in the namespace could reach Redis. Redeploying the pod changed nothing.
Investigation Steps:
- CoreDNS pod health confirmed running
- DNS resolution tested from inside the pod with `kubectl exec -it <pod-name> — nslookup <service-name>`, resolved correctly, ruling out DNS.
- Direct curl to the Redis IP confirmed the connection timed out, pointing to network policy
- Network policies examined, found missing access=cache label requirement
Root Cause: The 30-second timeout was the key diagnostic signal. DNS failures return immediately with NXDOMAIN. A timeout means the connection is attempted and blocked, pointing to network policy or firewall rules.
Fix Applied: Added `access=cache` to the analytics deployment spec. Connectivity came back on the next pod restart. The label requirement got added to the namespace runbook so the next deployment would not miss it.
Key Learning: The timeout duration is a diagnostic signal. A 30-second hang means the connection is being attempted and blocked. An immediate error means resolution failed. When one service fails and others in the same namespace succeed, start with what is different about that service.
4. Why are pods stuck in pending with failedmount errors?
Pods stuck in Pending with FailedMount errors indicate problems with PersistentVolumes. Check the status:
kubectl get pv
kubectl get pvc --all-namespaces
A PVC showing Pending status means either the StorageClass is misconfigured or no PersistentVolume matches the claim. Get details from the pod events:
kubectl describe pod <pod-name> -n <namespace>The Events section in the output shows specific errors like “no persistent volumes available” or “volume type not supported.”
Slow disk I/O on a pod that mounts a PersistentVolume is often a burst credit problem. If the volume is on burstable storage and the workload writes consistently, credits drain faster than they replenish and latency climbs until writes start failing. Check the storage class and move workloads with consistent write patterns to provisioned IOPS storage. The PostgreSQL incident earlier in this guide is the same problem showing up at the database layer.
Common Kubernetes metrics misinterpretations
| Symptom | Wrong Assumption | What to Actually Check |
|---|---|---|
| High CPU | Need bigger nodes | Run kubectl top pods --containers; look for per-container throttling. Bigger nodes won’t fix a per-pod CPU limit. |
| Memory at 80% | Running out of capacity | Linux includes page cache in used memory. Run kubectl top pods to check actual application consumption before scaling. |
| High disk I/O | Need faster disks | Run iostat -x 1 or check pod-level activity in Middleware. Excessive log writes or unoptimized queries don’t need faster hardware — they need the root behavior fixed. |
Why teams choose Middleware over Prometheus and Grafana
Both options solve Kubernetes monitoring. The difference is operational cost.
| Factor | Middleware | Prometheus + Grafana |
|---|---|---|
| Setup time | Minutes (Helm install + pre-built dashboards) | Days to configure; longer to stabilize |
| Storage management | Handled by Middleware | Team owns retention, scaling, cardinality |
| Dashboard maintenance | Pre-built; update automatically | Manual; breaks when infrastructure changes |
| Incident detection | OpsAI auto-detects crash loops, memory leaks, pod restarts | Manual alert rules required |
| Query flexibility | Standard infrastructure + APM coverage | Full PromQL; custom recording rules |
| Monitoring stack failures | Not your problem | Become their own incidents |
For a deep dive into how the three tools compare on architecture, hidden costs, and team fit, read Prometheus vs Grafana vs Middleware: Which One to Choose?
When Prometheus still makes sense: Teams with existing PromQL-based tooling, custom recording rules, or requirements beyond standard infrastructure and APM coverage. Middleware doesn’t match Prometheus’s query flexibility. If you need that control, the self-hosted stack is worth the overhead.
For teams without dedicated platform engineers, Middleware removes the recurring maintenance cost of running a separate observability pipeline storage scaling, Prometheus upgrades, and handling increased metric cardinality as clusters grow all handled on their side.
See your entire Kubernetes cluster in one dashboard nodes, pods, namespaces, and logs.
Get started with Middleware →
No credit card required. Metrics visible within 5 minutes of install.
Conclusion
Infrastructure monitoring changes how teams respond to incidents. Problems show up in metrics hours before users notice them. This advance warning means you can add capacity during planned maintenance rather than scrambling during an outage.
The metrics and alert thresholds covered here provide the foundation for reliable cluster operations. Middleware combines infrastructure metrics with application performance monitoring and log aggregation in one platform. This removes the operational overhead of running separate observability tools as clusters scale.
FAQs
What is Kubernetes infrastructure monitoring?
Kubernetes infrastructure monitoring tracks cluster-level health metrics node CPU, memory, disk, and network along with control plane status and pod scheduling capacity. It surfaces problems in metrics before users notice them, giving teams time to respond.
What's the difference between Kubernetes infrastructure monitoring and application monitoring?
Infrastructure monitoring covers cluster health: nodes, CPU, memory, disk, network. Application monitoring covers your code: request rates, errors, and latency. Both are required for production operations.
How often should Kubernetes metrics be collected?
Use 10–15 second intervals for CPU and memory to catch spikes. Disk space can be sampled every 60 seconds. Most clusters don’t need sub-10-second collection unless debugging active incidents.
What are the right alert thresholds for Kubernetes nodes?
Start with: disk above 85%, memory above 90%, CPU sustained above 80% for 15 minutes, and any node entering NotReady state. Run the cluster for 3–7 days before setting thresholds without baseline data, alerts fire on normal behavior.
What causes Kubernetes nodes to enter NotReady state?
The three main causes are disk pressure (logs or container images filling the disk), memory pressure (resource exhaustion), and kubelet losing communication with the API server. Use kubectl describe node <name> to identify the specific condition.
When should I add nodes vs. optimize existing resources?
Add nodes when sustained CPU above 80% or memory above 85% persists across multiple nodes during normal load. Optimize first when a single pod consumes excessive resources or workloads show gradual memory growth over days (indicating a leak).
How do I monitor multiple Kubernetes clusters with Middleware?
Set a distinct clusterMetadata.name value in each agent installation. Each cluster appears as a separate entity in the Middleware Infrastructure dashboard, with cross-cluster visibility from the same account.
Does Middleware support Kubernetes alerting for Slack and PagerDuty?
Yes. Middleware routes alerts to email, Slack, PagerDuty, and other integrations. Each notification includes a dashboard link showing the alert timeline and relevant metrics. See the Middleware Alerts documentation for setup.