Amazon EKS on Fargate is a fully serverless Kubernetes environment, with no EC2 nodes to manage, no DaemonSets and no host filesystem access. That architecture simplifies operations but breaks traditional observability tools that rely on node-level agents.
This guide shows you how to monitor EKS Fargate workloads using Middleware. You will configure log routing via AWS’s built-in Fluent Bit integration, collect pod and container metrics using the ADOT Collector, and build a real-time dashboard all through a single Helm install, without CloudWatch.
What You’ll Learn
- Why traditional DaemonSet-based collectors don’t work on EKS Fargate
- How AWS’s built-in Fluent Bit log router works and how to configure it
- How to deploy the ADOT Collector for pod-level metrics without node access
- How to install Middleware on EKS Fargate with a single Helm command
- How to build an observability dashboard using Middleware’s AI Dashboard Builder
What is EKS Fargate Logging
EKS Fargate logging is the process of capturing stdout and stderr output from
containers running in Fargate’s serverless micro-VMs and forwarding those
streams to an external observability platform. Because Fargate pods run in
isolated environments with no shared host node, standard DaemonSet collectors cannot access container logs. AWS provides a built-in Fluent Bit process in each micro-VM, configured via the aws-observability namespace and aws-logging ConfigMap, to handle this routing.
What Makes Fargate Logging Different
On a typical EKS cluster, container logs land in /var/log/containers/ on the host node. A DaemonSet collector reads from there and ships them to your monitoring platform. It works because every node in the cluster looks the same.
Fargate changes that entirely. Each pod runs in its own isolated micro-VM. There is no shared node, no common filesystem, and no mount path. The one collector-per-node model has nothing to attach to.
To solve this, AWS includes a built-in Fluent Bit log router designed specifically for Fargate workloads. Rather than running your own DaemonSet-based collector, you configure this managed router to pick up stdout and stderr streams from your containers and forward them to the logging destination you prefer.
With Middleware, you don’t have to wire this up manually. The Helm chart handles creating and applying the required configuration, so log forwarding works automatically once the deployment is complete.
Metrics collection runs into the same architectural limitation. Since you cannot deploy a node-level agent, Middleware uses the AWS Distro for OpenTelemetry (ADOT) Collector, deployed as a StatefulSet. The collector pulls pod and container metrics from the Kubelet API and forwards them to Middleware without requiring host access.
How Middleware Collects Logs and Metrics on EKS Fargate
Before diving into the setup steps, it helps to understand the data flow for both logs and metrics.
EKS Fargate Log collection flow
AWS knew DaemonSets wouldn’t work, so they built a Fluent Bit process directly into every Fargate micro-VM. You can’t install it. It’s already there. What you can do is configure where it sends your logs.
Here’s how the full flow works:
- Your containers write to stdout/stderr as they normally would
- The built-in Fluent Bit process in each micro-VM picks up those streams
- An
aws-loggingConfigMap in theaws-observabilitynamespace tells Fluent Bit where to send the data - Fluent Bit enriches each log line with pod name, namespace, labels, and auto-detected log level
- Logs go directly to your Middleware endpoint CloudWatch never sees them.
EKS Fargate Metrics collection flow
For metrics, there’s no built-in shortcut. But there is a clean solution the AWS Distro for OpenTelemetry (ADOT) Collector, deployed as a StatefulSet in its own namespace.
- The ADOT Collector runs in
fargate-container-insights - It scrapes cAdvisor metrics from the Kubelet API, filtering specifically for Fargate pods
- It computes derived metrics: CPU utilization, memory working set and network throughput
- Everything ships to Middleware via OTLP/HTTP
No node access needed. No host mounts. Just a collector that knows how to talk to the Kubelet API from within the cluster.
Not sure which AWS compute model fits your stack? Start with AWS monitoring best practices →
EKS Auto Mode vs. EKS Fargate: Monitoring Differences
If you’re still evaluating compute options, this table might save you some headaches. EKS Auto Mode and EKS Fargate both reduce how much cluster management you do, but they’re quite different from a monitoring perspective.
| Feature | EKS Auto Mode | EKS Fargate |
| Node management | Automates node provisioning and scaling using managed EC2 instances | Runs each pod in a dedicated serverless micro-VM |
| DaemonSets | Supported | Not supported |
| Host access | Limited but available | Not available |
| Middleware log collection | Standard DaemonSet + /var/log/containers | Built-in Fluent Bit log router |
| Middleware metrics | Standard DaemonSet | ADOT Collector as StatefulSet |
| Use case | Simplified cluster ops with node-level flexibility | Fully serverless, fully isolated workloads |
| Cost model | Pay per EC2 node (on-demand or Spot) | Pay per pod per second |
If you’re running batch jobs, bursty workloads, or anything where workload isolation matters, Fargate is a great fit. If you need node-level access for things like custom kernel tuning or eBPF tooling, Auto Mode is probably the better call.
Prerequisites
Before you begin, confirm you have the following:
- An active AWS account with an EKS cluster configured with Fargate profiles
- kubectl is installed and configured to communicate with your cluster
- helm CLI installed (v3 or later)
- A Middleware account with your API key and target URL is ready. Start a free trial of AWS Monitoring.
If your entire cluster runs on Fargate (no EC2 node groups at all), ensure that mw-agent-ns is included in a Fargate profile otherwise the agent pods will remain in a pending state
Deploy Middleware on EKS Fargate
Step 1: Add the Middleware Helm repository
First, add the Middleware Helm chart repository to your local Helm configuration:
Step 1: Add Middleware Helm repository
helm repo add middleware-labs https://helm.middleware.io
helm repo update
With a single Helm installation, both log routing and metrics collection are enabled for EKS Fargate. No additional infrastructure components or node-level agents are required.
Step 2: Install the Middleware agent with Fargate settings
Run the following Helm install command with the Fargate-specific flags enabled and replace the placeholder values with your actual Middleware credentials and cluster name:
Step 2: Install Middleware agent with Fargate flags
helm install mw-agent middleware-labs/mw-kube-agent-v3 \
 --set global.mw.apiKey=<YOUR_API_KEY> \
 --set global.mw.target=<YOUR_MW_TARGET> \
 --set mw-autoinstrumentation.mode=manual \
 --set mw-autoinstrumentation.enabled=true \
 --set global.clusterMetadata.name=<YOUR_CLUSTER_NAME> \
 --set providers.eks.fargate.enabled=true \
 --set providers.eks.fargate.logRouter.enabled=true \
 --set providers.eks.fargate.containerInsights.enabled=true \
 -n mw-agent-ns --create-namespace
Each Fargate-related flag controls a specific part of the setup:
providers.eks.fargate.enabled=true— enables Fargate-specific behavior in the chart.providers.eks.fargate.logRouter.enabled=true— creates the aws-observability namespace and installs the Fluent Bit ConfigMap to forward logs to Middleware.providers.eks.fargate.containerInsights.enabled=true— deploys the ADOT Collector as a StatefulSet in the fargate-container-insights namespace to collect pod and container metrics.
For a full overview of what Middleware covers across AWS services, see the AWS monitoring guide →
Step 3: Verify the installation
Once the install completes, verify that the agent components are running correctly:
# Step 3: Verify installation
# Check the main agent namespace
kubectl get pods -n mw-agent-ns

# Verify the aws-observability namespace and ConfigMap were created
kubectl get namespace aws-observability
kubectl get configmap -n aws-observability

# Check the ADOT Collector for metrics
kubectl get pods -n fargate-container-insights
After installation, confirm that the ADOT Collector is running in fargate-container-insights and that the aws-logging ConfigMap is created in aws-observability. Initialization may take a short time.
kubectl create deployment nginx-test --image=nginx --replicas=2
kubectl expose deployment nginx-test --port=80 --type=ClusterIP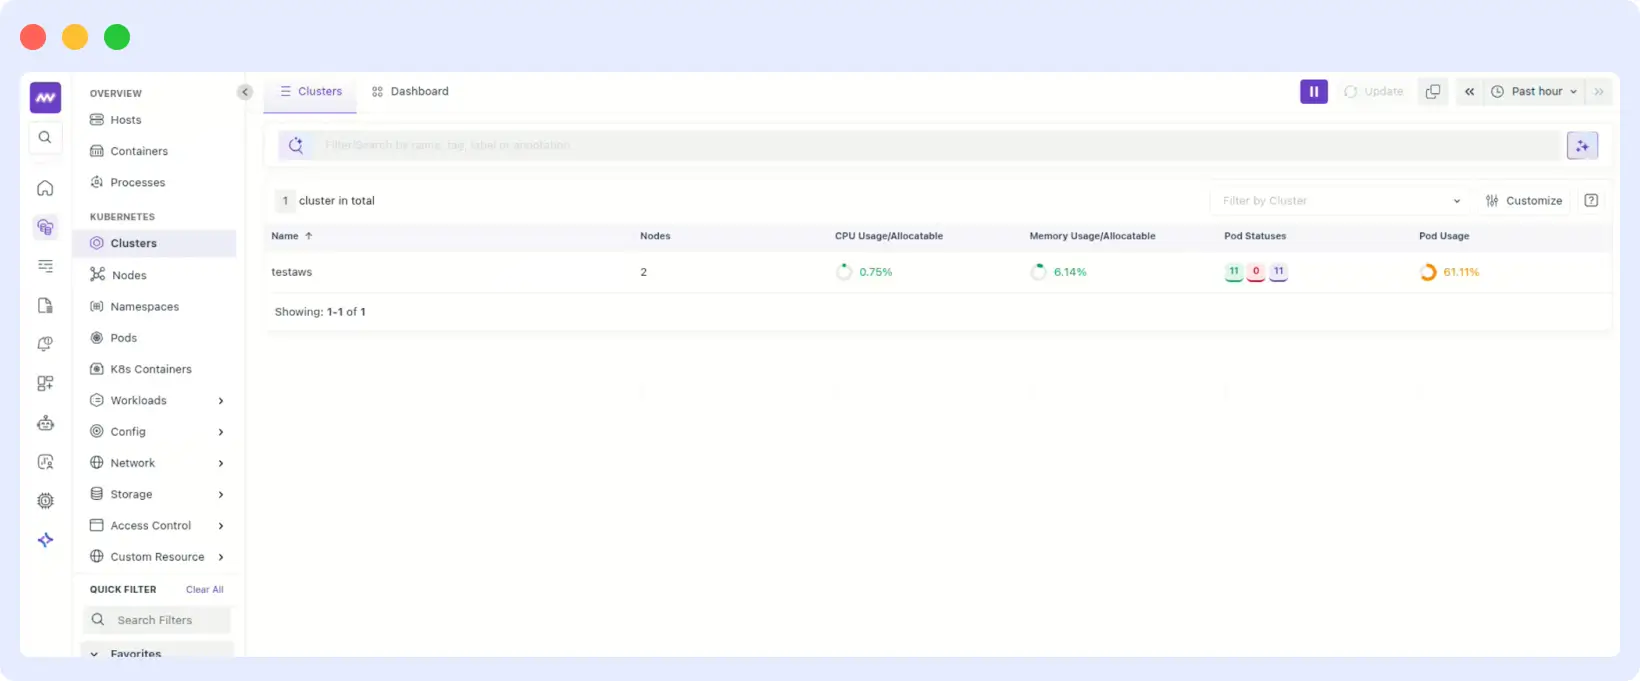
Make sure this deployment runs in a namespace covered by your Fargate profile. Generate some traffic to the application to produce log output:
# Run a temporary pod to hit the service


      kubectl run curl-test --image=curlimages/curl --rm -it --restart=Never -- \
 curl http://nginx-test
Step 5: View logs and metrics in Middleware
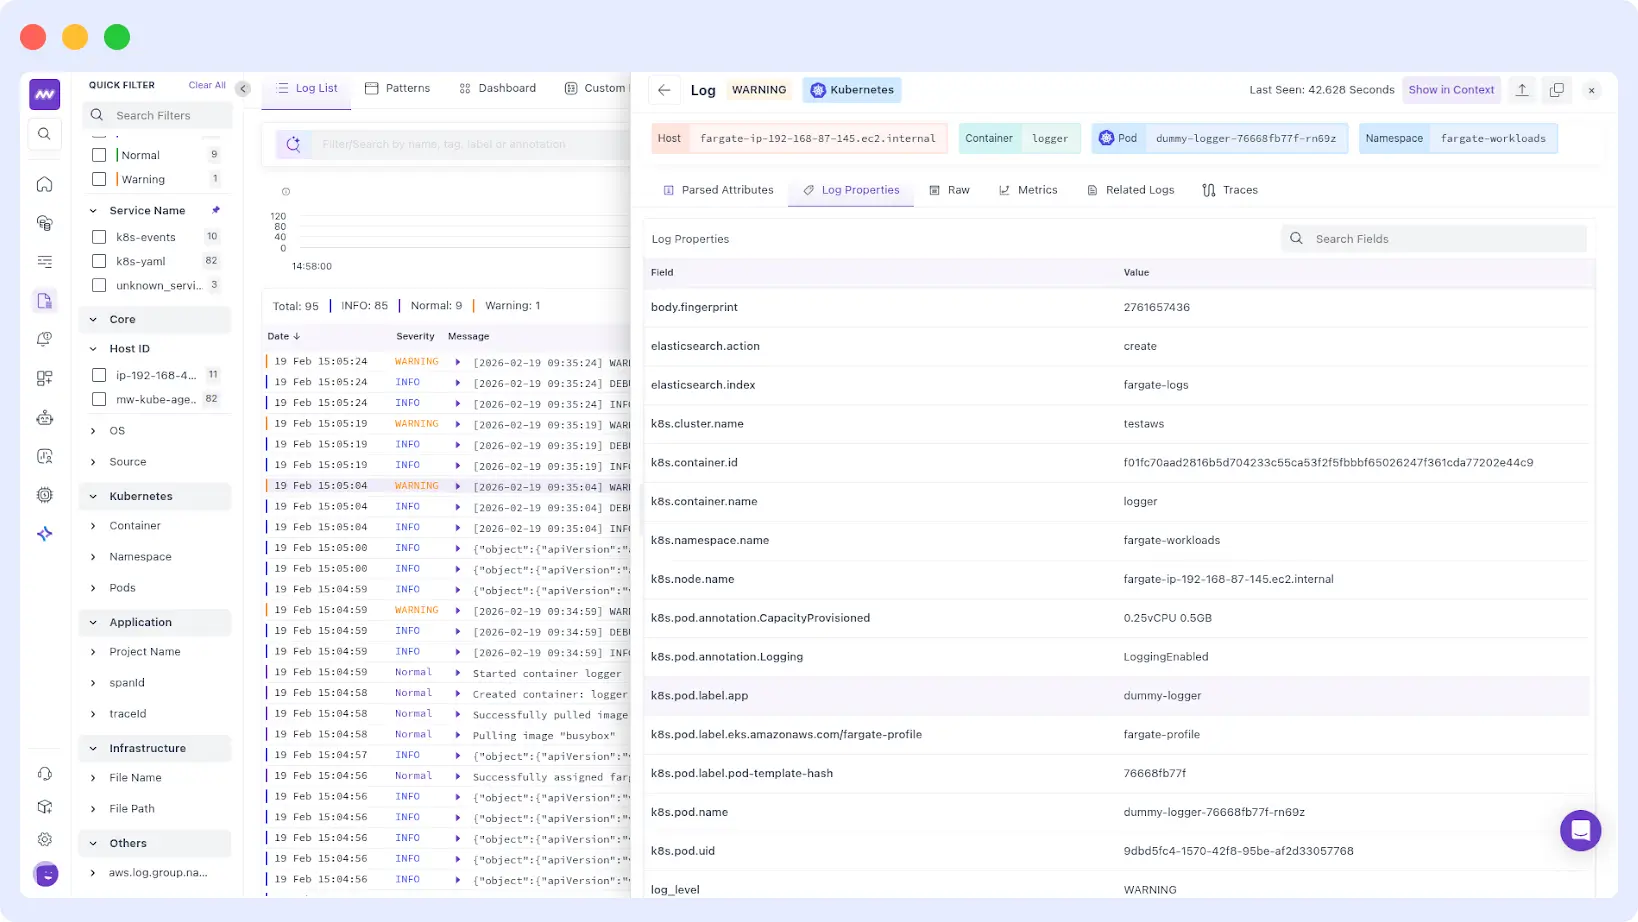
Navigate to your Middleware dashboard and open the Log Explorer. Within a few minutes of the agent coming up, you should begin seeing logs from your Fargate pods flowing in. Each log entry will be enriched with metadata including:
- Pod name and namespace
- Container name
- Auto-detected log level (ERROR, WARNING, INFO)
- Kubernetes labels from the source pod
For metrics, navigate to the Infrastructure section of your Middleware dashboard. You will find pod-level and container-level metrics, including:
- CPU usage and limits per pod and container
- Memory usage, working set, and limits per pod and container
- Network bytes in and out per pod
- Container filesystem capacity and usage
Build a Fargate Metrics Dashboard with Middleware
Here’s one of the better parts of the Middleware setup: once your metrics are flowing, you don’t have to hand-write Prometheus queries to get a dashboard.
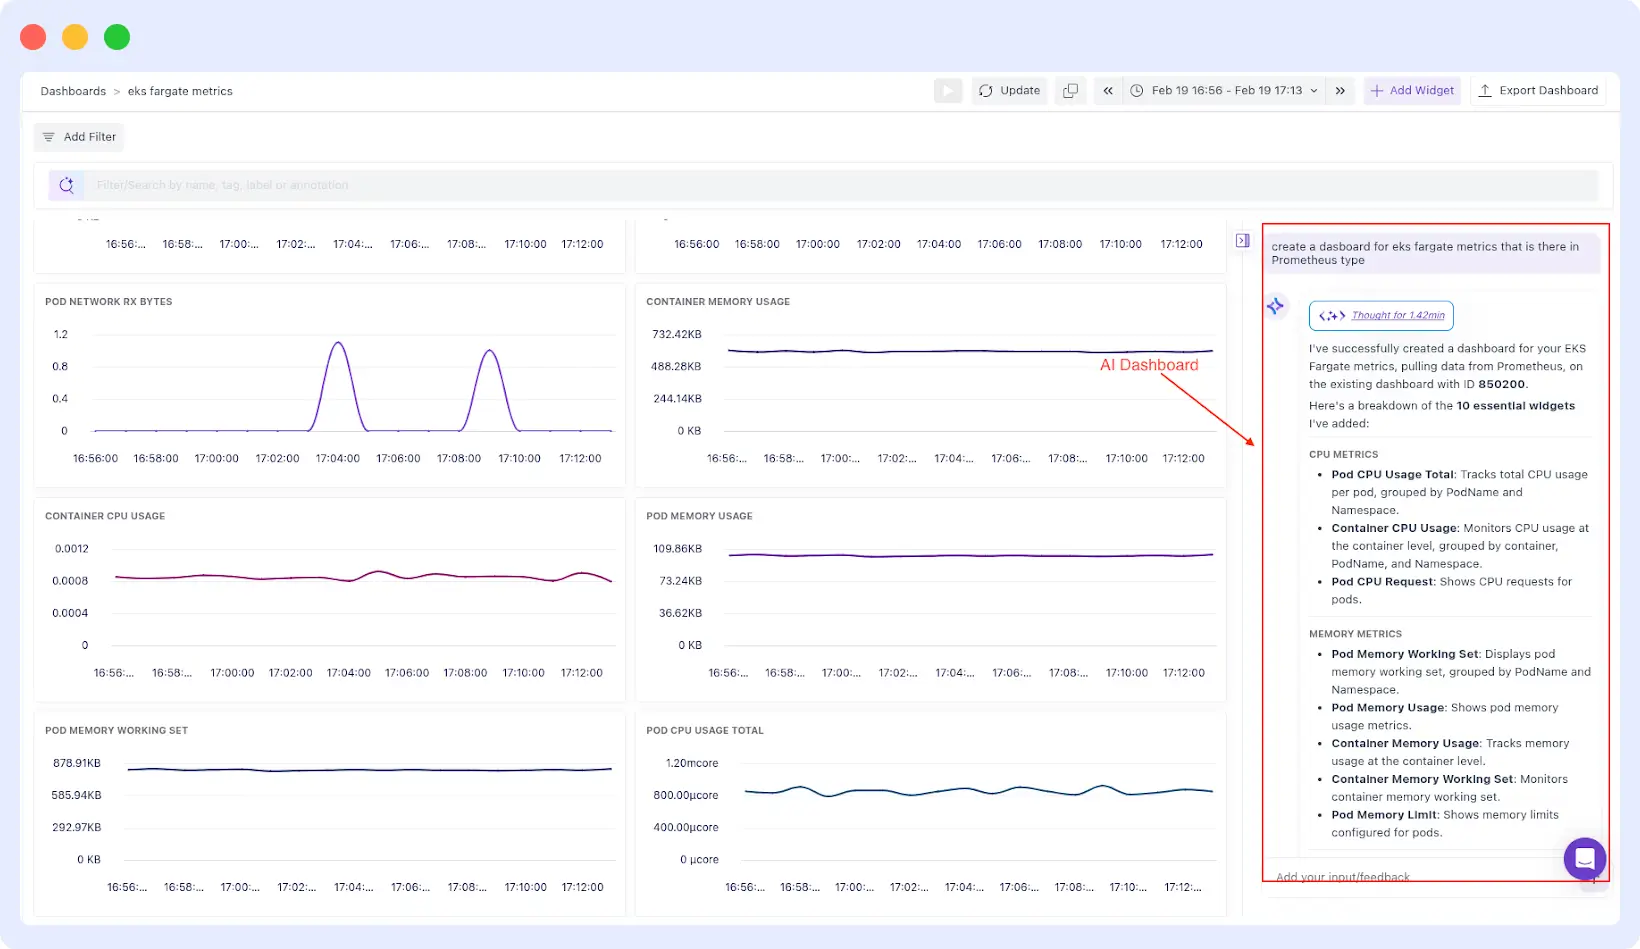
Go to Dashboards → Create Dashboard and type something like:
“Create a dashboard for EKS Fargate metrics that are in Prometheus type”
Middleware’s AI Dashboard Builder analyzes your available telemetry and generates relevant widgets automatically: CPU usage per pod, memory working set, network receive bytes, all grouped by PodName and Namespace.
You can tune it from there: adjust filters, change the time range, refine queries, swap visualizations. But you’re starting from something real instead of a blank canvas.
If any widget shows “No data,” confirm that metrics collection is active in the fargate-container-insights namespace and verify your selected time window.
Configuration Reference
The full set of configurable Fargate-specific values is shown below. You can pass any of these as –set flags or include them in a custom values.yaml file:Configuration Reference
The full set of configurable Fargate-specific values is shown below. You can pass any of these as –set flags or include them in a custom values.yaml file:
providers:
 eks:
   fargate:
     enabled: false                              # Enable Fargate-specific configuration
     createNamespace: true              # Creates the aws-observability namespace
     logRouter:
       enabled: false                           # Deploys Fluent Bit log router ConfigMap
       createConfigMap: true            # Set to false if using a custom ConfigMap
     containerInsights:
       enabled: false                          # Deploys ADOT Collector for container metrics
       createNamespace: true          # Set to false if namespace already exists
To pass a custom values file rather than –set flags, put your overrides in a file (e.g., mw-values.yaml) and pass it during installation:
helm install mw-agent middleware-labs/mw-kube-agent-v3 \
 -f mw-values.yaml \
 -n mw-agent-ns --create-namespace
If you use AWS Kinesis Streams for log delivery, Middleware’s default AWS dashboards come pre-configured for that pipeline too.
When Things Go Wrong
Why are my EKS Fargate pods stuck in Pending state?
Almost always a Fargate profile issue. The mw-agent-ns namespace isn’t covered by any of your profiles. Check your cluster’s Fargate profiles, add mw-agent-ns, then delete and recreate the pending pods.
Why are no logs appearing in Middleware after installation?
If logs are not flowing, check the following:
- Confirm the aws-observability namespace has the required label: aws-observability: enabled
- Confirm the aws-logging ConfigMap was created in the aws-observability namespace
- Verify your pods are running in a namespace covered by a Fargate profile pods on EC2 nodes are not affected by the Fargate log router
Need visibility into API-level events alongside container logs? AWS CloudTrail logs integrate with the same Middleware setup.
Why are no metrics showing up in the Middleware dashboard?
- Check the ADOT Collector pod status in fargate-container-insights
- Ensure the pod’s IAM execution role has the necessary permissions to access the Kubelet API
- Wait 2–3 minutes after pod startup — there can be a delay before metrics begin appearing
Why is the Middleware agent crash-looping or getting OOMKilled?
On larger clusters, the default resource requests for the agent may be insufficient. Increase the CPU and memory limits via Helm values to match your cluster size. Refer to the full values.yaml in the Middleware GitHub repository for the relevant resource configuration keys.
The Bottom Line
Fargate is a genuinely great way to run Kubernetes workloads if you want to stop thinking about nodes. But it does force you to rethink how monitoring works no DaemonSets, no host access, no /var/log/containers/.
Middleware adapts to these constraints rather than fighting them. Logs flow through AWS’s built-in Fluent Bit integration directly to your Middleware account. Metrics are scraped by the ADOT Collector without any node access required. One Helm install covers both, with no additional infrastructure and no CloudWatch costs.
Start Monitoring Your Fargate Workloads
If you are running workloads on EKS Fargate and want complete visibility into logs and metrics without managing nodes or paying additional CloudWatch ingestion costs, try Middleware on your cluster today.
Skipping CloudWatch is just one piece; here are proven ways to reduce your AWS costs across the board.
Start free trial | visit the Middleware docs for ECS Farget Setup.
FAQs
What is EKS Fargate logging?
EKS Fargate logging is the process of collecting and forwarding container logs from pods running in a serverless Fargate environment. Unlike traditional Kubernetes clusters, Fargate does not expose the underlying host node. Logs are routed through AWS’s built-in Fluent Bit integration, configured using the aws-observability namespace and aws-logging ConfigMap
Can you run DaemonSets on EKS Fargate?
No. EKS Fargate does not support DaemonSets because the underlying nodes are abstracted away. Observability tools that depend on DaemonSet-based agents must use an alternative approach when running on Fargate
How do you collect logs from EKS Fargate without CloudWatch?
You can configure AWS’s built-in Fluent Bit router to forward logs directly to an external observability platform. This enables Fargate logging without CloudWatch ingestion, avoiding additional storage and data transfer costs. Middleware configures this integration automatically during installation.
Does EKS Fargate support node-level monitoring?
No. Fargate removes node-level visibility entirely. Monitoring must operate at the pod and container level. Middleware deploys the ADOT Collector as a StatefulSet to collect metrics directly from the Kubelet API without requiring host access.
Does Middleware support EKS Fargate out of the box?
Yes. Middleware’s Helm chart includes native support for EKS Fargate. Enabling the providers.eks.fargate.enabled=true flag configures both log routing and metrics collection in a single installation step.