Summary: OpsAI is Middleware’s AI-native SRE agent that detects, diagnoses, and fixes production issues across APM, RUM, Logs, Kubernetes, and even third-party tools like Datadog and Grafana. Built on top of Middleware’s full-stack observability platform, OpsAI doesn’t just tell you something broke — it tells you why, where, and ships a pull request with the fix. Internally, it now resolves more than 80% of our production issues automatically. In customer benchmarks, it’s delivering 6×–10× faster time-to-resolution than competing AI SRE agents.
TL;DR
- OpsAI is Middleware’s AI-native SRE agent that goes all the way from detecting a production issue to automatically shipping a merged pull request with the fix before users are affected.
- Traditional monitoring tells you something broke. OpsAI tells you why, where in the codebase, and opens a PR with the fix, covering APM, RUM, logs, Kubernetes and third-party tools like Datadog and Grafana, all from one platform.
- It works in three stages: continuous detection across your full stack, root cause analysis that correlates signals across services, and code-level fix generation with an automated PR workflow.
- Internally, OpsAI now resolves more than 80% of Middleware’s own production issues automatically. In customer benchmarks, it delivers 6x to 10x faster time-to-resolution than competing AI SRE agents.
- It only acts when confidence exceeds 95%, so engineers stay in control, with human review before anything merges.
- OpsAI is one of the few tools that completes the full incident response loop, detection, diagnosis, and fix, in a single flow, without stitching together multiple tools.
A new era for on-call engineers
The last decade has been a quiet disaster for on-call engineers.
Cloud-native architectures lead us to microservices, Kubernetes, multi-region deployments, and an explosion of telemetry. AI coding tools made it easier to ship code faster. But faster shipping meant more bugs, more regressions, and more edge cases making it into production every single day, at massive scale. Observability platforms responded by collecting more data, building prettier dashboards, and adding more alerts.
The result? More noise. Bigger pager loads. Engineers spend up to 60% of their time finding root causes instead of building features. And a 3 AM PagerDuty notification has become an industry rite of passage rather than a rare incident.
We’ve spent years at Middleware building a unified observability platform that brings logs, metrics, and traces together in a single place. But we kept asking ourselves the same uncomfortable question: if all the data is in one place, why are humans still doing the correlation work?
To solve this problem, we are excited to bring Middleware Ops AI – an SRE agent that detects, diagnoses, and fixes production issues across APM, RUM, Logs, Kubernetes, and even third-party tools.
What is Middleware OpsAI SRE Agent?
OpsAI is an AI-native SRE agent built directly into the Middleware observability platform. It detects production issues across your application, infrastructure, Kubernetes, and frontend, runs root cause analysis automatically, and, where confident, ships a code fix as a pull request, without waking your on-call engineer.
What OpsAI SRE Agent can do for you…
- Monitor your APM, RUM, Logs, Infrastructure, and Kubernetes events continuously.
- Automatically monitor alerts from Middleware’s native monitors and third-party tools such as Datadog and Grafana.
- Pulls in stack traces, log context, error metadata, and your source code via a secure GitHub MCP connection.
- Runs root cause analysis using full-stack observability context.
- For application errors, open a pull request with a clean diff for human review.
- For Kubernetes incidents, you can apply the fix directly (Auto Fix mode) or just suggest it (Auto RCA mode), your call.
- Reads only the files relevant to a specific error. It never scans your full codebase or stores your source code.
Think of OpsAI as an always-on SRE that knows your stack from the load balancer to the line of code, doesn’t sleep, doesn’t context-switch, and doesn’t get tired at 3 AM.
Why we built OpsAI on top of full-stack observability
There’s a real architectural debate happening in the AI SRE space, and it’s worth being upfront about it.
Some agents (like Resolve AI) take a platform-agnostic approach; they sit on top of whatever observability stack you already have and orchestrate across vendor APIs.
That sounds appealing for teams with heavy existing investments. But it comes with real costs: every external API call is a potential point of latency, rate-limiting, schema mismatch, or simply missing context. The agent is only as fast as the slowest API it queries and only as accurate as the data those APIs expose.
Other agents (Datadog Bits AI, New Relic’s SRE Agent, Observe’s o11y AI) are deeply integrated into a single observability platform, but they lock you into that vendor’s pricing and ecosystem.
OpsAI takes the best of both worlds:
- Native, first-party access to a full-stack observability layer. OpsAI sits on top of Middleware’s own platform, so it has direct, low-latency access to APM traces, RUM sessions, Kubernetes telemetry, logs, and metrics, no API hops, no schema translation, no waiting.
- OpenTelemetry-native and integration-friendly. OpsAI ingests alerts and queries data from Datadog and Grafana, so teams with existing investments don’t have to migrate to benefit from agentic SRE.
- Usage-based pricing. No enterprise contracts, no surprise overages, no DPU-style billing tricks.
OpsAI sits inside native, first-party access to every signal. That means three concrete advantages:
- Speed: no waiting on third-party API responses for every investigation.
- Accuracy: no schema mismatches, no missing fields, no rate-limited queries.
- Depth: correlations between traces, logs, metrics, frontend sessions, and Kubernetes telemetry happen inside a single data layer.
For teams that want this advantage without migrating from Datadog or Grafana, OpsAI’s third-party alert ingestion offers a hybrid path.
The problem: what modern engineering teams are actually facing
Before we go deeper into what OpsAI does, let’s understand the pain. Across hundreds of conversations with platform engineers, SREs, and CTOs, the same patterns come up over and over:
1. Alert fatigue is at an all-time high. A modern microservices stack throws thousands of alerts a week. Most are false positives, duplicates, or thresholds that were set on day one and never tuned. In one customer environment we benchmarked, a single misconfigured CPU monitor fired 1,073 times in 7 days with zero resolutions, pure noise drowning the real signal.
2. Context-switching is the actual MTTR killer. When something breaks, an engineer typically jumps between five or six tools: PagerDuty for the alert, Datadog or Grafana for metrics, Loki or Splunk for logs, GitHub for the suspect commit, Slack to coordinate, and a runbook wiki that’s three months out of date. Each context switch costs minutes; a single P1 incident can chew through hours before anyone has even confirmed what broke, let alone why.
3. Kubernetes opacity. Pods crash. Memory leaks. ConfigMaps get out of sync. Init containers fail silently. And the only way to find out is to chain together half a dozen kubectl commands the engineer has to remember from a Slack thread last quarter.
4. AI-generated code is multiplying production bugs. Teams are shipping more code than ever, much of it generated by Copilot, Cursor, or in-house LLMs. That code passes review and tests, but still introduces subtle runtime errors that only surface under real production traffic.
5. Static dashboards and traditional monitoring tell you something broke, but not why. Even with the best observability stack in the world, a human still has to do the detective work of correlating signals across services, time windows, and code versions.
The industry has been trying to solve this with more tools. We think the answer is fewer humans doing manual correlation and an agent built specifically to do it.
What OpsAI does: capabilities and key features
1. Automated error fixing across the application stack
When OpsAI catches an error from your APM traces or RUM sessions, a backend exception, a frontend crash or a runtime error, it doesn’t just file a ticket. It:
- Pulls the stack trace, request context, environment variables, and recent commits.
- Connects to your repo via secure GitHub MCP and pulls only the files referenced in the trace.
- Runs root cause analysis using full observability context.
- Generates a pull request with a clean diff when its confidence threshold is met.
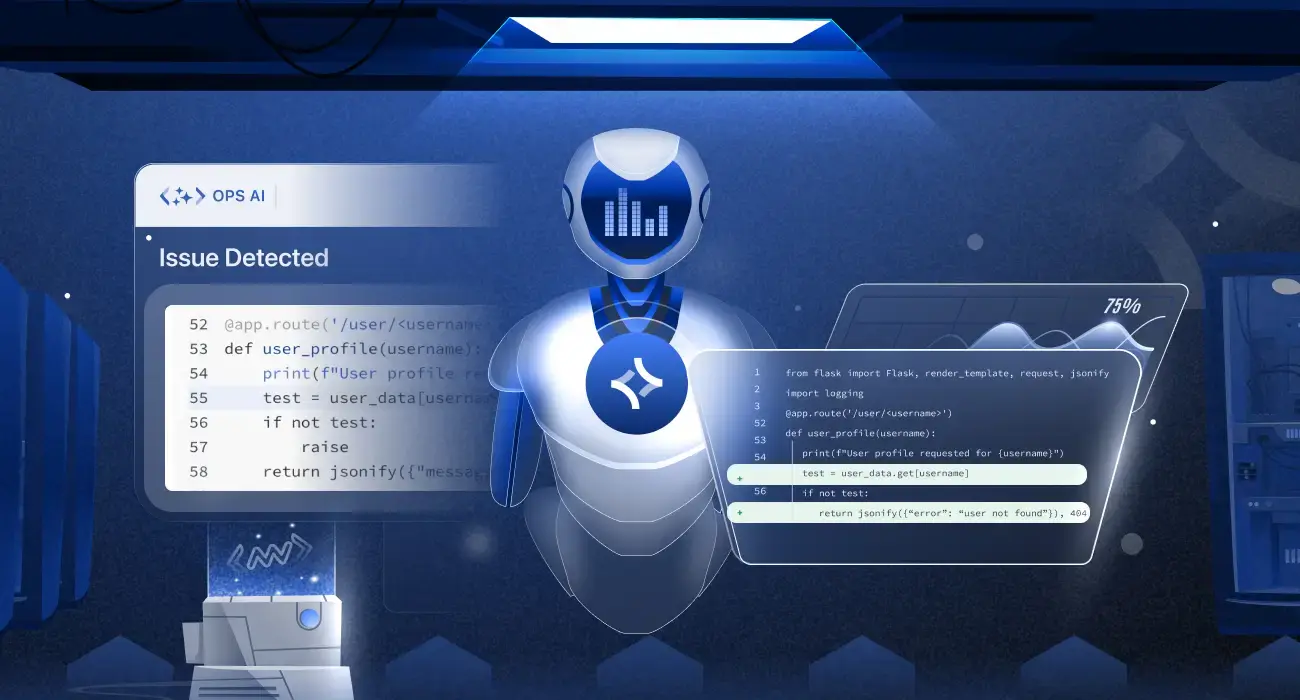
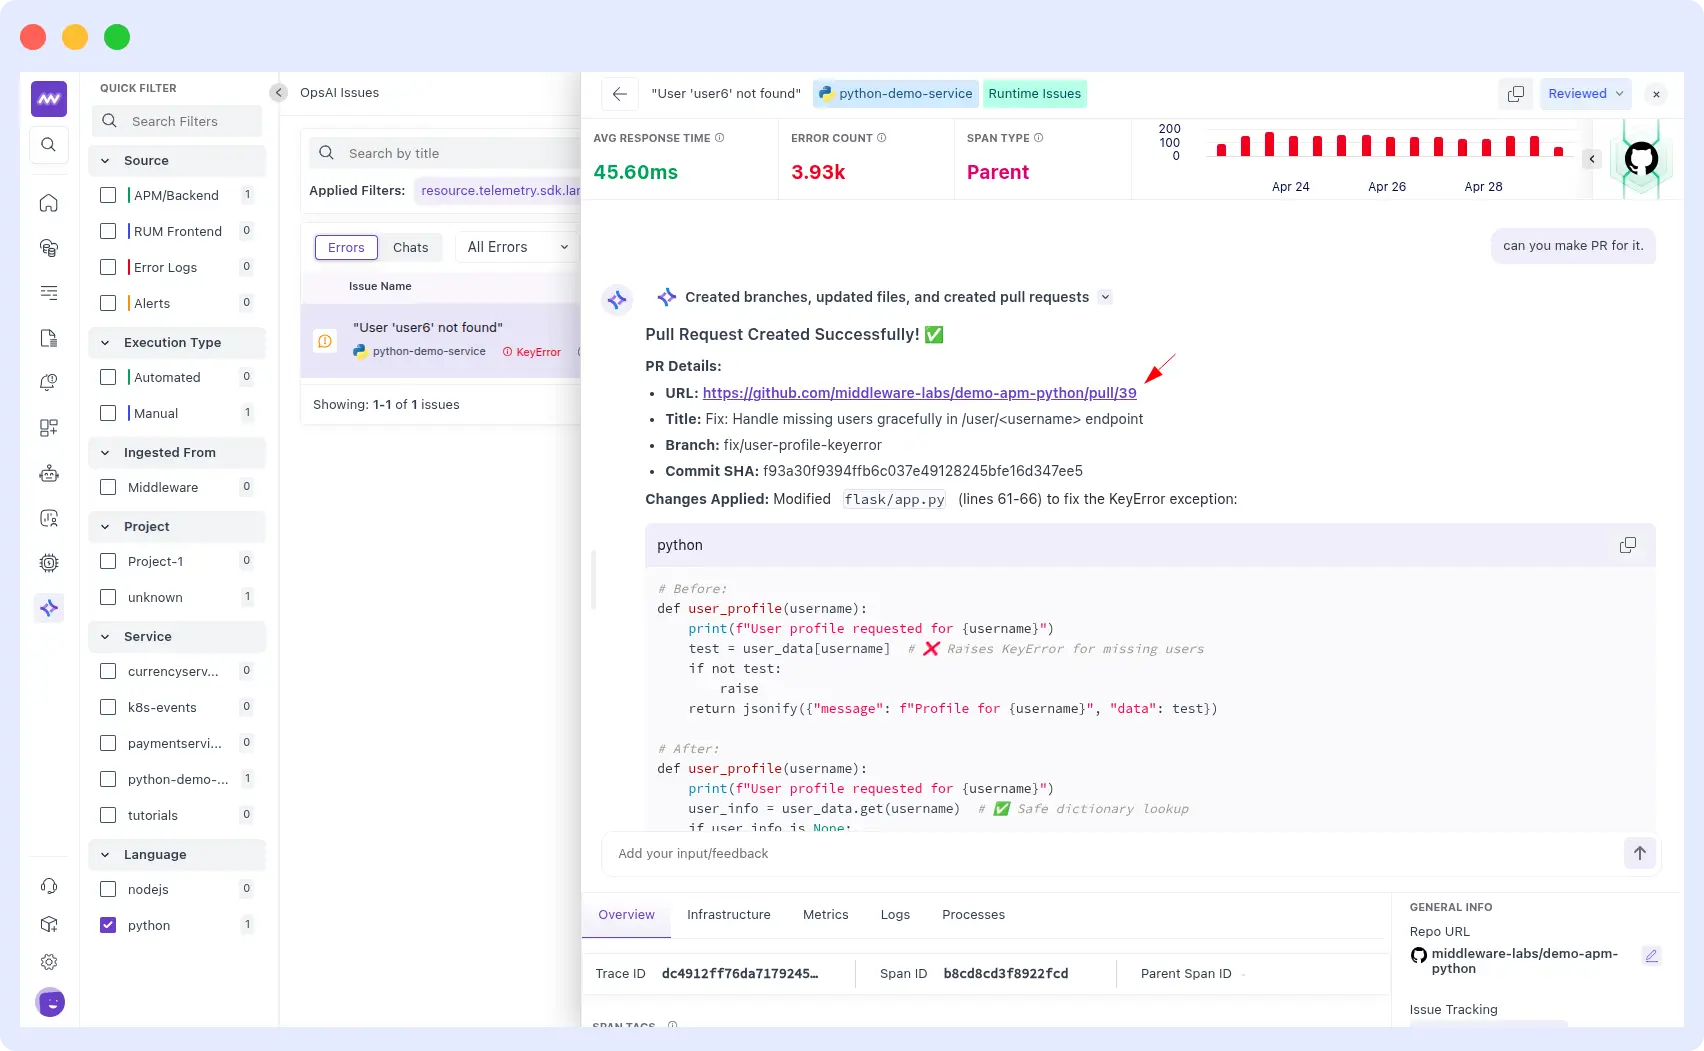
Example from a real customer run: a Python demo service started throwing a KeyError on the /user/<username> endpoint, returning “User not found” errors for missing users.
OpsAI traced the issue to an unsafe dictionary lookup at lines 61–66 of flask/app.py, swapped it for a safe .get() call, and opened PR #39: “Fix: Handle missing users gracefully in /user/<username> endpoint”, open and ready for engineering review. End-to-end resolution, under two minutes.
2. Kubernetes debugging and auto-fix
Kubernetes is where MTTR usually goes to die. OpsAI handles the worst categories of K8s incidents directly:
- Pod crashes and CrashLoopBackOff loops
- OOMKilled events and memory leaks
- Misconfigured ConfigMaps, Secrets, and volume mounts
- API key and network connectivity failures
You can choose your comfort level:
- Auto RCA mode: OpsAI investigates and proposes a fix; you apply it.
- Auto Fix mode: OpsAI applies the fix directly to the cluster.
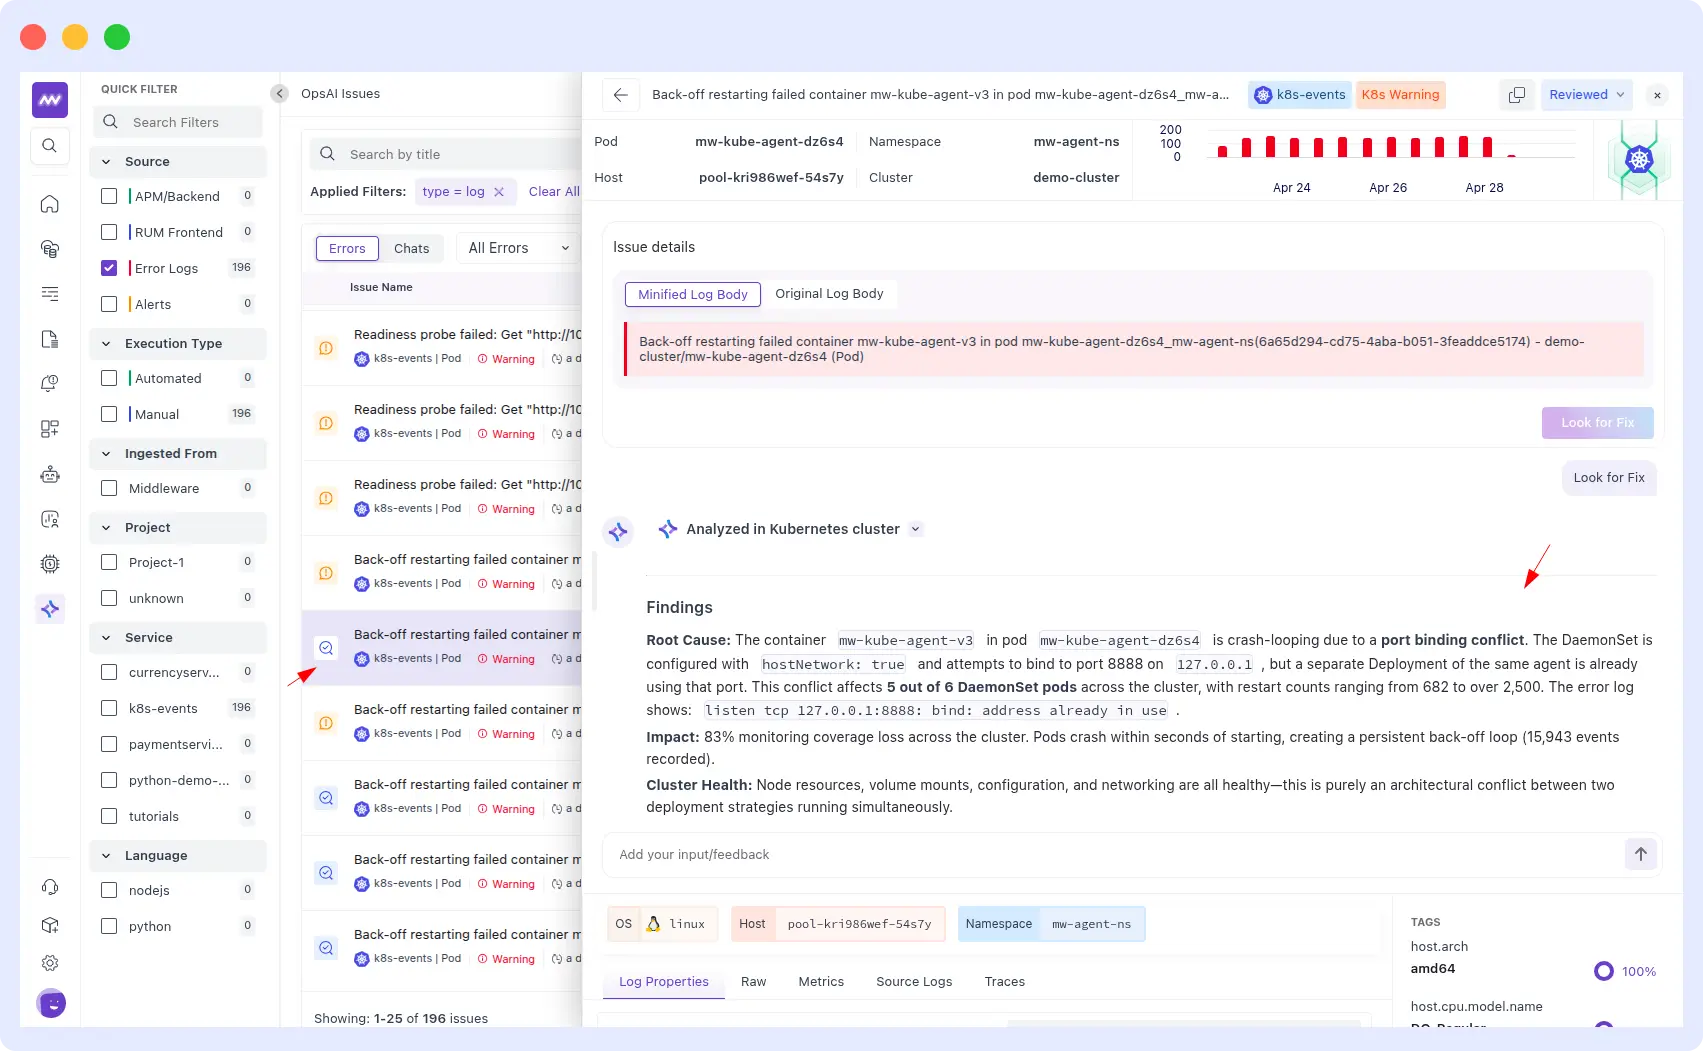
Example: a K8s Warning fired for container mw-kube-agent-v3 back-off restarting in pod mw-kube-agent-dz6s4 across the mw-agent-ns namespace on the demo-cluster.
OpsAI analyzed the cluster and identified the root cause: a port binding conflict. The DaemonSet was configured with hostNetwork: true and was trying to bind to port 8888 on 127.0.0.1, but a separate Deployment of the same agent already held that port.
The conflict hit 5 out of 6 DaemonSet pods, with restart counts ranging from 682 to over 2,500 and 15,943 events recorded, resulting in an 83% loss of monitoring coverage across the cluster. Total diagnosis time: under 3 minutes.
3. Fetching issues from Middleware alerts
When Middleware fires an alert, a latency spike, an error-rate breach, an infrastructure anomaly or an SLO burn, OpsAI doesn’t just acknowledge it.
- Pulls the alert payload, finds the affected service, reads the error stack, and correlates logs and metrics.
- Correlate the alert with active traces, recent deployments, and dependency health from your observability stack.
- Conducts root cause analysis to separate real regression from noise or known flaky signals.
- Generates a pull request with a clean diff when its confidence threshold is met.
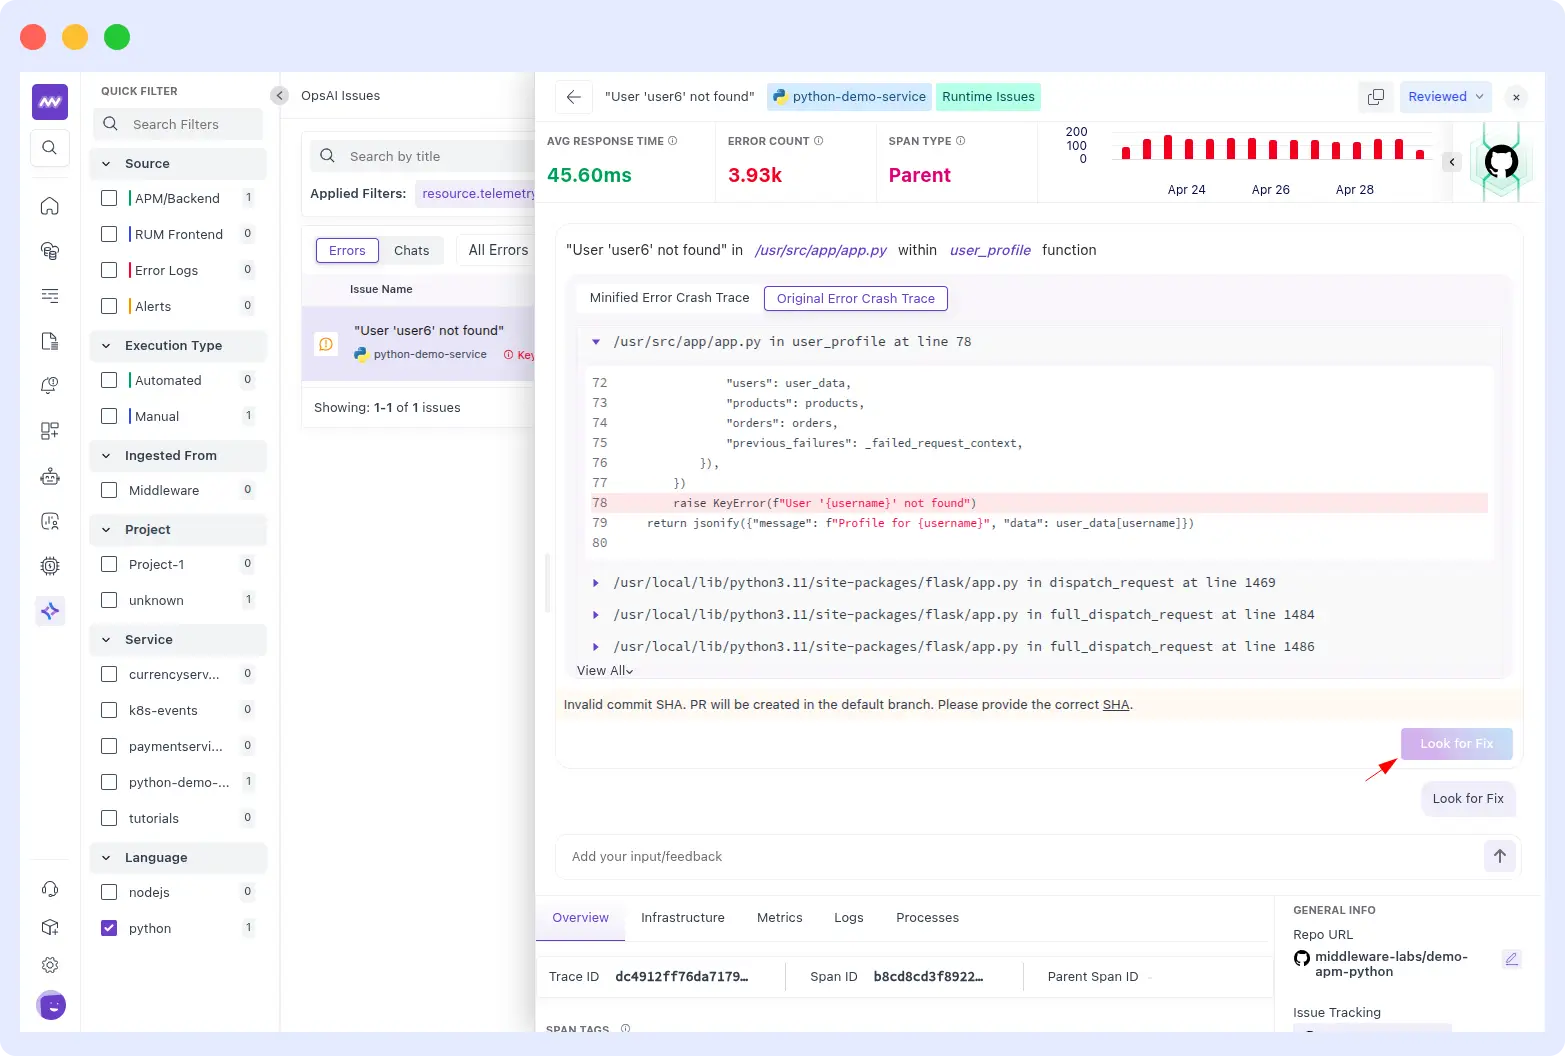
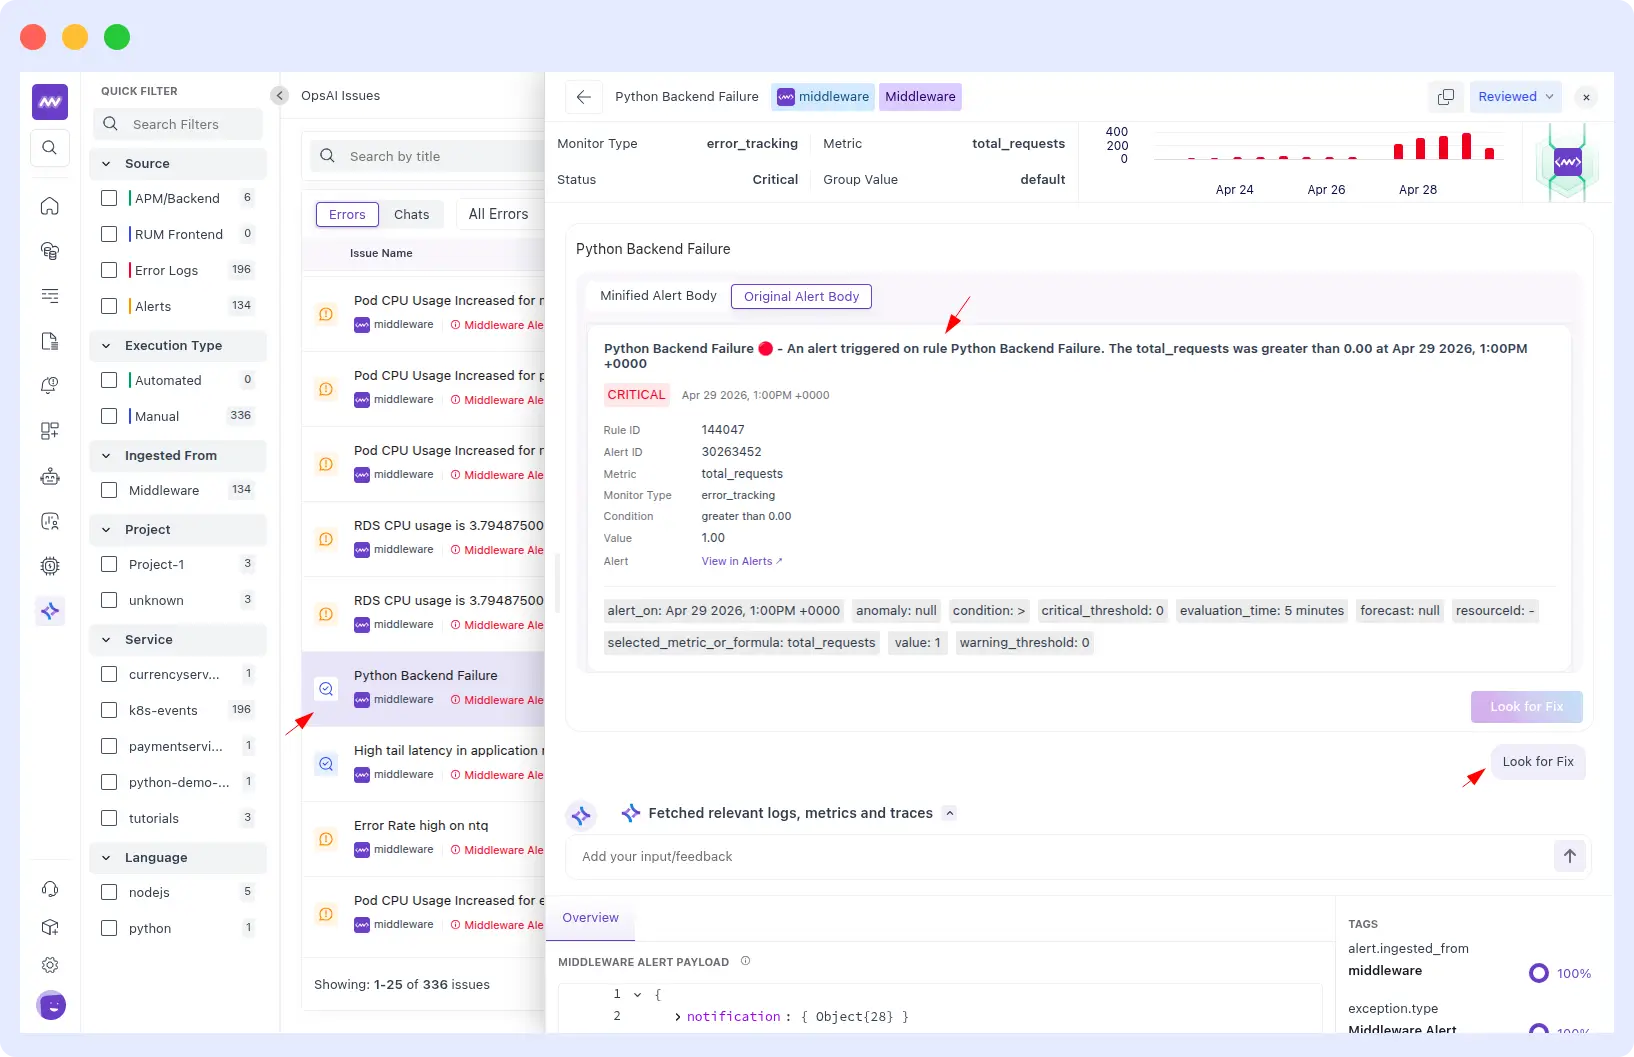
Example from a real customer run: A critical Middleware error_tracking alert fired on the python-demo-service Flask application Rule ID 144047, triggered at 1:00PM UTC on April 29, 2026, with total_requests condition breached and a 5-minute evaluation window.
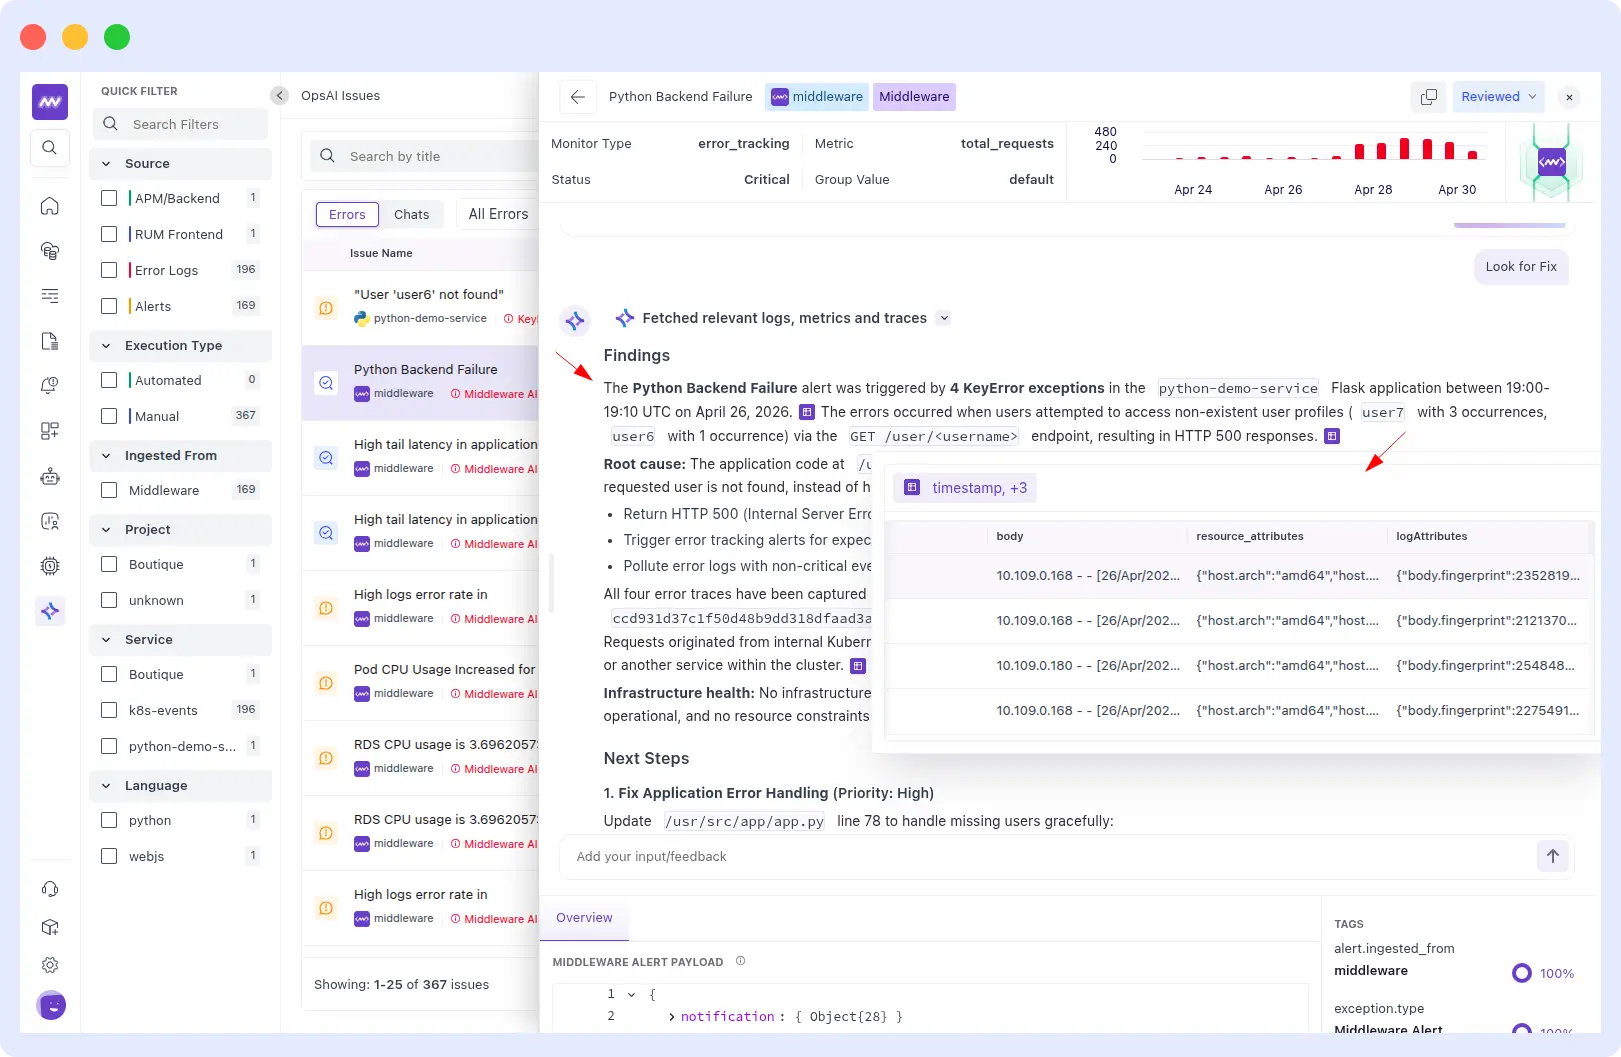
OpsAI immediately fetched the relevant logs, metrics, and traces and identified 4 KeyError exceptions on GET /user/<username>, returning HTTP 500s for non-existent users: user7 three times and user6 once.
The infrastructure was fully healthy. This was purely an application-level bug: unsafe dictionary access at line 78 of /usr/src/app/app.py.
OpsAI generated a prioritized fix plan:
- High: Patch error handling at /usr/src/app/app.py line 78 to handle missing users gracefully.
- Medium: Return a proper HTTP 404 instead of a 500 when a user is not found.
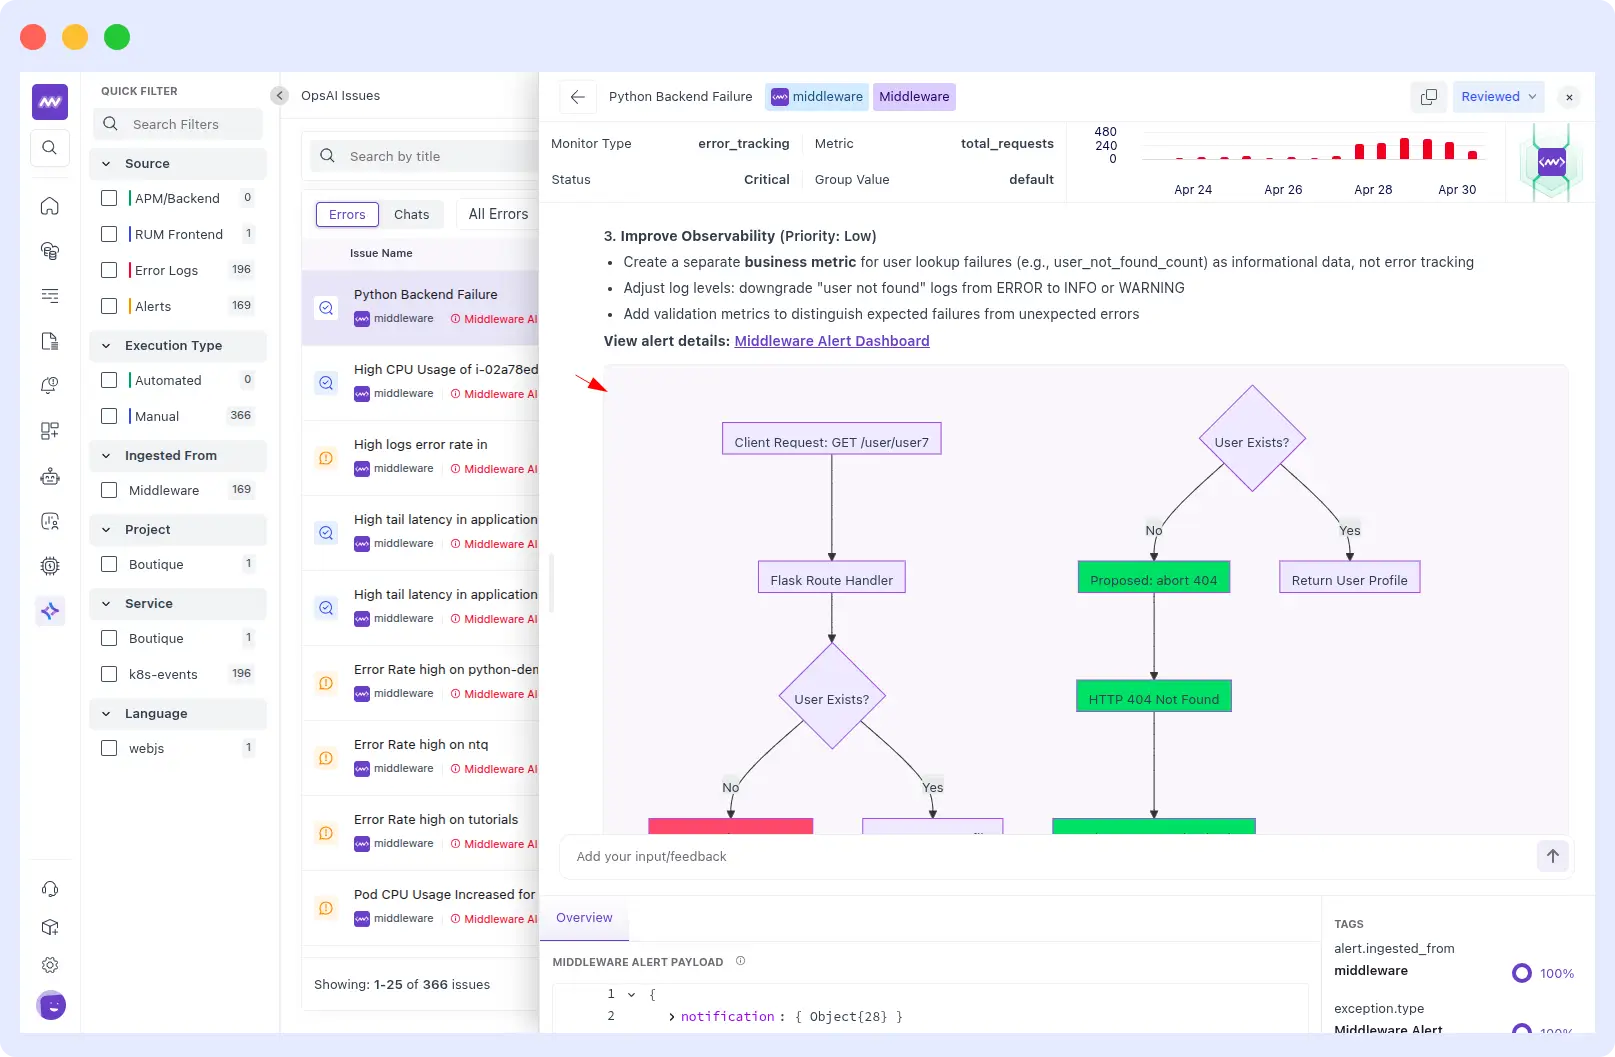
- Low: Create a separate business metric for user lookup failures — stop polluting error tracking with expected misses.
It also rendered a flow diagram showing the current crash path versus the proposed 404 response path.
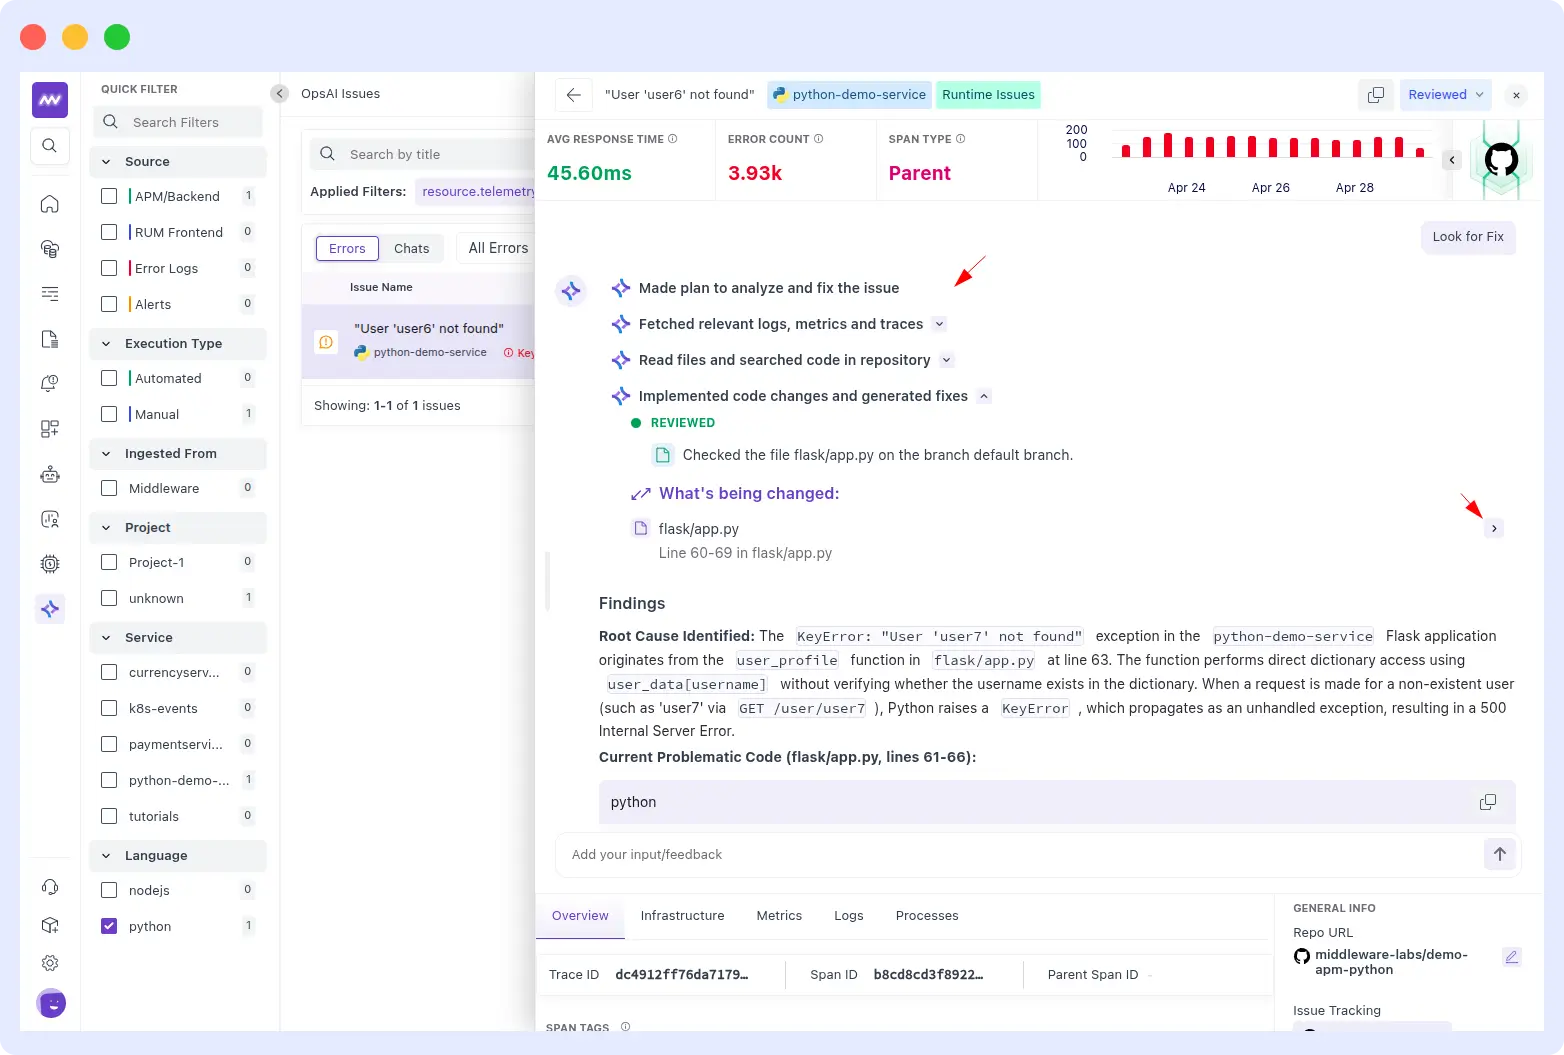
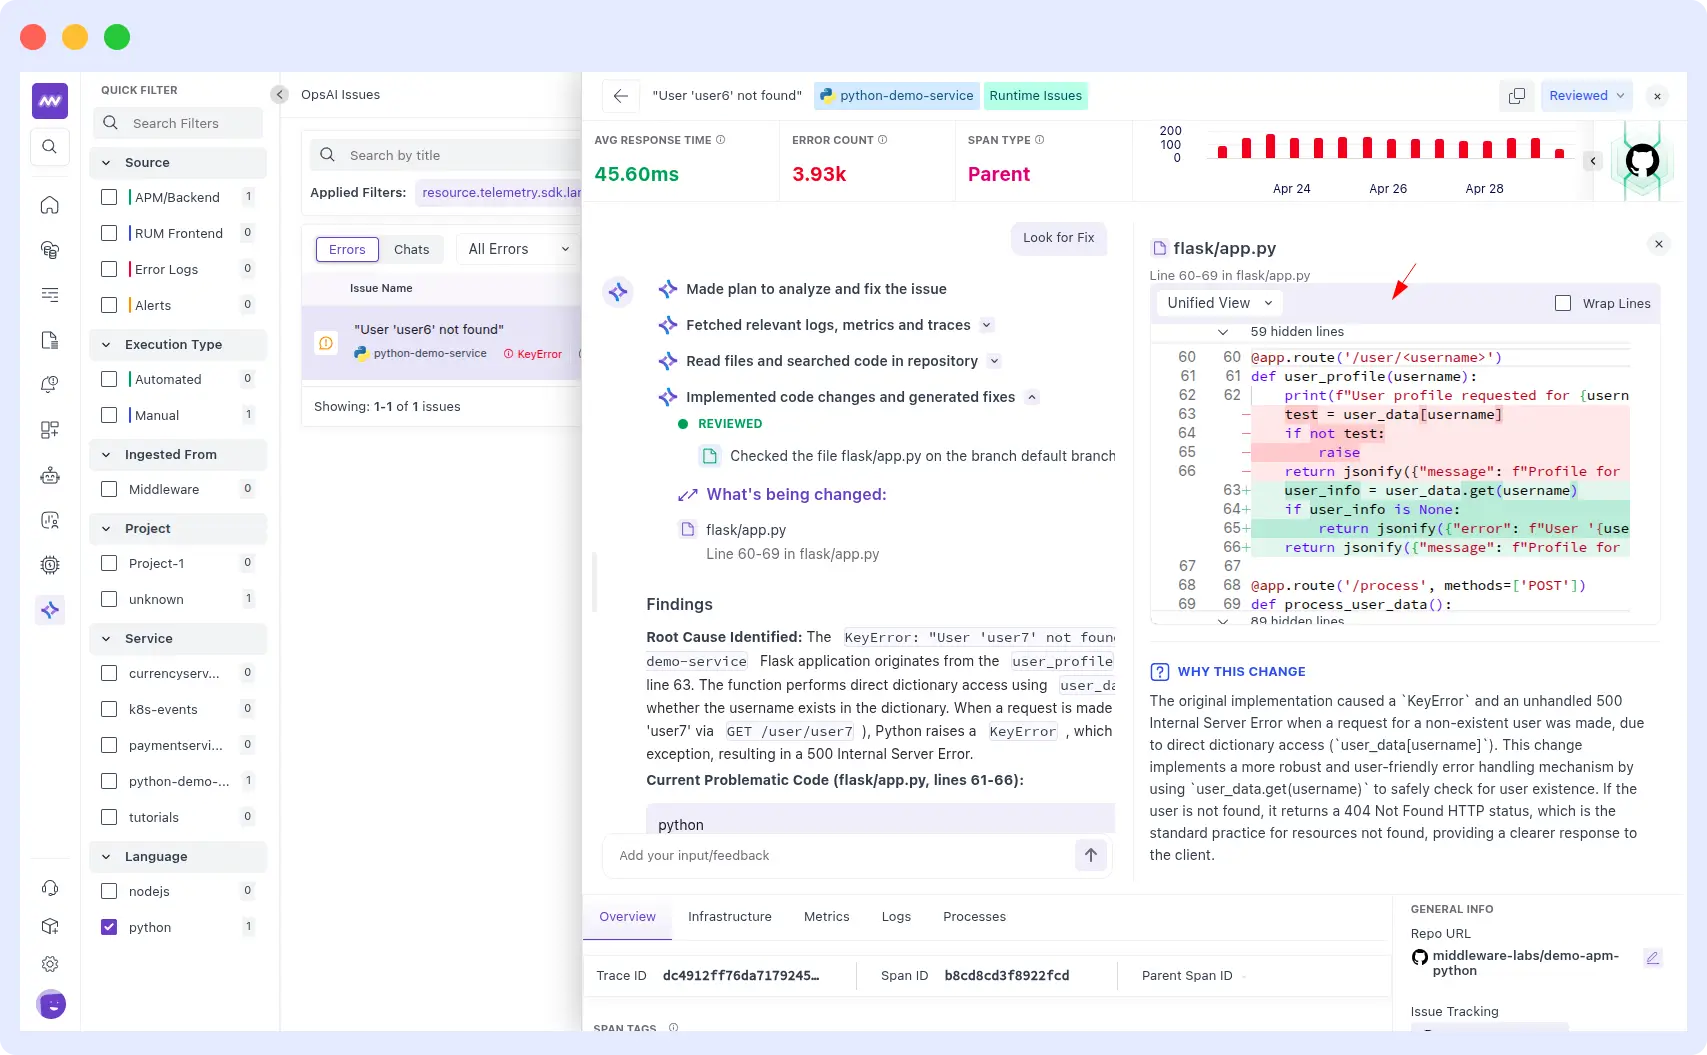
When asked to make the code changes on GitHub, OpsAI searched the repository for python-demo-service, located user_profile in flask/app.py, reviewed the file on the default branch, and applied a precise fix to lines 7–13.
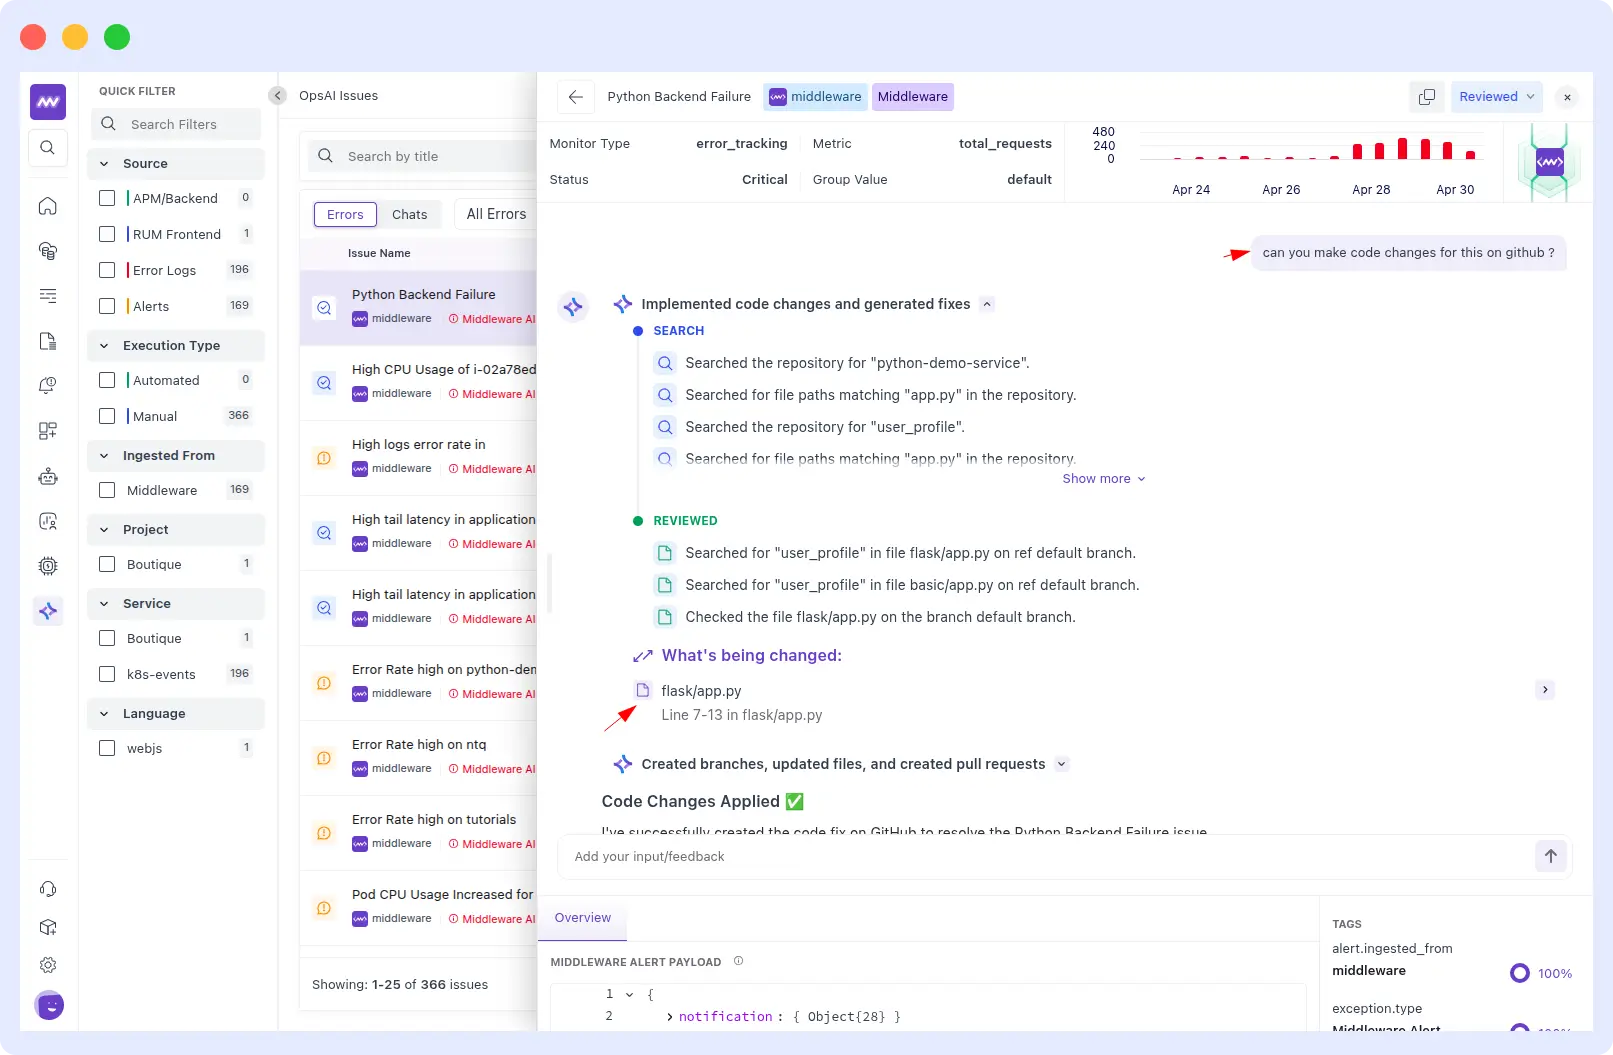
The diff tells the full story: the old code did a raw user_data[username] lookup, raising a KeyError and returning an HTTP 500 whenever a user didn’t exist.
The new code first checks whether the username is not in user_data and calls abort(404) with a clean error message, then safely retrieves the user. The redundant if-not test: raise block was removed entirely because it was unreachable given the structure of user_data.

4. Third-party alert ingestion (Datadog and Grafana)
This is the one that surprised our beta customers the most. OpsAI doesn’t require you to migrate off Datadog or Grafana to get value. It:
- Ingests alerts from both platforms.
- Pulls their metrics, logs, and traces via their APIs.
- Runs investigations inside the middleware using that data.
- Returns a structured RCA with recommendations.
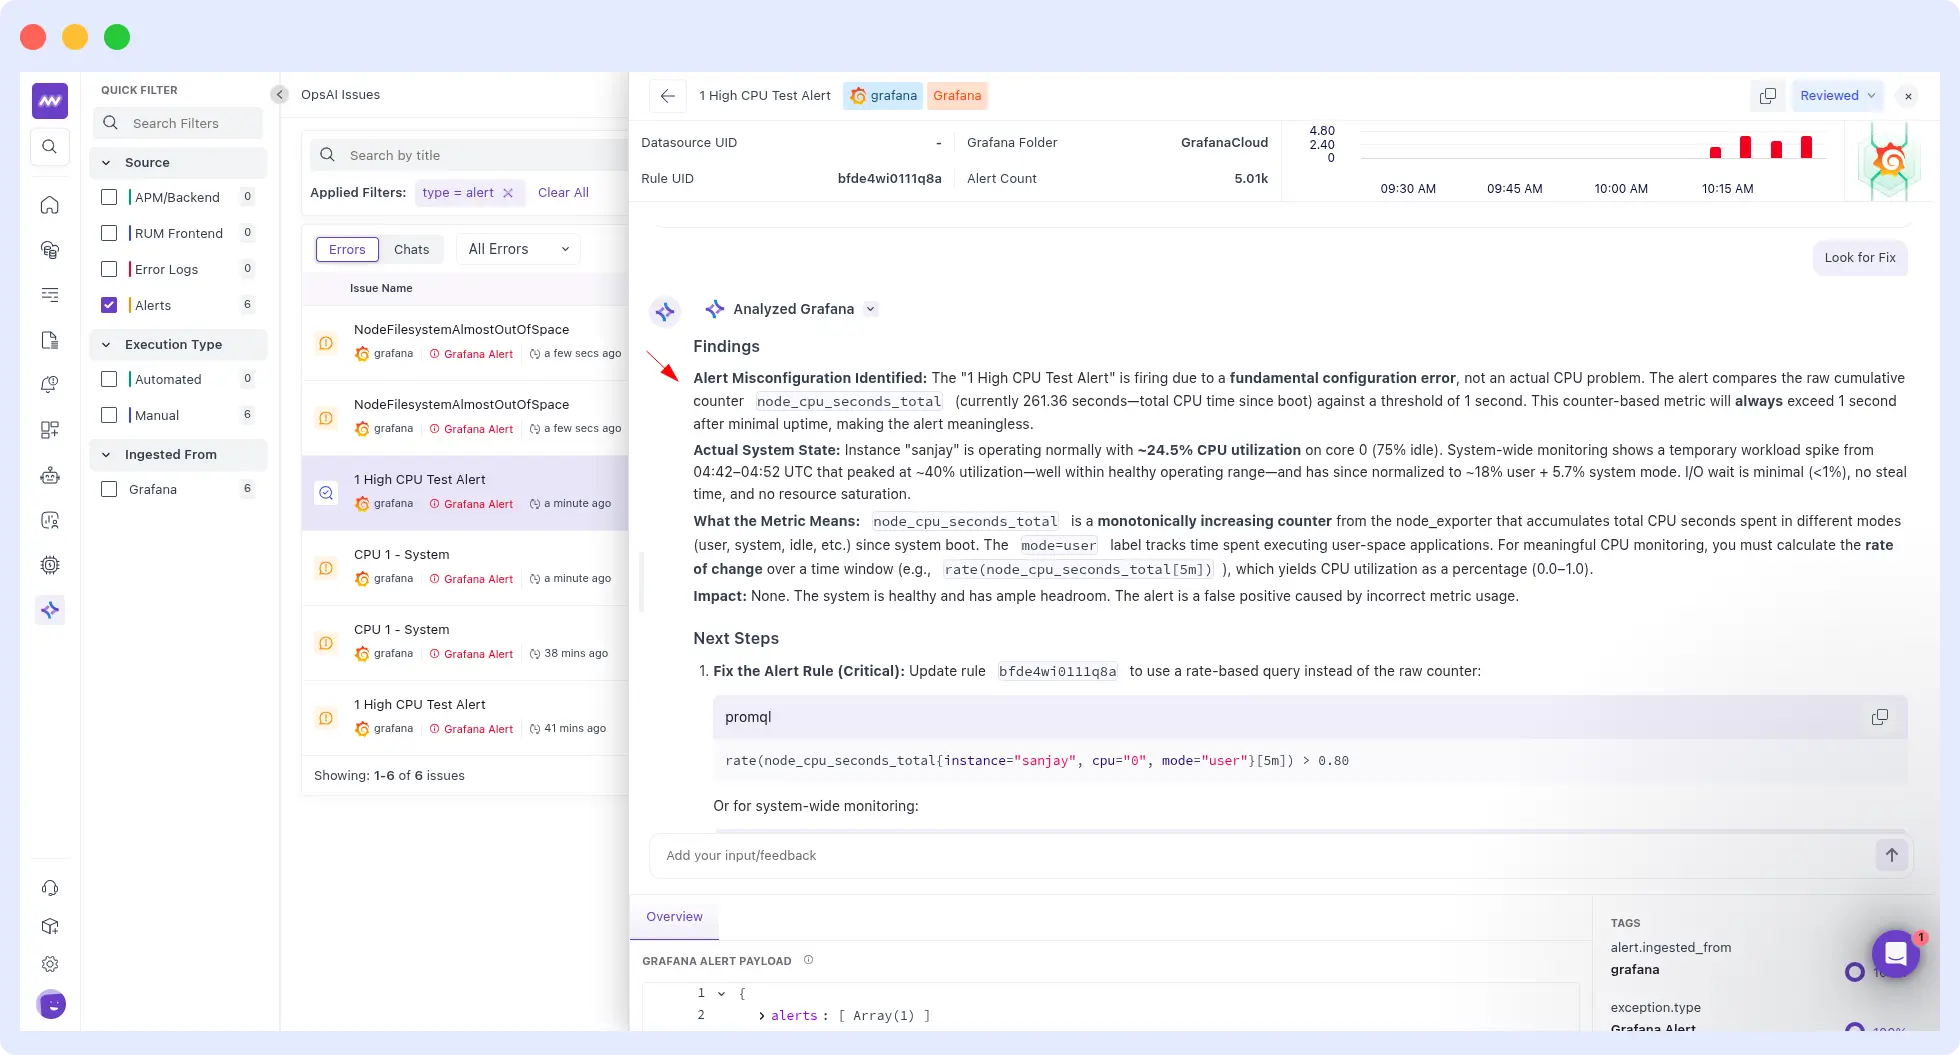
Example from a real customer run: A Grafana alert fired “1 High CPU Test Alert” with Rule UID bfde4wi011q8a, 5.01k alert count, targeting instance: sanjay, cpu: 0, job: integrations/node_exporter.
OpsAI ingested the full alert payload, listed available Grafana connections, provisioned alert rules and immediately ran a Prometheus range query on the node CPU metric to investigate.
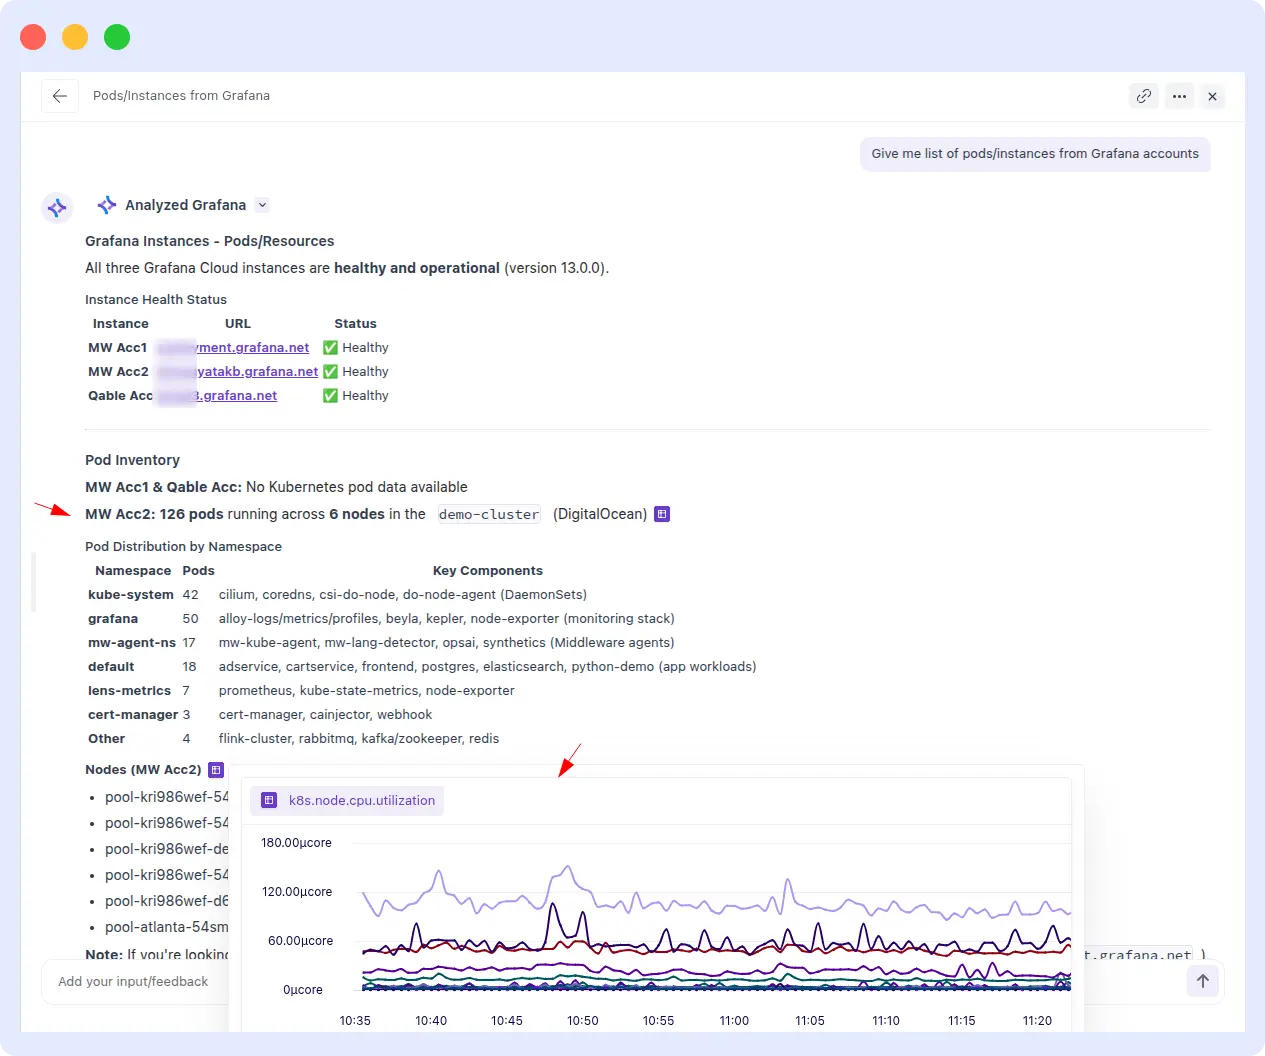
A customer then asked OpsAI to fetch the full list of pods and instances across their Grafana accounts. OpsAI connected to all three Grafana Cloud instances MW Acc1, MW Acc2, and Qable Acc, confirmed all healthy on version 13.0.0, and returned a complete pod inventory: 126 pods running across 6 nodes in the demo-cluster on DigitalOcean, broken down by namespace from kube-system and grafana to app workloads in default along with live k8s.node.cpu.utilization graphs per node.
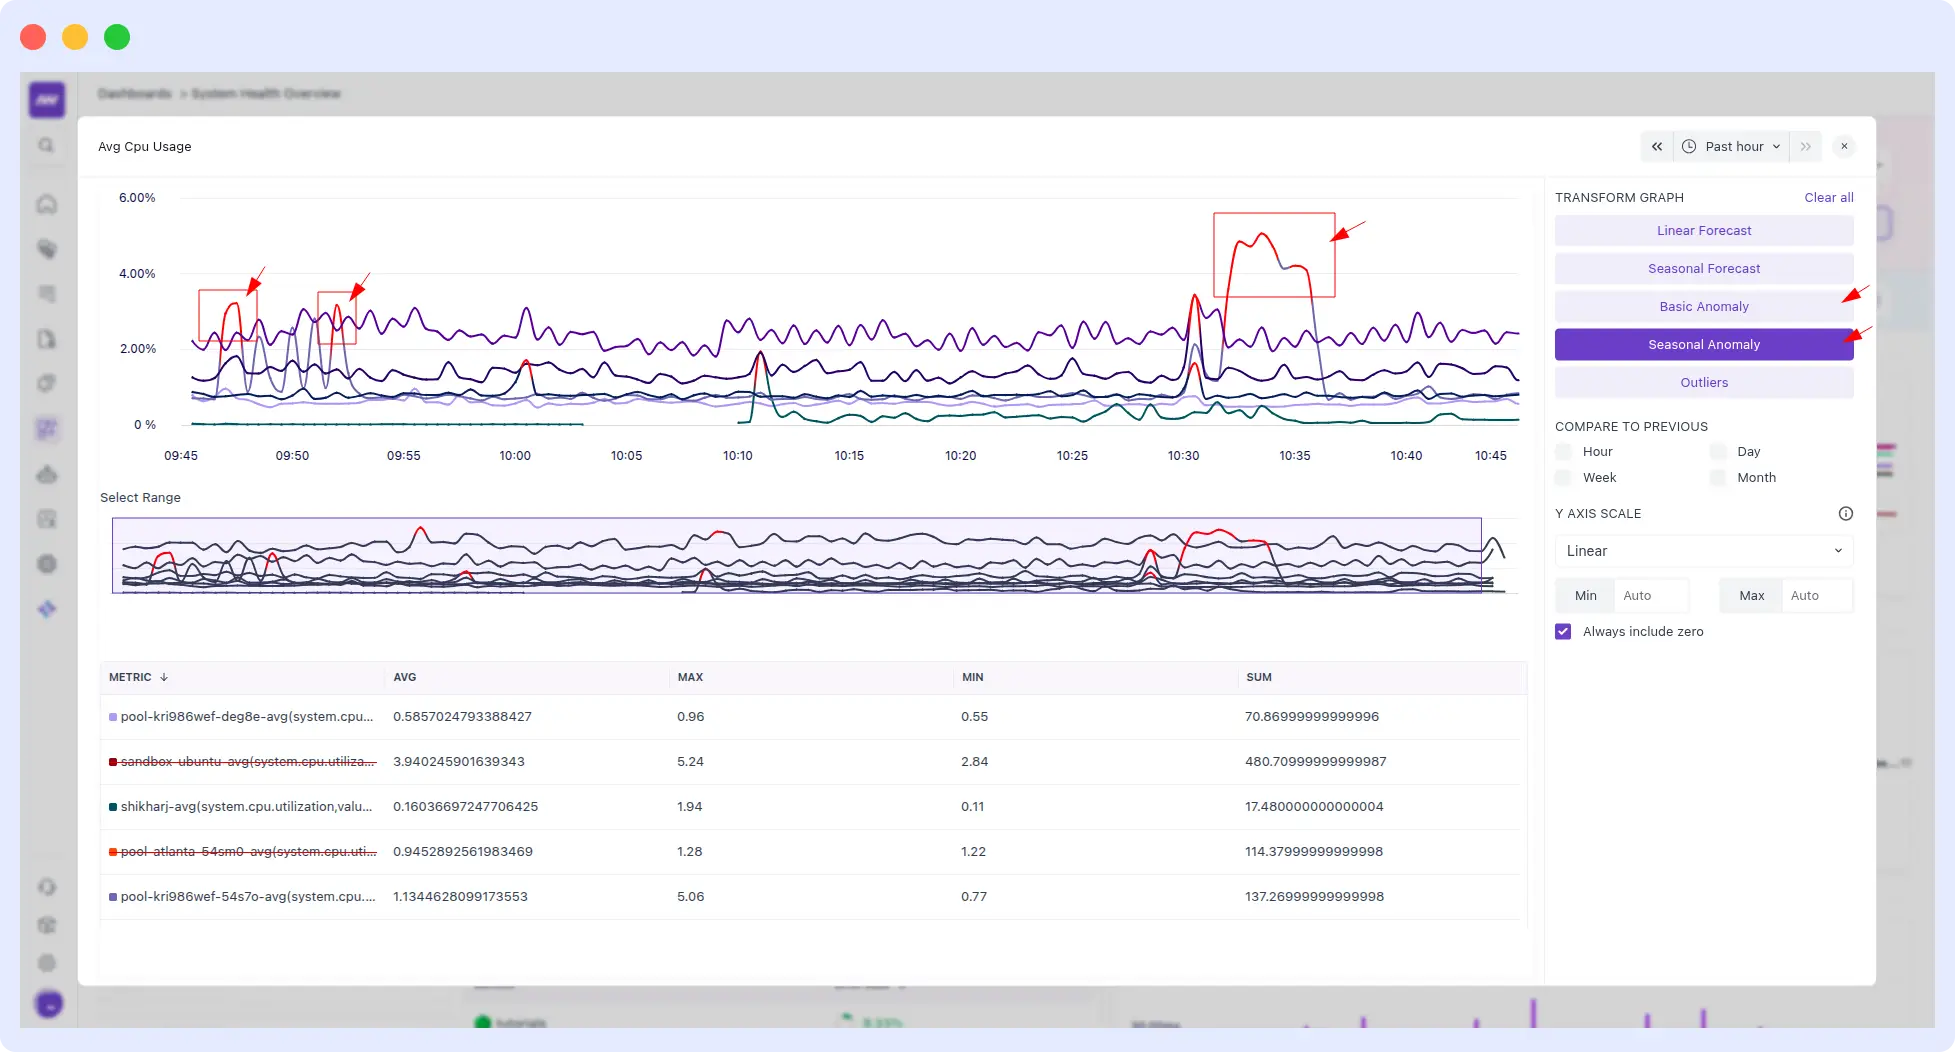
5. AI-powered anomaly detection
Built on top of Middleware’s full-stack data, OpsAI’s anomaly detection works across application performance, infrastructure metrics, and log streams. It learns your baseline, flags genuine deviations, and filters out the false positives that keep on-call engineers up at night.
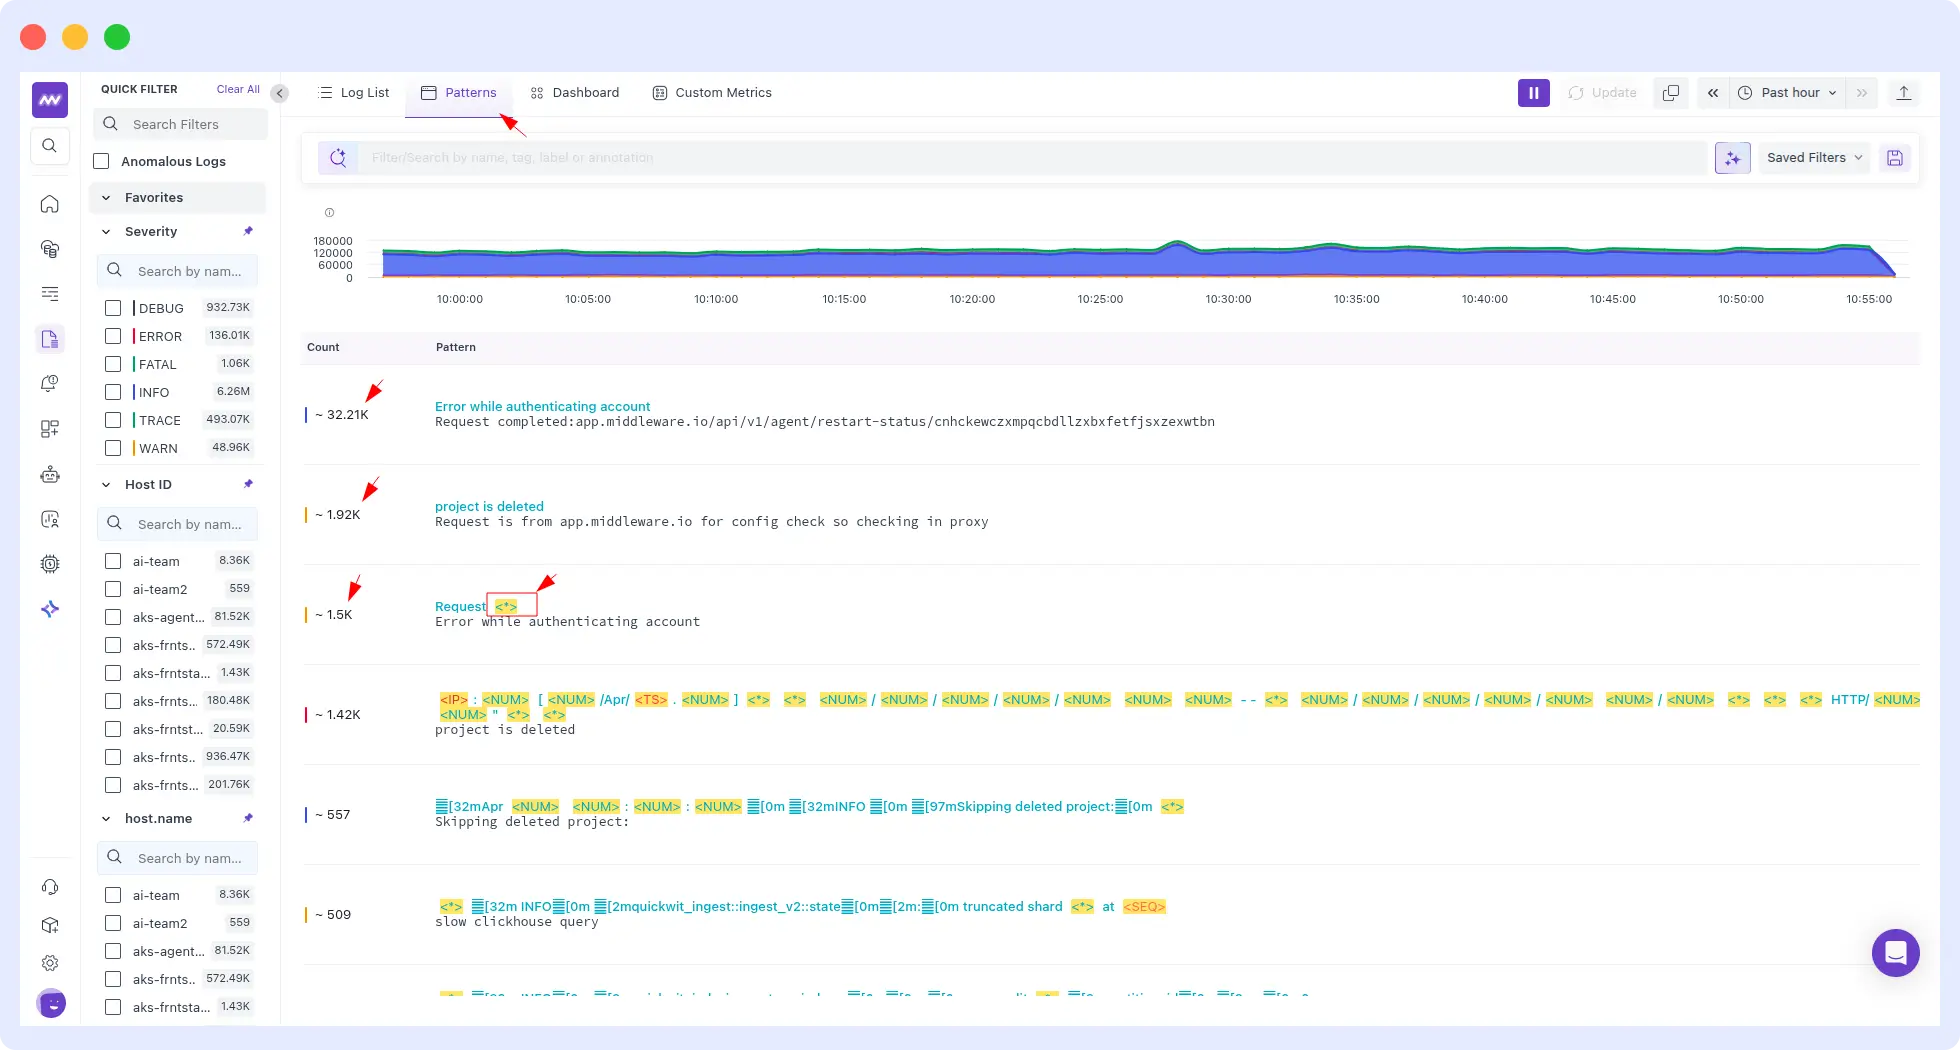
6. Log pattern analysis
OpsAI scans logs for recurring patterns, error spikes, authentication failures, latency clusters, and correlates them with application and infrastructure events. Instead of an engineer manually grepping through gigabytes of log lines, the OpsAI SRE agent surfaces the pattern and ties it to the suspect service, deployment, or commit.
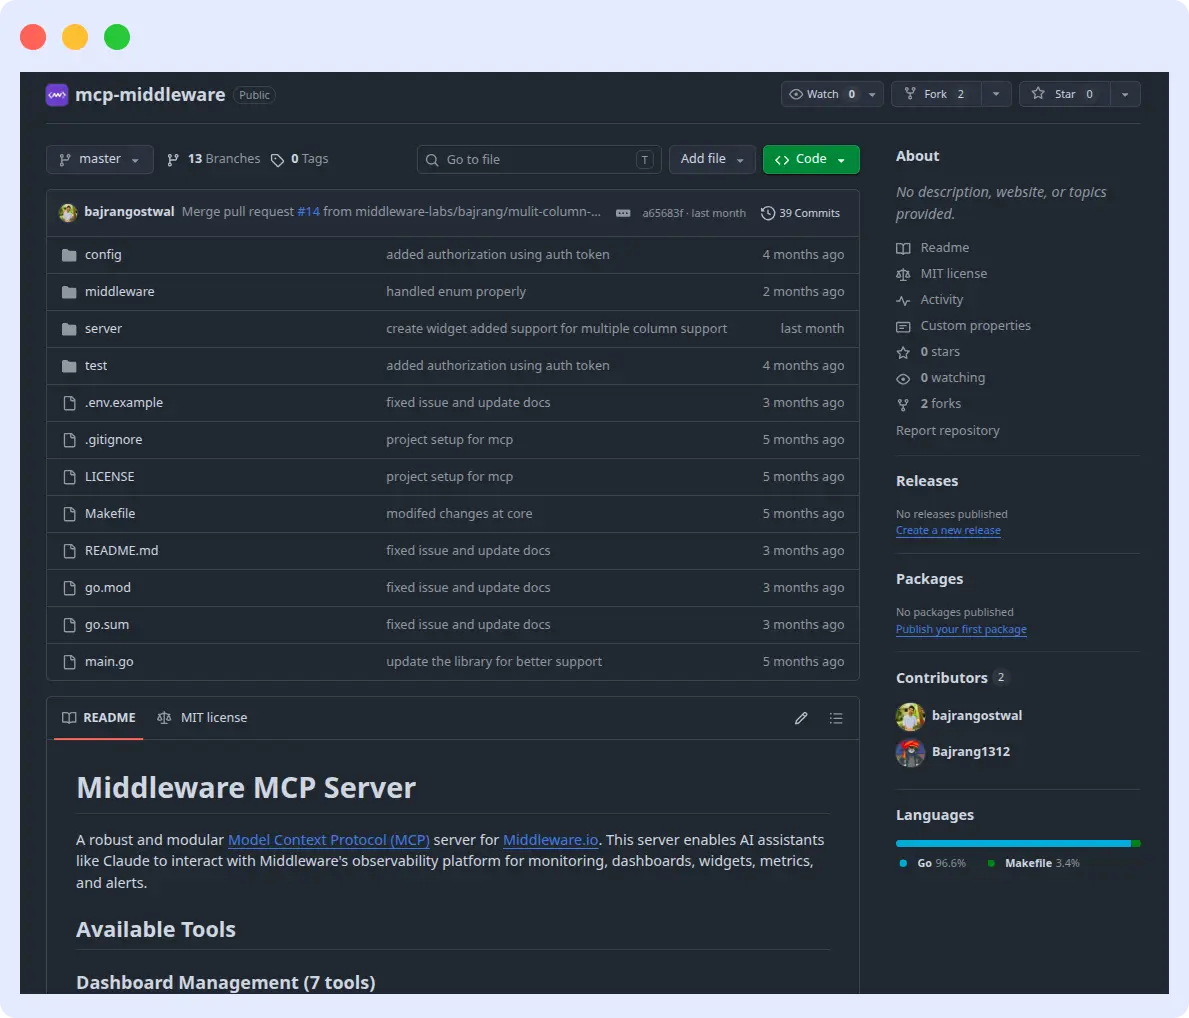
7. Code-aware investigation via GitHub MCP
This is where OpsAI differs from agents that only show “here’s a metric chart.” Once you connect your GitHub account via the Middleware MCP Server (a robust and modular Model Context Protocol (MCP) server that enables AI assistants to interact with Middleware’s full observability platform, including monitoring, dashboards, metrics, and alerts).
OpsAI SRE Agent can:
- Matches stack traces to exact files and line numbers.
- Inspects recent commits, dependency changes, and developer activity to build a “what changed” timeline.
- Reads only the files relevant to the specific error, never your full codebase.
- Stores nothing. Your source code stays in your repo.
8. End-to-end resolution
The thing that separates OpsAI from “AI summarization on top of a dashboard” is that it goes from detection → root cause → remediation → merged code in one loop. For Kubernetes, that’s an applied fix. For the application code, that’s a reviewable PR. For alerts, that’s a tuned threshold recommendation backed by historical data.
Key findings from our beta and internal use
We didn’t ship OpsAI based on lab benchmarks. We’ve been running it on Middleware’s own production stack and a select group of design-partner customers for months.
Here’s what we’ve measured:
- >50% of Middleware’s own production issues are resolved automatically. OpsAI is on-call alongside our engineers, and most days, it handles incidents before a human ever sees the page.
- >70% detection-to-resolution rate across customer beta accounts.
- 5× reduction in MTTR (Mean Time To Respond) on incidents OpsAI handles.
- 80%+ improvement in on-call developer productivity measured by the share of pages that reach a human versus those auto-resolved.
- OpsAI solves the issue with 75% accuracy
- 6×–10× faster than competing AI SRE agents on identical prompts in our head-to-head benchmark across Grafana, Datadog, APM, RUM, and Kubernetes scenarios. (Detailed methodology and per-scenario data are in our OpsAI vs Resolve AI benchmark.)
A note from our CEO
“Observability platforms have spent the last decade getting better at telling you something is wrong. The next decade is about systems that fix it for you. With OpsAI SRE Agent, we’re not building another dashboard or another alert channel — we’re building an SRE agent that lives inside your observability stack, reasons across your full telemetry, and ships actual code fixes when it’s confident. We’ve been running it on Middleware’s own production for months, and it now resolves more than half of our incidents automatically. In customer tests, the detection-to-resolution rate is north of 70%. This is what agentic observability should feel like: less firefighting, more building.”
Laduram Vishnoi, Founder & CEO, Middleware
What customers are saying
“Middleware resolved time spent on debugging and resolving issues by nearly 90%.”
Nico Laqua, CEO, Corgi Insurance
“Middleware has played a very good role in transforming our observability and application performance. For instance, we reduced our total observability costs by 50%.”
Bala Daggupati, Ace Turtle
How OpsAI compares to the rest of the AI SRE landscape
The AI SRE space has gotten crowded fast. Here’s an honest read of where OpsAI sits:
- OpsAI vs Resolve AI: Resolve is platform-agnostic and orchestrates across third-party tools. Strong if you want a vendor-neutral overlay; the trade-off is speed, accuracy, and depth of remediation, since every query has to go out over external APIs.
- OpsAI vs Datadog Bits AI: Bits is excellent inside Datadog’s ecosystem and shares OpsAI’s “own the data layer” philosophy. The trade-off is that Datadog only works with alerts at pricing and lock-in. If alerts are not fired, BitsAI won’t be able to detect issues. On the other side, OpsAI offers the same architectural advantage with OpenTelemetry-native flexibility, support for alerts, and the ability to detect issues directly from APM, Infrastructure, Kubernetes, and RUM, and it also supports usage-based pricing.
- OpsAI vs Deductive AI: Deductive AI is doing genuinely interesting work on reasoning under uncertainty using reinforcement learning. They’re focused primarily on root cause analysis. OpsAI covers the full loop, including code fixes and auto-remediation in Kubernetes.
- OpsAI vs New Relic SRE Agent: Strong if you’re already on New Relic. Same lock-in trade-off as Bits AI.
- OpsAI vs Observe o11y AI: Built into Observe’s platform; similar architectural pattern, narrower scope on remediation.
- OpsAI vs Lightrun AI SRE / Mezmo agentic SRE: Both are newer entrants with distinct strengths. OpsAI’s differentiator is the combination of full-stack observability ownership, GitHub MCP code awareness, and pull-request generation.
If you’re evaluating any of the above, we’d encourage you to actually run identical prompts against each. We did, and the results are public.
Getting started
OpsAI is generally available today for all Middleware customers, existing and new.
To enable it:
- For Kubernetes: install the Kube Agent with opsai.enabled=true.
- For application errors: install the APM/RUM agents and connect your GitHub repo. OpsAI starts working automatically.
- For Datadog/Grafana: connect those accounts in Middleware settings; OpsAI ingests alerts immediately.