Virtual machine (VM) monitoring tracks CPU, memory, disk, and network performance in real time, allowing infrastructure teams to detect and resolve issues before they affect users.
📖 New to infrastructure monitoring? Read our foundational guide → What Is Infrastructure Monitoring?
This guide covers how to deploy Middleware’s OpenTelemetry-based monitoring across VMs on AWS, Azure, and GCP, including agent setup, metric interpretation, alert configuration, and auto-scaling support.
What are the two approaches to VM monitoring in Middleware?
Middleware offers two monitoring methods: agent-based monitoring and cloud-native monitoring. Most production environments use both.
Agent-based monitoring installs the Middleware agent directly on each VM. The agent collects CPU utilization, memory usage, disk I/O, network traffic, individual process metrics, and both system and application logs. Applications instrumented with OpenTelemetry can also send custom metrics through the agent. Because the agent uses OpenTelemetry, data is vendor-neutral, and it can be sent to multiple destinations or exported for compliance without reformatting.
Agent-based monitoring is best for long-lived, critical VMs such as databases, application servers, and build machines, where process-level visibility is needed for troubleshooting.
Cloud-native monitoring connects Middleware to your cloud provider’s monitoring API, CloudWatch (AWS), Azure Monitor, or GCP Cloud Monitoring. No software installation is required. New instances appear in the dashboard automatically. The trade-off is limited data: only basic metrics (CPU percentage, network bytes, disk reads) are available. Process-level data and logs are not.
Cloud-native monitoring is best for ephemeral workloads, auto-scaling groups, spot instances, or environments where third-party software installation is restricted.
When to use both: Install agents on critical infrastructure (databases, core application servers). Use cloud-native integration for test environments, CI/CD runners, and auto-scaling groups. This gives deep visibility where it matters and broad coverage everywhere else.
Teams running container-based workloads alongside VMs can apply the same agent-vs-cloud-native logic to Kubernetes nodes and pods.
Ready to set up VM monitoring? Install the Middleware agent on your first VM in under 5 minutes. Start free →
How do you deploy the Middleware agent across multiple VMs?
Installing on a single VM is covered in our Linux monitoring guide and Windows monitoring guide. For fleets of 50 or more VMs, manual installation is impractical. Use configuration management tools or infrastructure-as-code to automate deployment.
Using Ansible
If you already run Ansible, Puppet, or Chef, add the Middleware agent install to your playbooks. Ansible task for Debian/Ubuntu systems:
- name: Install Middleware agent
  shell: |
    MW_API_KEY="{{ middleware_api_key }}" \
    MW_TARGET="{{ middleware_target }}" \
    MW_HOST_TAGS="env:{{ environment }},team:{{ team_name }}" \
    bash -c "$(curl -L https://install.middleware.io/scripts/deb-install.sh)"
For RHEL/CentOS/Amazon Linux, replace `deb-install.sh` with `rpm-install.sh`.
Run this across your inventory, and every VM gets the agent. Store your API key and target URL as Ansible variables, not in the playbook.
Using Terraform
Add the agent install to the user_data block of your launch template. Every new VM will boot with monitoring already running.
AWS EC2 example:
resource "aws_launch_template" "app_server" {
  name          = "app-server-template"
  image_id      = "ami-12345678"
  instance_type = "t3.medium"

  user_data = base64encode(<<-EOF
    #!/bin/bash
    MW_API_KEY="${var.middleware_api_key}" \
    MW_TARGET="${var.middleware_target}" \
    MW_HOST_TAGS="env:production,service:api" \
    bash -c "$(curl -L https://install.middleware.io/scripts/rpm-install.sh)"
  EOF
  )
}
For the full list of supported operating systems, agent flags, and configuration options, see the Middleware agent installation docs →
This works for Azure VM Scale Sets and GCP Instance Templates too. Add the installation command to the startup script.
For a deeper look at Windows-specific metrics and performance counters, see our guide to Windows performance monitoring.
How do you monitor VMs in auto-scaling groups?
Auto-scaling groups create and terminate instances automatically. Monitoring must start at boot, not after manual SSH access.
Option 1 — User data scripts
Add the Middleware install command to your AWS launch template, Azure VM Scale Set startup script, or GCP Instance Template. The agent installs on first boot and begins sending metrics immediately. Tag each instance with env:production, asg:web-tier, and team:platform So you can filter auto-scaled instances in the dashboard.
Option 2 — Cloud-native auto-discovery
Connect Middleware to your cloud provider’s API. New instances appear in the dashboard within minutes of booting.
Go to Integrations → AWS/Azure/GCP, add credentials, and Middleware polls the cloud API automatically. For a full walkthrough of AWS monitoring with Middleware, including CloudWatch integration, see our dedicated guide.
This provides basic fleet visibility (instance counts, CPU, memory, network) without any deployment work.
Why VM tagging matters
Tags let you filter and group instances in the Middleware dashboard regardless of which specific VMs are currently running. Use consistent tags across your fleet:
- `env`: production, staging, development
- `asg` or `service`: the auto-scaling group or service name
- `team`: which team owns this infrastructure
- `region`: for multi-region setups
Middleware’s free tier retains metrics for 14 days. The pay-as-you-go pricing plan retains metrics for 30 days. Enterprise contracts offer extended retention.
What VM metrics should you monitor?
When monitoring VMs, key metrics to track include CPU, memory, disk I/O, and network performance. What actually matters when you’re troubleshooting:
CPU: utilization vs. steal time
CPU utilization percentage shows how busy your processors are, but a high CPU utilization alone does not indicate a problem. On cloud VMs, the more important metric is CPU steal time, the percentage of time the hypervisor is allocating your VM’s CPU cycles to other tenants. A VM showing 60% CPU utilization but high steal time will exhibit degraded performance despite appearing to have available capacity.
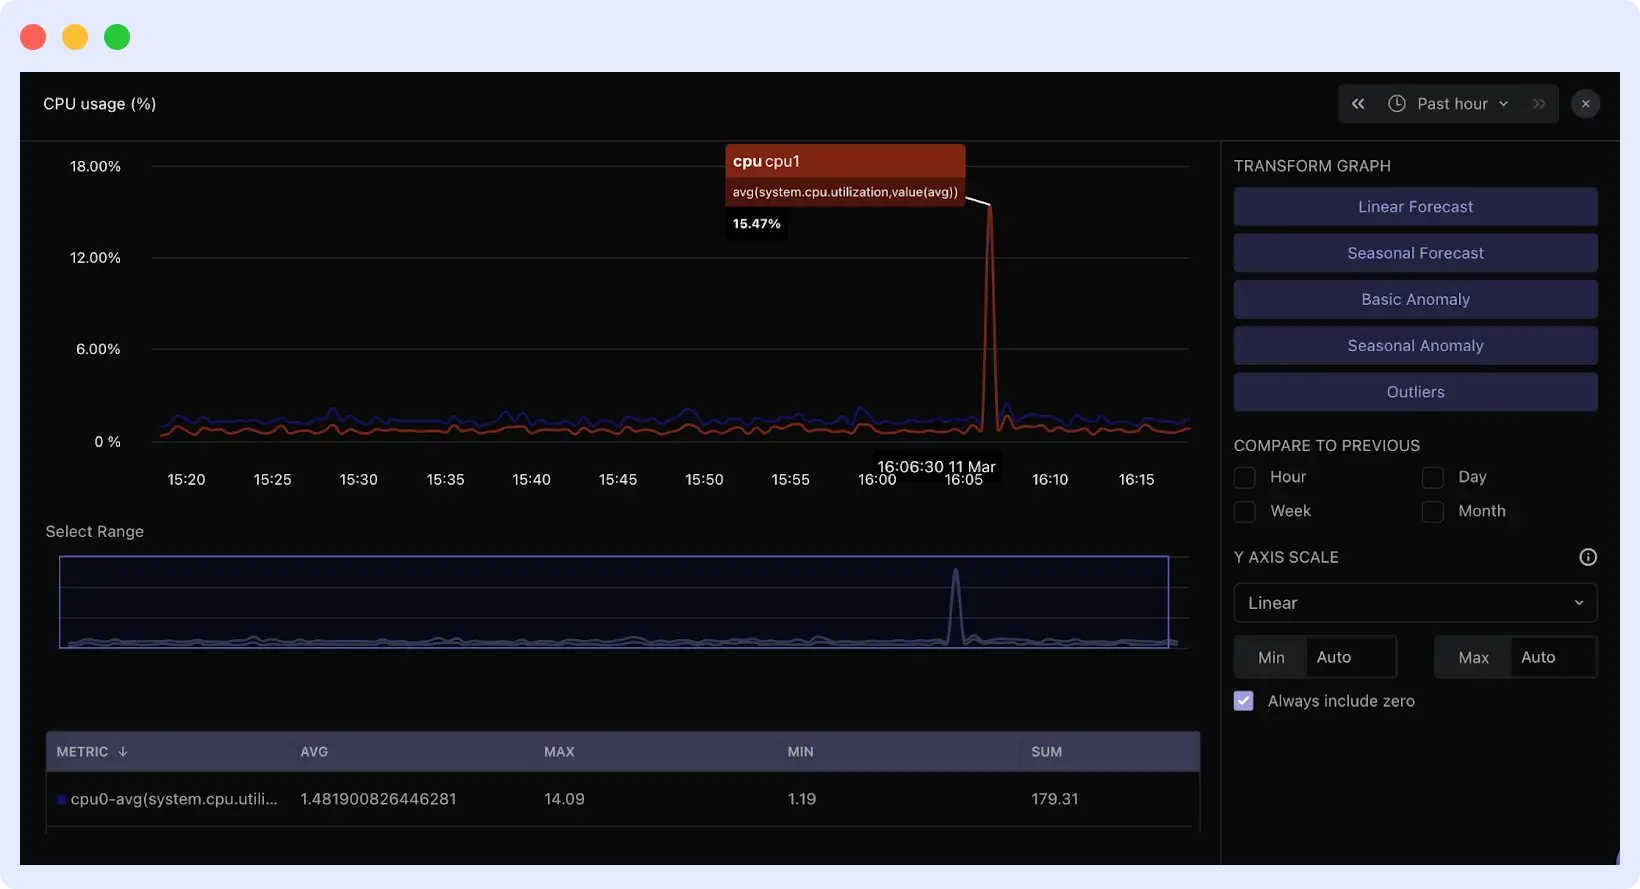
In the Middleware dashboard, CPU and steal time graphs appear side by side. Clicking any spike shows which application traces were slow at that exact moment. Middleware includes anomaly detection to automatically flag unusual CPU patterns.
On Linux VMs, also monitor the load average. If load average exceeds your core count while CPU utilization is moderate (50–60%), the system has an I/O bottleneck, not a CPU bottleneck. Processes are waiting on disk or the network. Middleware’s process view sorts by wait state to identify blocked processes.
For a deeper guide on diagnosing and resolving high CPU conditions, see our article on CPU steal time and load average on Linux.
Memory: swap activity over percentages
High memory usage percentage is not a reliable alert signal. Operating systems use available memory for file caching, which can be reclaimed instantly. 90% memory usage with low swap activity is normal.
Monitor swap usage over time instead. A steady increase in swap usage over hours or days indicates a memory leak; a process is consuming memory without releasing it. In Middleware, the swap graph clearly shows the trend.
Swap thrashing is a more severe condition: available memory drops below 5%, disk I/O spikes, and the system continuously pages memory in and out. Go to Processes in Middleware and sort by memory usage to identify the leaking process. Check its uptime and memory growth rate.
Disk I/O: latency and queue depth
Throughput (MB/s) does not indicate whether storage is keeping up with demand. The relevant metrics are I/O latency and queue depth.
- Latency consistently above 10ms indicates slow storage.
- Latency above 50ms causes application timeouts.
- Queue depth above 2 per physical disk means operations are queuing faster than they are being served.
When high disk latency appears alongside normal CPU and storage, storage is the bottleneck. High disk latency alongside high CPU usage usually indicates a broader system problem.
Network: packet loss and connection states
Even 0.1% sustained packet loss degrades TCP performance significantly, because TCP must retransmit dropped packets. Middleware tracks packet loss and NIC errors on the network metrics page.
For web servers and databases, monitor connection states in the process view. Connections accumulating in TIME_WAIT or CLOSE_WAIT indicate improper connection handling or exhausted connection pools. Sort by open connections to find the source.
Want to see these metrics live? Explore the Middleware infrastructure dashboard →
Where do you find VM metrics in Middleware?
Go to Infrastructure → Hosts and click a hostname to open its metrics view. The Metrics tab shows CPU, memory, disk, and network graphs. Use the time range selector to examine metrics during a past incident.
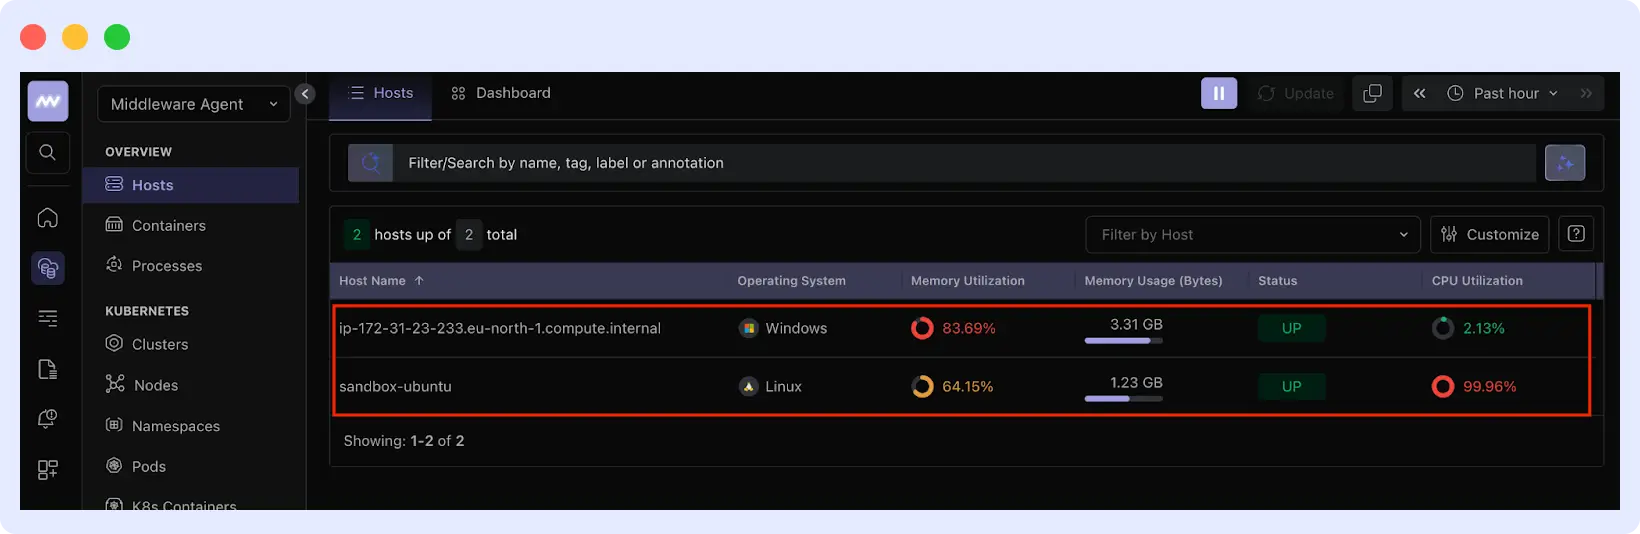
Use the filter bar to narrow by tag. Typing env:production shows only production VMs. Typing service:api shows only API servers.
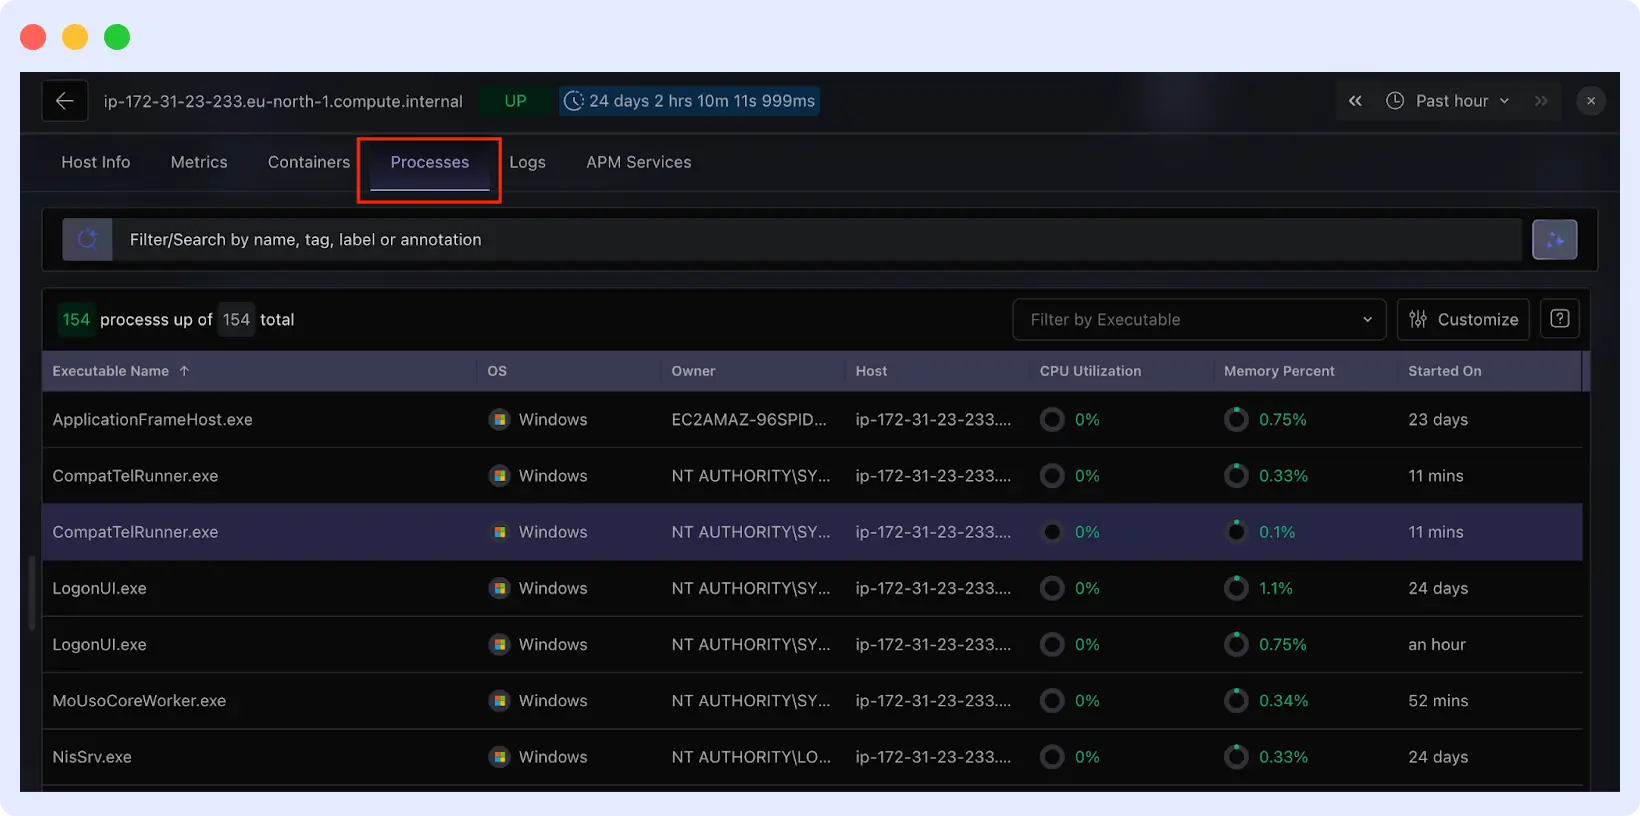
The Processes tab shows per-process resource usage. Sort by CPU or memory to identify what is consuming resources. Each process shows its full command line so you can distinguish your application, system services, or unexpected processes.
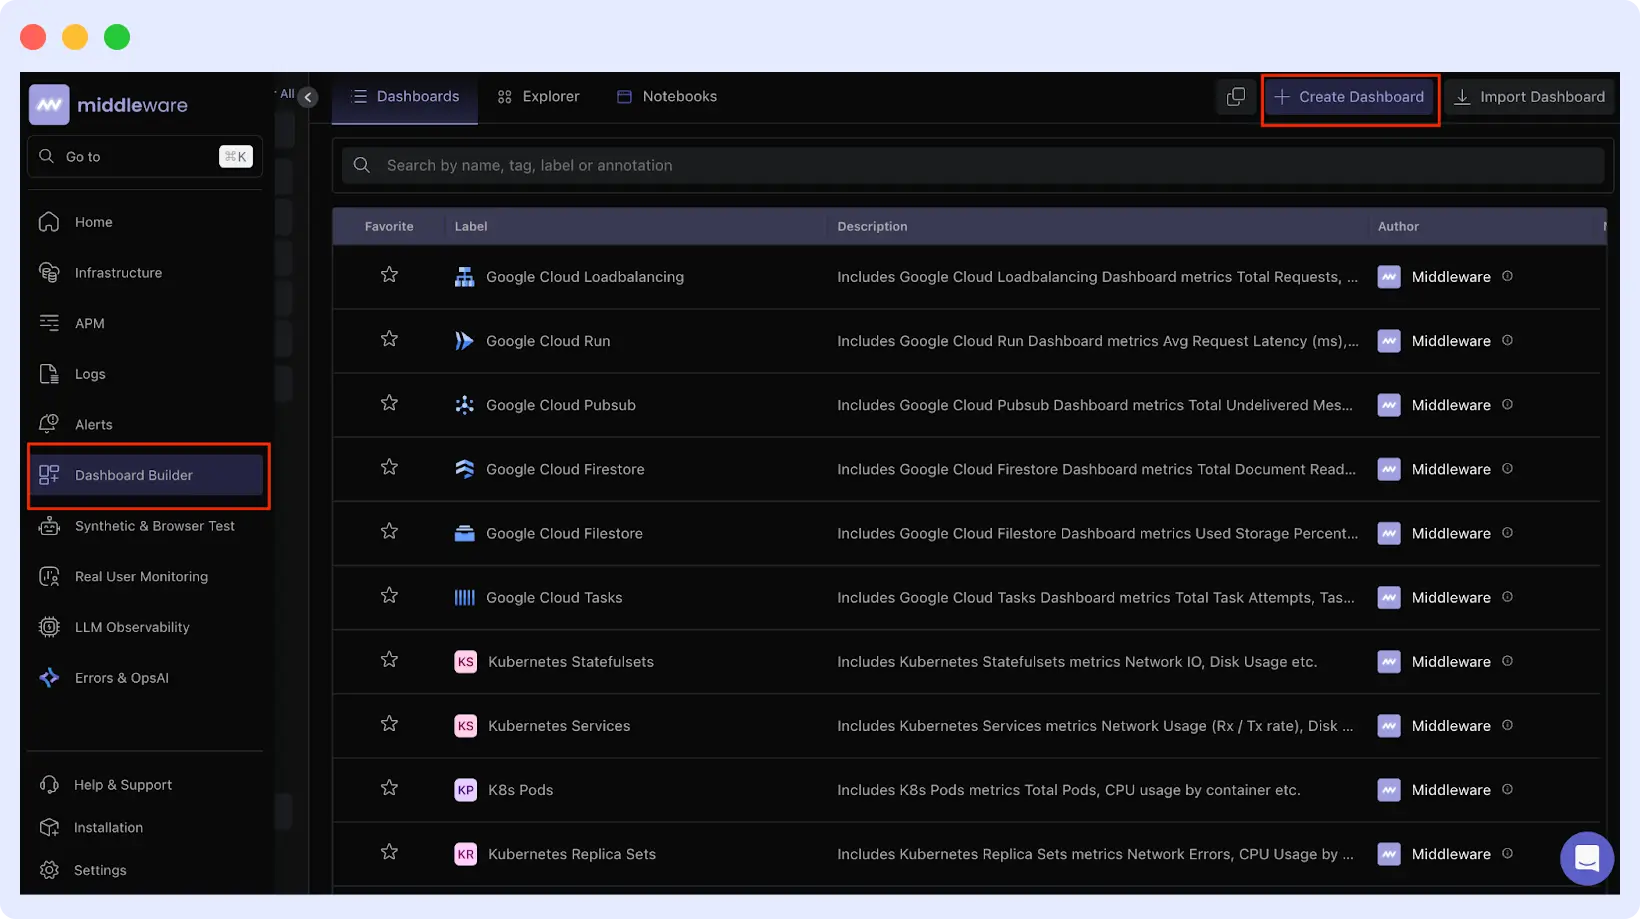
For custom views, go to Dashboard Builder → Create Dashboard and add widgets for the metrics your team monitors most frequently.
How does Middleware correlate metrics, logs, and traces?
Middleware displays metrics, logs, and traces on a unified timeline. Clicking any spike on a metric graph jumps the timeline to that moment and surfaces logs and application traces from the same time window.
For example: CPU spikes on a VM. Clicking the spike shows database traces that degraded from 200ms to 8 seconds at the same time. Logs show a deployment two minutes earlier. All three signals appear on one screen without switching tools.
This correlation also works across multiple VMs. Filtering by environment and service can reveal that a memory spike on one host caused slow application performance across the fleet, a pattern that would not be visible when inspecting VMs individually.
How do you configure alerts that avoid alert fatigue?
Alert fatigue occurs when thresholds are set too low, producing frequent false positives that teams learn to ignore. Two practices prevent this:
Use time windows, not instantaneous thresholds. A CPU spike lasting 10 seconds is normal. A CPU held above 85% for 5 minutes is a problem. Set thresholds based on what actually causes incidents in your environment, not arbitrary round numbers.
Set thresholds relative to baseline. If a database typically runs at 60% CPU, alerting at 70% creates noise. Alert at 85% sustained, which represents a meaningful deviation.
To configure alerts in Middleware: Go to Alerts → Add New Rule. Choose Host alerts (for when a server stops reporting) or Metrics alerts (for threshold-based conditions). Set the threshold, time window, and notification channels.
For step-by-step alert configuration with screenshots, see the Middleware alerting setup guide →
How do you troubleshoot missing or delayed metrics?
If you encounter missing metrics, common issues often involve agent startup failures, network connectivity, or configuration problems.
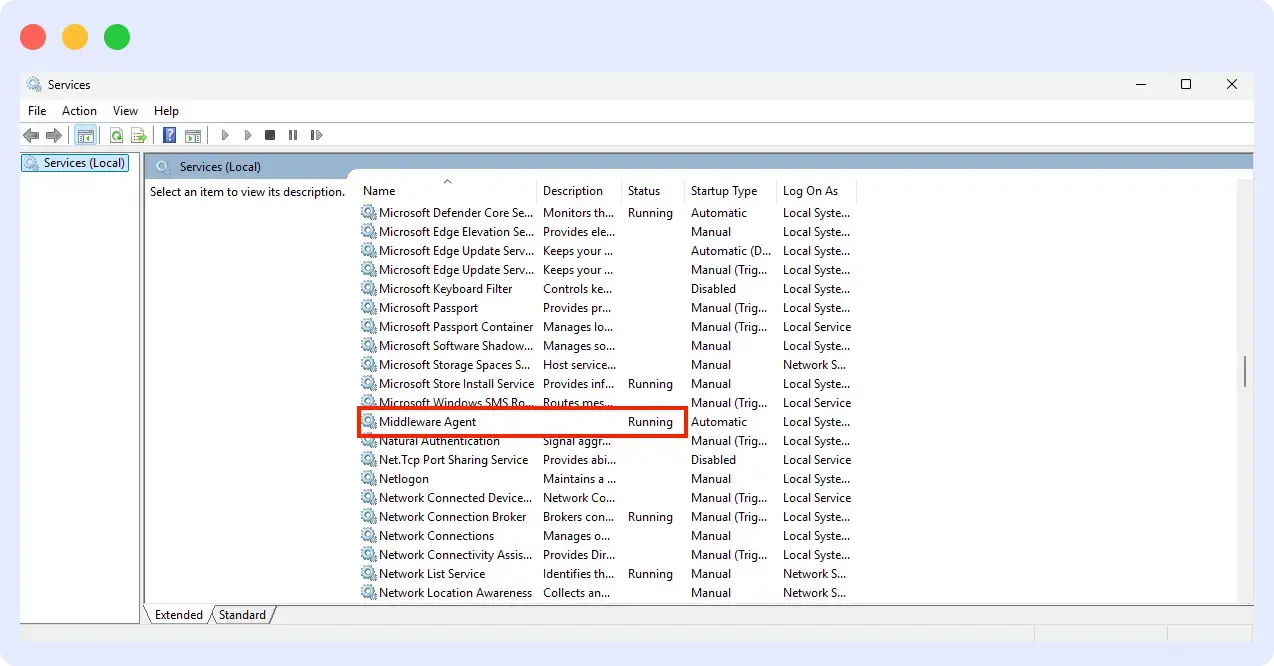
Agent not starting: Run systemctl status mw-agent on Linux, or check Services on Windows for “Middleware Agent.”
Review logs at /var/log/mw-agent/ (Linux) or Event Viewer → Application (Windows).
Common causes: incorrect API key, wrong target URL, or insufficient permissions.
Metrics delayed or incomplete: Check that outbound traffic to Middleware on port 443 is allowed. Test connectivity from the VM to your target URL. Timeouts indicate a firewall or security group is blocking traffic.
High agent resource usage: This typically results from high-cardinality custom metrics and too many unique label combinations. Reduce the number of custom metrics or increase collection intervals in the agent configuration.
Host not appearing in dashboard: Verify the API key matches your Middleware account and that the target URL in the agent config is correct. For cloud integrations, check IAM permissions. Initial discovery can take 5–10 minutes.
For teams also tracking servers outside cloud infrastructure, pairing VM monitoring with endpoint monitoring gives complete coverage across physical and virtual environments.
Conclusion
Effective VM monitoring requires visibility at two levels: broad fleet coverage and deep per-host insight. Middleware provides both through cloud-native integrations that auto-discover instances and OpenTelemetry-based agents that surface process-level data, logs, and traces.
Start with your highest-impact VMs. Deploy agents, establish baselines, set time-windowed alerts, then expand coverage across your fleet using cloud integrations. Monitoring that starts at narrow, deliberate scales is better than monitoring that tries to cover everything at once.
Install the Middleware agent free → No credit card required. Your first VM reports in under 5 minutes.
FAQs
What are the common challenges in VM monitoring?
Common challenges in VM monitoring include alert fatigue from too many notifications, data silos that make it hard to get a unified view, scalability issues as environments grow, and high costs related to tools, storage, and resource usage.
What is the difference between host-level and guest-level VM monitoring?
Host-level monitoring gathers metrics from the hypervisor (physical host), such as CPU, memory, disk, and network usage across all VMs. It provides a high-level view of resource allocation and overall performance but lacks insight into what’s happening inside each VM.
Guest-level monitoring collects data from within the VM’s operating system, offering detailed insights like application performance, process activity, and OS-level metrics. It helps diagnose issues inside the VM that host-level monitoring cannot detect.
Does Middleware support monitoring VMs across AWS, Azure, and GCP?
Yes. Middleware integrates with all three cloud providers. You can monitor VMs across AWS, Azure, and GCP from a single dashboard.
Can I monitor VMs without installing an agent?
Yes. Connect Middleware to CloudWatch, Azure Monitor, or GCP Cloud Monitoring. You get basic VM metrics without installing anything. The trade-off is that you don’t get process-level details or logs.
How does Middleware handle VM instances in auto-scaling groups?
Use user data scripts to install the agent when instances boot. Or use cloud provider integrations for automatic discovery. Both approaches work. Agent-based gives you deep metrics. Cloud-native gives you basic fleet visibility without deployment work.
What’s the resource overhead of running the Middleware agent on a VM?
The agent uses around 200MB of memory and minimal CPU. It’s designed to run on production servers without impacting performance.
Can I use Middleware alongside my existing monitoring tools like Datadog or Prometheus?
Yes. The Middleware agent is built on OpenTelemetry. You can send data to multiple destinations. Middleware also integrates with Datadog agents for dual-shipping scenarios.
If you’re evaluating options, see our breakdown of the top infrastructure monitoring tools to understand how Middleware compares.